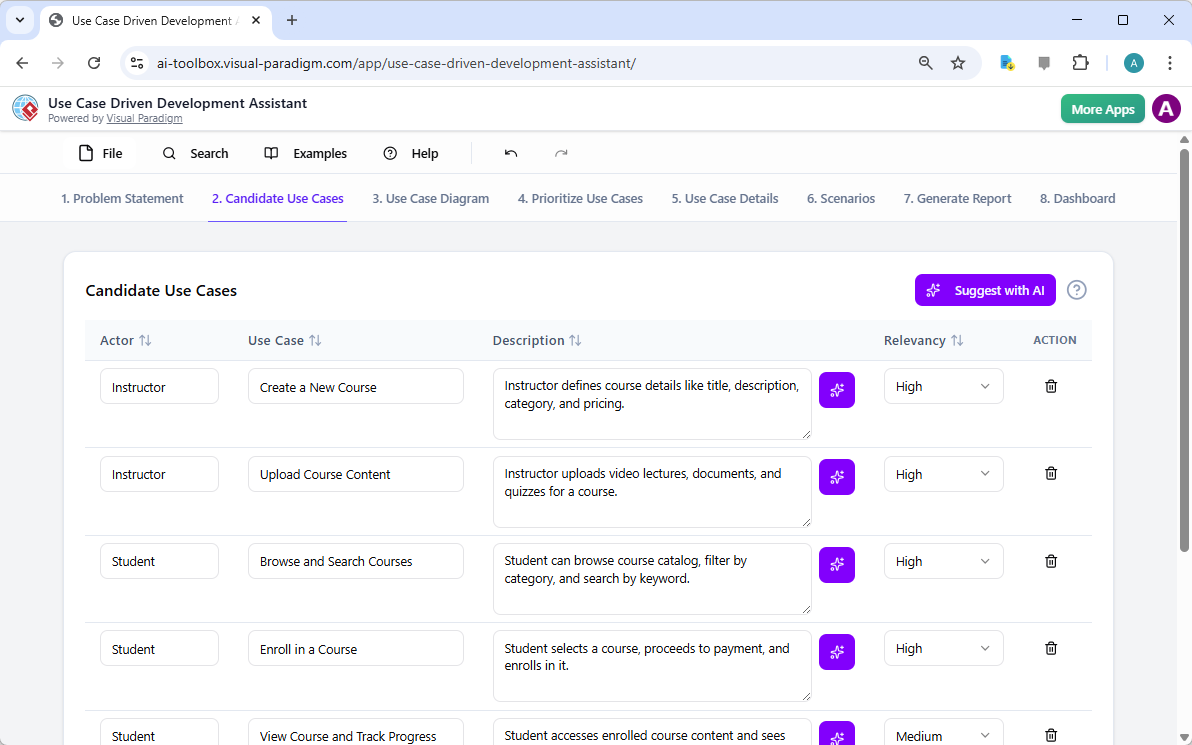
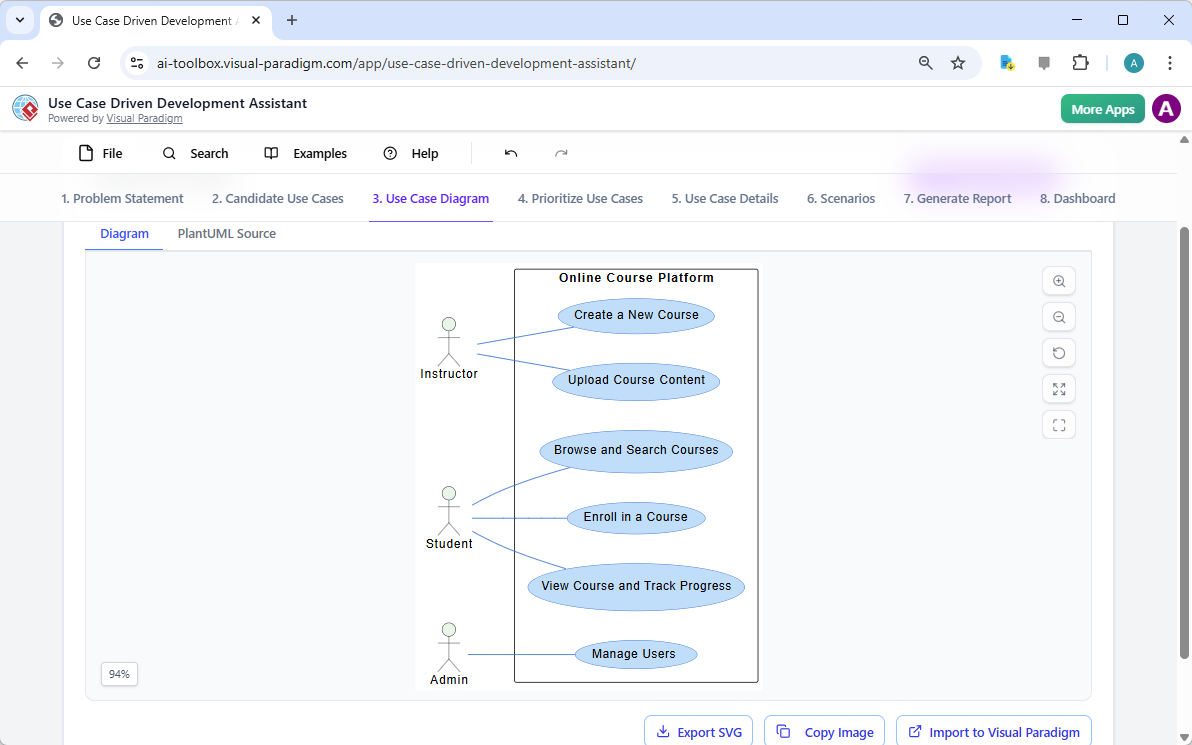
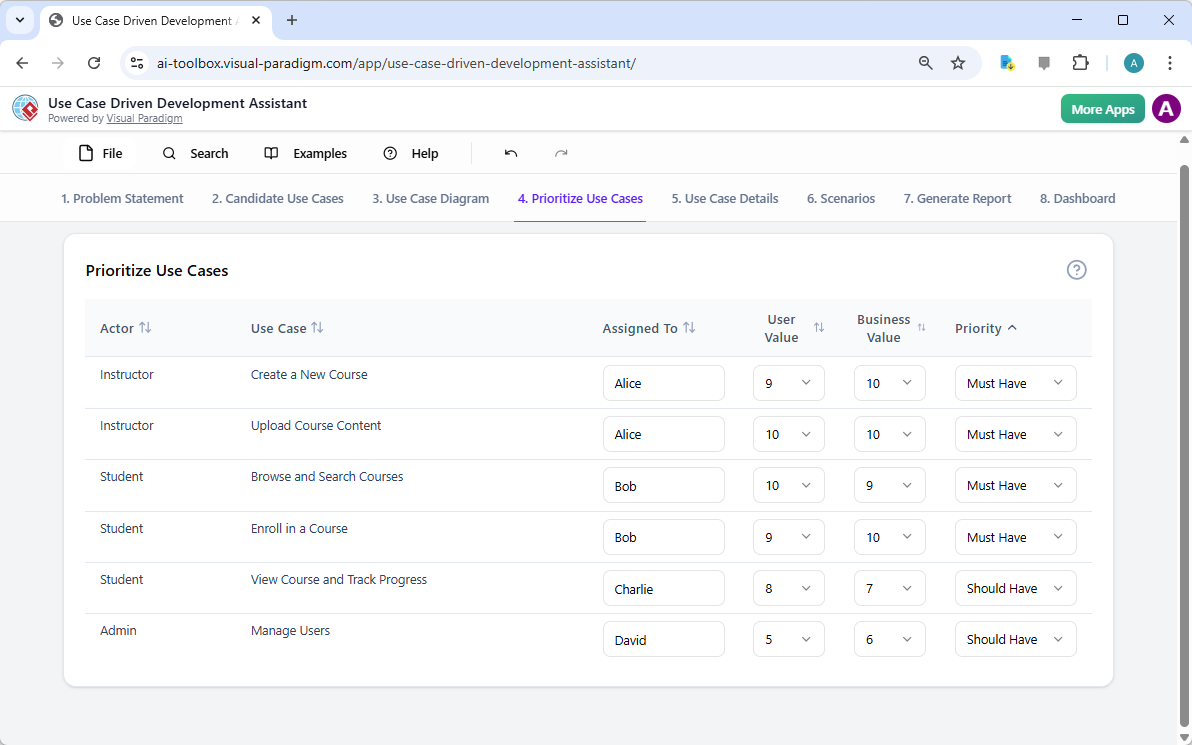
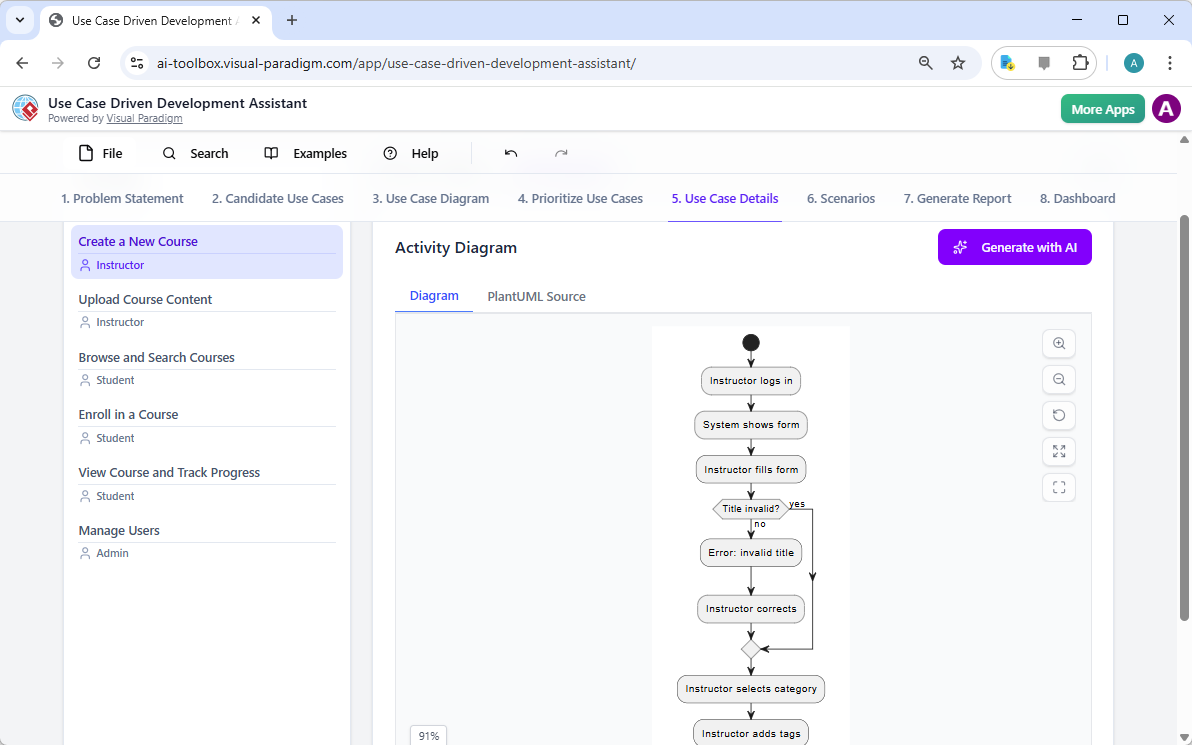
Comprehensive Guide to Class Diagrams in UML

Introduction

A class diagram is a static type of Unified Modeling Language (UML) diagram that visually represents the structure of a system by showing its classes, attributes, operations, and relationships between objects. It serves as a blueprint for object-oriented software design, providing a clear and concise way to understand and document the architecture of a system.

Purpose and Functionality

Visualizing System Structure

Class diagrams help developers understand and document the structure of a system by showing how different classes interact and relate to each other. This visual representation is crucial for designing robust and maintainable software systems.

Modeling Software

Class diagrams enable the modeling of software at a high level of abstraction, allowing developers to focus on the design without delving into the source code. This abstraction helps in identifying potential issues early in the development process.

Object-Oriented Design

Class diagrams are fundamental to object-oriented modeling. They outline the building blocks of a system and their interactions, making it easier to implement object-oriented principles such as encapsulation, inheritance, and polymorphism.

Data Modeling

Class diagrams can also be used for data modeling, representing the structure and relationships of data within a system. This is particularly useful in database design, where entities and their relationships need to be clearly defined.

Blueprint for Code

Class diagrams serve as a blueprint for constructing executable code for software applications. They provide a clear roadmap for developers, ensuring that the implementation aligns with the designed architecture.

Key Components

Classes

Classes are represented by rectangles divided into three sections:

  1. Class Name: The top section contains the name of the class.
  2. Attributes: The middle section lists the attributes or data members that define the state of the class.
  3. Operations (Methods): The bottom section lists the operations or functions that the class can perform.

Relationships

Relationships between classes are shown using lines and symbols:

  1. Generalization: Represents inheritance, where a class (subclass) inherits attributes and operations from another class (superclass). It is depicted by a hollow arrowhead pointing from the subclass to the superclass.
  2. Aggregation: Indicates that one class contains instances of another class, but the contained class can exist independently. It is depicted by a hollow diamond at the end of the line connected to the containing class.
  3. Composition: A stronger form of aggregation where the contained class cannot exist without the containing class. It is depicted by a filled diamond at the end of the line connected to the containing class.
  4. Association: Represents a relationship between two classes, indicating that one class uses or interacts with another. It is depicted by a solid line connecting the two classes.

Example Diagrams using PlantUML

Basic Class Diagram

Diagram with Aggregation and Composition

Diagram with Association

Example –  Order system

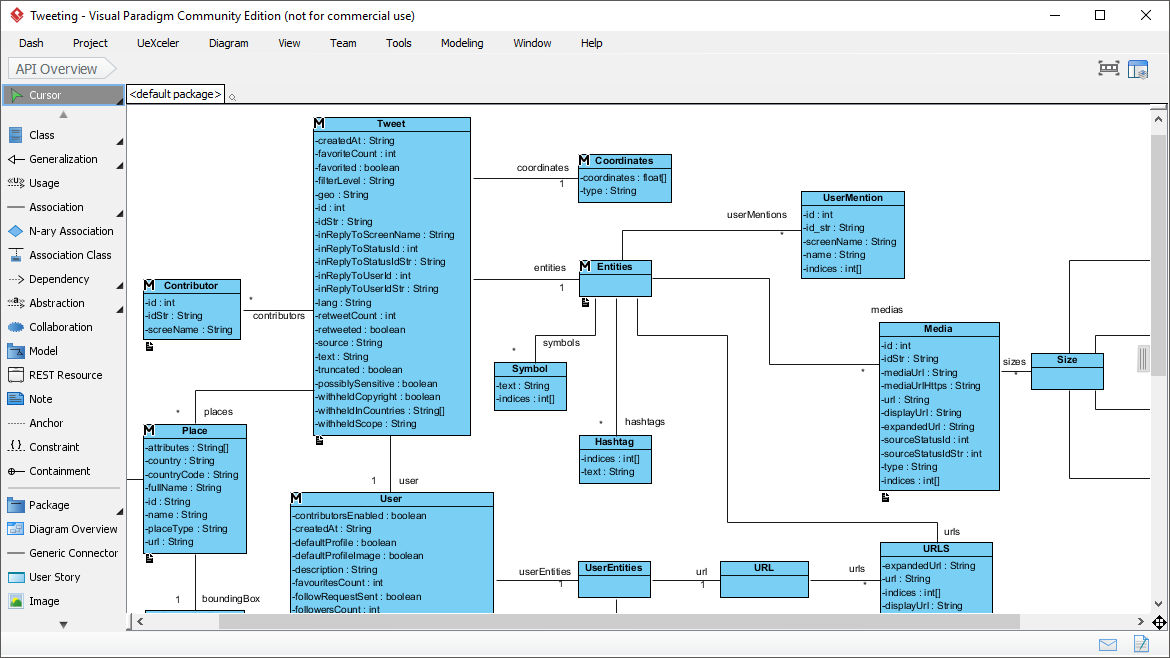
SDE | Uml Class Diagrams

Key Elements

  1. Classes:

    • Customer: Represents the customer placing the order.
      • Attributes: name (String), address (String).
    • Order: Represents the order placed by the customer.
      • Attributes: date (Date), status (String).
      • Operations: calcSubTotal()calcTax()calcTotal()calcTotalWeight().
    • OrderDetail: Represents the details of each item in the order.
      • Attributes: quantity (int), taxStatus (String).
      • Operations: calcSubTotal()calcWeight()calcTax().
    • Item: Represents the items being ordered.
      • Attributes: shippingWeight (float), description (String).
      • Operations: getPriceForQuantity()getTax()inStock().
    • Payment (Abstract Class): Represents the payment for the order.
      • Attributes: amount (float).
    • Cash: Subclass of Payment, represents cash payments.
      • Attributes: cashTendered (float).
    • Check: Subclass of Payment, represents check payments.
      • Attributes: name (String), bankID (String), isAuthorized (boolean).
    • Credit: Subclass of Payment, represents credit card payments.
      • Attributes: number (String), type (String), expDate (Date), isAuthorized (boolean).
  2. Relationships:

    • Association:
      • Customer and Order: A customer can place multiple orders (0..* multiplicity on the Order side).
      • Order and OrderDetail: An order can have multiple order details (1..* multiplicity on the OrderDetail side).
      • OrderDetail and Item: Each order detail is associated with one item (1 multiplicity on the Item side).
    • Aggregation:
      • Order and OrderDetail: Indicates that OrderDetail is a part of Order, but OrderDetail can exist independently.
    • Generalization:
      • Payment and its subclasses (CashCheckCredit): Indicates inheritance, where Cash, Check, and Credit are specific types of Payment.
    • Role:
      • OrderDetail and Item: The role line item indicates the specific role of OrderDetail in the context of an Order.
  3. Multiplicity:

    • Indicates the number of instances of one class that can be associated with a single instance of another class. For example, a Customer can place multiple Orders (0..*).
  4. Abstract Class:

    • Payment: Marked as an abstract class, meaning it cannot be instantiated directly and serves as a base class for other payment types.

Explanation

  • Customer: Represents the entity placing the order, with basic attributes like name and address.
  • Order: Represents the order itself, with attributes like date and status, and operations to calculate subtotal, tax, total, and total weight.
  • OrderDetail: Represents the details of each item in the order, including quantity and tax status, with operations to calculate subtotal, weight, and tax.
  • Item: Represents the items being ordered, with attributes like shipping weight and description, and operations to get price for quantity, tax, and stock status.
  • Payment: An abstract class representing the payment for the order, with an attribute for the amount. It has subclasses for different payment methods:
    • Cash: Represents cash payments with an attribute for the cash tendered.
    • Check: Represents check payments with attributes for the name, bank ID, and authorization status.
    • Credit: Represents credit card payments with attributes for the card number, type, expiration date, and authorization status.

The diagram effectively captures the structure and relationships within an order processing system, providing a clear visual representation of how different components interact.

Conclusion

Class diagrams are an essential tool in UML modeling, providing a clear and structured way to represent the architecture of a system. By understanding the key components and relationships, developers can create robust and maintainable software designs. Using tools like PlantUML, these diagrams can be easily visualized and shared among team members, enhancing collaboration and ensuring a consistent understanding of the system’s structure.

References

  1. Visual Paradigm Online Free Edition:

    • Visual Paradigm Online (VP Online) Free Edition is a free online drawing software that supports Class Diagrams, other UML diagrams, ERD tools, and Organization Chart tools. It features a simple yet powerful editor that allows you to create Class Diagrams quickly and easily. The tool offers unlimited access with no restrictions on the number of diagrams or shapes you can create, and it is ad-free. You own the diagrams you create for personal and non-commercial use. The editor includes features such as drag-to-create shapes, inline editing of class attributes and operations, and a variety of formatting tools. You can also print, export, and share your work in different formats (PNG, JPG, SVG, GIF, PDF) 123.
  2. Impressive Drawing Features:

    • Visual Paradigm Online provides advanced formatting options to enhance your diagrams. You can position shapes precisely using alignment guides and format your Class Diagrams with shape and line formatting options, font styles, rotatable shapes, embedded images and URLs, and shadow effects. The tool is cross-platform compatible (Windows, Mac, Linux) and can be accessed through any web browser. It also supports Google Drive integration for seamless saving and accessing of your diagrams 23.
  3. Comprehensive Diagramming Options:

    • Visual Paradigm Online supports a wide range of diagram types, including UML diagrams (class, use case, sequence, activity, state, component, and deployment diagrams), ERD tools, Organization Charts, Floor Plan Designers, ITIL, and Business Concept Diagrams. The tool is designed to be easy to use, with drag-and-drop functionality and smart connectors that snap into place. It also offers a rich set of formatting options, including over 40 connector types and various paint options 45.
  4. Learning and Customization:

    • Visual Paradigm provides an easy-to-use platform for creating and managing class diagrams, making it an excellent choice for software developers and engineers. You can customize your class diagrams by changing colors, fonts, and layout. The tool also supports creating relationships between classes, such as associations, inheritance, and dependencies. Visual Paradigm is a powerful UML modeling tool that helps in representing the static structure of a system, including the system’s classes, their attributes, methods, and the relationships between them 67.
  5. Community and Support:

    • Visual Paradigm Community Edition is a free UML software that supports all UML diagram types. It is designed to help users learn UML faster, easier, and quicker. The tool is intuitive and allows you to create your own Class Diagrams with ease. Visual Paradigm is trusted by over 320,000 professionals and organizations, including small businesses, Fortune 500 companies, universities, and government sectors. It is used to prepare the next generation of IT developers with the specialized skills needed for the workspace 89.

These references highlight the comprehensive features and benefits of using Visual Paradigm for creating class diagrams, making it a recommended tool for both individual and professional use.

Comprehensive Guide to UML Activity Diagrams: Key Concepts and Examples

Introduction

In the realm of software development and system modeling, UML (Unified Modeling Language) activity diagrams play a crucial role in visualizing the workflow of processes within a system. These diagrams provide a clear and structured way to represent the sequence of activities, decisions, and interactions involved in achieving specific goals. UML (Unified Modeling Language) activity diagrams are a powerful tool for modeling the workflow of a system, illustrating the sequence of activities, decisions, and processes involved in achieving a specific goal. This guide will cover the key concepts of UML activity diagrams, provide examples, and recommend Visual Paradigm as an ideal tool for IT software development.

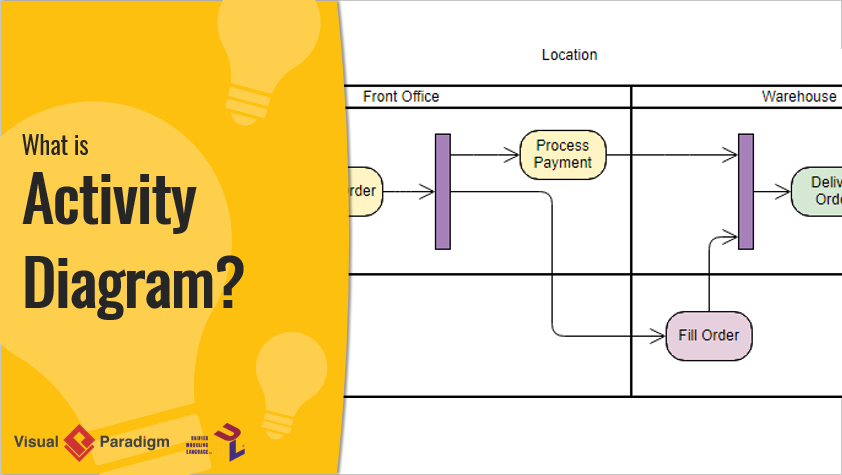
What is Activity Diagram?

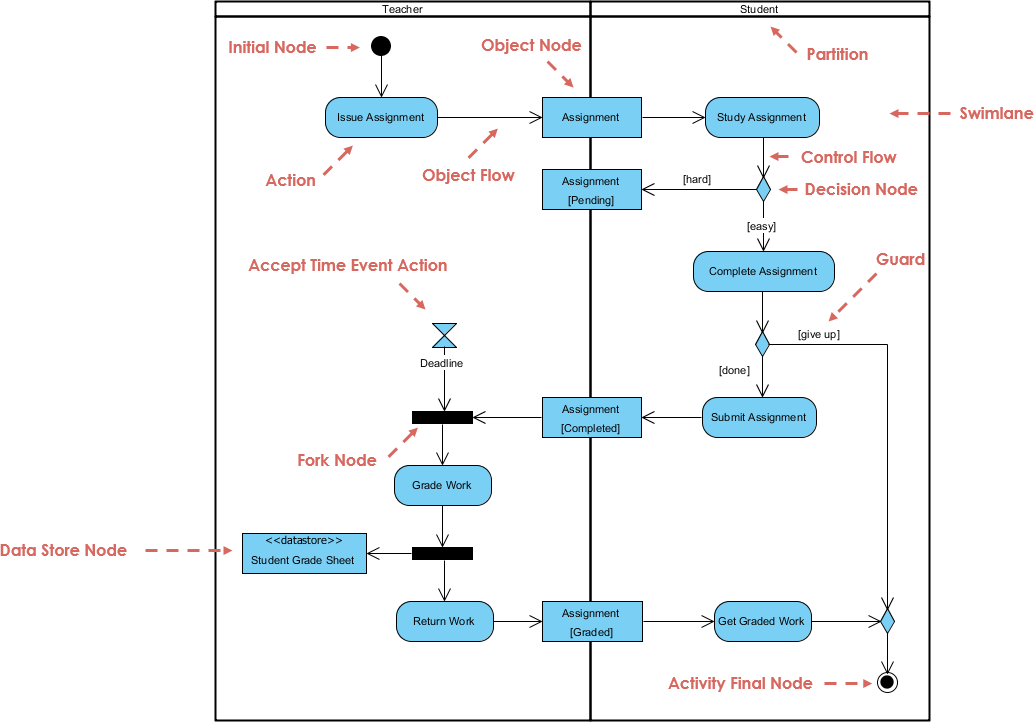
This article delves into the intricacies of UML activity diagrams, using a detailed example to illustrate the lifecycle of an assignment, from issuance to grading and return, involving both a teacher and a student. By breaking down the key components and workflow of the diagram, we aim to provide a comprehensive understanding of how UML activity diagrams can be used to model complex processes effectively. Whether you are a seasoned developer or new to UML, this guide will help you grasp the fundamentals and advanced concepts of activity diagrams, enabling you to apply them to your own projects with confidence.

Key Concepts of UML Activity Diagrams

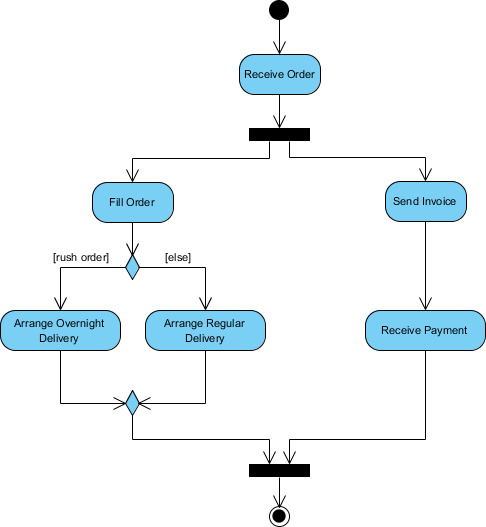
What is Activity Diagram?

  1. Activities:

    • Represent actions or tasks performed within the system.
    • Depicted as rounded rectangles.
  2. Actions:

    • The most basic unit of work in an activity diagram.
    • Represented as rectangles with rounded corners.
  3. Control Flow:

    • Shows the sequence in which activities are performed.
    • Represented by solid arrows connecting activities.
  4. Decision Nodes:

    • Represent points where the flow of control can branch based on conditions.
    • Depicted as diamonds.
  5. Fork and Join Nodes:

    • Fork nodes split a single flow into multiple concurrent flows.
    • Join nodes merge multiple flows back into a single flow.
    • Both are depicted as horizontal bars.
  6. Initial and Final Nodes:

    • Initial node represents the start of the workflow.
    • Final node represents the end of the workflow.
    • Both are depicted as black circles, with the initial node having an outgoing arrow and the final node having an incoming arrow.
  7. Object Flow:

    • Shows the flow of objects between activities.
    • Represented by dashed arrows.

Examples of UML Activity Diagrams

The activity diagram models the problem of managing the lifecycle of an assignment, from issuance to grading and return, involving interactions between a teacher and a student. The key aspects of the problem include:

  1. Assignment Issuance and Study:

    • The teacher issues an assignment, and the student studies it.
    • The student’s perception of the assignment’s difficulty influences their approach to completing it.
  2. Assignment Completion and Submission:

    • The student completes the assignment and submits it to the teacher.
    • The student may decide to give up on the assignment based on certain conditions.
  3. Deadline Management:

    • The teacher sets a deadline for the assignment submission.
    • The workflow accounts for the deadline and proceeds accordingly.
  4. Grading and Return:

    • The teacher grades the submitted assignment and stores the grades.
    • The graded assignment is returned to the student.
  5. Concurrent Activities:

    • The diagram models concurrent activities, such as grading the assignment and storing the grades, using fork and join nodes.

Key Components and Workflow

  1. Initial Node:

    • The process begins with the Initial Node, represented by a black circle. This indicates the start of the workflow.
  2. Issue Assignment (Teacher):

    • The teacher issues the assignment, represented by the action “Issue Assignment”.
    • An Object Node (Assignment) is created, indicating that an assignment object is generated.
  3. Assignment (Object Flow):

    • The assignment object flows from the teacher to the student, represented by the Object Flow arrow.
  4. Study Assignment (Student):

    • The student receives the assignment and begins studying it, represented by the action “Study Assignment”.
    • This action is within the Student swimlane, indicating that it is the student’s responsibility.
  5. Decision Node (Control Flow):

    • The student decides whether the assignment is hard or easy, represented by the Decision Node (diamond shape).
    • Depending on the decision, the control flow branches into two paths:
      • [hard]: If the assignment is hard, the student continues to study.
      • [easy]: If the assignment is easy, the student proceeds to complete the assignment.
  6. Complete Assignment (Student):

    • The student completes the assignment, represented by the action “Complete Assignment”.
    • Guard condition [give up] determines whether the student submits the assignment or gives up.
  7. Submit Assignment (Student):

    • If the student completes the assignment, they submit it, represented by the action “Submit Assignment”.
    • The assignment object flows back to the teacher, represented by the Object Flow arrow.
  8. Accept Time Event Action (Teacher):

    • The teacher sets a deadline for the assignment, represented by the Accept Time Event Action (hourglass symbol).
    • If the deadline is reached, the workflow proceeds to the Fork Node.
  9. Fork Node:

    • The Fork Node (thick horizontal bar) splits the workflow into two concurrent paths:
      • Grade Work (Teacher): The teacher grades the submitted assignment, represented by the action “Grade Work”.
      • Data Store Node: The graded assignment is stored in a datastore, represented by the Data Store Node (<<datastore>> Student Grade Sheet).
  10. Return Work (Teacher):

    • The teacher returns the graded work to the student, represented by the action “Return Work”.
    • The assignment object flows back to the student, represented by the Object Flow arrow.
  11. Get Graded Work (Student):

    • The student receives the graded work, represented by the action “Get Graded Work”.
  12. Activity Final Node:

    • The process ends with the Activity Final Node, represented by a black circle with a border, indicating the completion of the workflow.

This UML activity diagram effectively models the workflow of managing an assignment, highlighting the interactions between the teacher and the student, the decision points, and the concurrent activities involved. It provides a clear visual representation of the assignment lifecycle, from issuance to grading and return, making it easier to understand and manage the process.

Recommending Visual Paradigm for IT Software Development

While the examples above illustrate the basics of UML activity diagrams, Visual Paradigm offers a more comprehensive and visual approach to software development. Here’s why Visual Paradigm is an ideal tool for IT software development:

  1. Comprehensive UML Support:

    • Visual Paradigm supports all types of UML diagrams, including activity diagrams, class diagrams, sequence diagrams, and more.
    • It provides a rich set of tools and features for creating, editing, and managing UML diagrams.
  2. User-Friendly Interface:

    • The intuitive drag-and-drop interface makes it easy to create and modify UML diagrams.
    • The tool offers a wide range of customization options to tailor diagrams to specific needs.
  3. Integration with Other Tools:

    • Visual Paradigm integrates seamlessly with other development tools, such as IDEs, version control systems, and project management tools.
    • This integration ensures a smooth workflow and enhances productivity.
  4. Collaboration Features:

    • Visual Paradigm supports collaborative work, allowing multiple users to work on the same project simultaneously.
    • The tool includes features for version control, team collaboration, and real-time updates.
  5. Advanced Modeling Capabilities:

    • Visual Paradigm offers advanced modeling capabilities, including support for agile methodologies, enterprise architecture, and system modeling.
    • The tool provides a comprehensive suite of features for modeling complex systems and workflows.
  6. Extensive Documentation and Support:

    • Visual Paradigm provides extensive documentation, tutorials, and support resources to help users get started and master the tool.
    • The tool offers a range of learning resources, including video tutorials, guides, and examples.

Conclusion

UML activity diagrams are a powerful tool for modeling the workflow of a system, illustrating the sequence of activities, decisions, and processes involved in achieving a specific goal. The examples provided demonstrate the basics of creating UML activity diagrams. However, for a more comprehensive and visual approach to software development, Visual Paradigm is an ideal tool. With its comprehensive UML support, user-friendly interface, integration with other tools, collaboration features, advanced modeling capabilities, and extensive documentation and support, Visual Paradigm provides everything needed to create, manage, and collaborate on UML diagrams effectively. Whether you are a beginner or an experienced developer, Visual Paradigm offers the tools and support needed to bring your software development projects to life.

Tutorial: UML vs BPMN – Key Concepts and Examples

Introduction

Unified Modeling Language (UML) and Business Process Model and Notation (BPMN) are two popular modeling languages used in software development and business process management. While both serve to visualize and document processes, they cater to different aspects of system design and have distinct purposes. This tutorial will compare UML and BPMN, highlighting their key concepts, differences, and providing examples to illustrate their use cases.

Free Online UML Tool - Visual Paradigm

Key Concepts

Unified Modeling Language (UML)

UML is a standardized modeling language used primarily in software engineering to specify, visualize, construct, and document the artifacts of software systems. It provides a set of diagrams to represent the structure and behavior of a system.

Key Diagrams in UML

  1. Class Diagram

    • Represents the static structure of a system by showing the system’s classes, attributes, methods, and the relationships among classes.
    • Example: A class diagram for a library management system showing classes like BookMember, and Loan.
  2. Sequence Diagram

    • Shows how objects interact in a particular scenario of a use case, focusing on the sequence of messages exchanged.
    • Example: A sequence diagram for the Checkout use case in an online shopping system.
  3. Use Case Diagram

    • Captures the functional requirements of a system by showing the interactions between users (actors) and the system.
    • Example: A use case diagram for an online shopping system showing use cases like Browse ProductsAdd to Cart, and Checkout.
  4. Activity Diagram

    • Models the workflow of a system by showing the sequence of activities and the flow of control.
    • Example: An activity diagram for the Order Processing workflow in an online shopping system.

Business Process Model and Notation (BPMN)

BPMN is a graphical representation for specifying business processes in a workflow. It is designed to be understandable by all business stakeholders, from business analysts to technical developers.

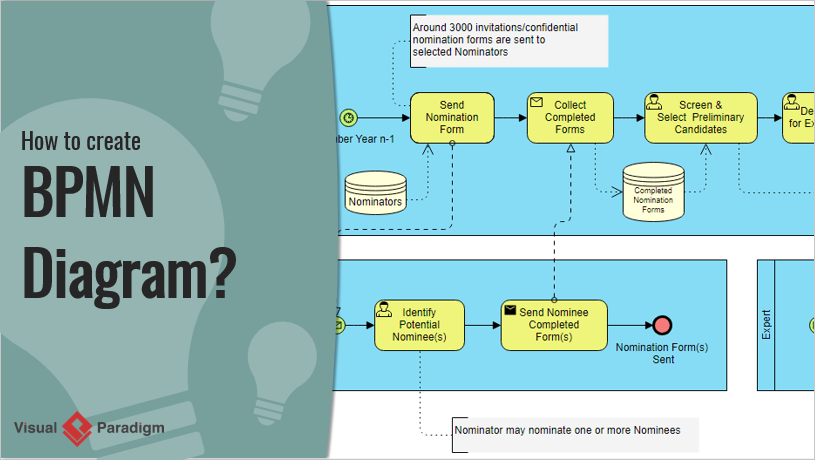
How to Create BPMN Diagram? Visual Paradigm

Key Elements in BPMN

  1. Events

    • Represent something that happens during a process, such as a start event, end event, or intermediate event.
    • Example: A start event triggered by a customer placing an order.
  2. Activities

    • Represent the work performed within a process. Activities can be tasks or sub-processes.
    • Example: A task to Process Payment in an order fulfillment process.
  3. Gateways

    • Control the flow of a process, determining the branching, forking, merging, and joining of paths.
    • Example: A gateway that decides whether to Ship Order or Cancel Order based on payment status.
  4. Flow Objects

    • Include events, activities, and gateways, connected by sequence flows to define the order of execution.
    • Example: A sequence flow from Process Payment to Ship Order.

UML vs BPMN: Key Differences

  1. Purpose

    • UML: Primarily used for software design and development, focusing on the structure and behavior of software systems.
    • BPMN: Used for business process management, focusing on the workflow and interactions within business processes.
  2. Audience

    • UML: Targeted at software developers, architects, and engineers.
    • BPMN: Targeted at business analysts, process owners, and stakeholders involved in business operations.
  3. Scope

    • UML: Covers a wide range of diagrams for different aspects of software systems, including structure, behavior, and interactions.
    • BPMN: Focuses specifically on business processes, providing a detailed representation of workflows and interactions.
  4. Complexity

    • UML: Can be complex due to the variety of diagrams and notations, requiring a deeper understanding of software engineering concepts.
    • BPMN: Generally simpler and more intuitive, designed to be understood by non-technical stakeholders.

Examples

Example 1: Online Shopping System

UML Use Case Diagram

  • Actors: Customer, Admin
  • Use Cases: Browse Products, Add to Cart, Checkout, Manage Inventory
  • Description: Shows the interactions between customers and the online shopping system, highlighting the main functionalities.

BPMN Process Diagram

  • Events: Start (Customer places order), End (Order shipped)
  • Activities: Process Payment, Prepare Order, Ship Order
  • Gateways: Decision gateway to check payment status
  • Description: Illustrates the workflow of order processing, from payment to shipping, with clear decision points.

Example 2: Library Management System

UML Class Diagram

  • Classes: Book, Member, Loan
  • Relationships: Member borrows Book, Loan associates Member and Book
  • Description: Represents the static structure of the library management system, showing the relationships between key entities.

BPMN Process Diagram

  • Events: Start (Member requests book), End (Book returned)
  • Activities: Check Availability, Issue Book, Send Reminder
  • Gateways: Decision gateway to check book availability
  • Description: Shows the workflow of borrowing a book, from request to return, with decision points for availability checks.

The Key Differences between UML and BPMN

Here is a comparative table highlighting the key differences between UML and BPMN:

Feature UML (Unified Modeling Language) BPMN (Business Process Model and Notation)
Purpose Primarily used for software design and development, focusing on the structure and behavior of software systems. Used for business process management, focusing on the workflow and interactions within business processes.
Audience Targeted at software developers, architects, and engineers. Targeted at business analysts, process owners, and stakeholders involved in business operations.
Scope Covers a wide range of diagrams for different aspects of software systems, including structure, behavior, and interactions. Focuses specifically on business processes, providing a detailed representation of workflows and interactions.
Complexity Can be complex due to the variety of diagrams and notations, requiring a deeper understanding of software engineering concepts. Generally simpler and more intuitive, designed to be understood by non-technical stakeholders.
Key Diagrams/Elements – Class Diagram
– Sequence Diagram
– Use Case Diagram
– Activity Diagram
– State Machine Diagram
– Component Diagram
– Events (Start, End, Intermediate)
– Activities (Tasks, Sub-processes)
– Gateways (Decision, Parallel, Event-based)
– Flow Objects (Sequence Flow, Message Flow)
Example Use Cases – Software architecture design
– System behavior modeling
– Requirements analysis
– Object-oriented design
– Business process mapping
– Workflow automation
– Process improvement
– Business-IT alignment
Integration Often integrated with software development tools and IDEs. Often integrated with business process management suites and enterprise architecture tools.
Standardization Standardized by the Object Management Group (OMG). Standardized by the Object Management Group (OMG).
Flexibility Highly flexible with various diagrams to model different aspects of a system. More focused on business processes but can be extended with additional notations for specific needs.
Visualization Provides a comprehensive view of the system’s architecture and behavior. Provides a clear and intuitive view of business processes and workflows.

This table summarizes the key differences between UML and BPMN, helping you understand their respective strengths and use cases in software development and business process management.

Recommended UML and BPMN Tool

Visual Paradigm is highly recommended for using both UML and BPMN due to its comprehensive features and seamless integration of both modeling languages. Here are some key reasons why Visual Paradigm stands out:

  1. Comprehensive Modeling Support: Visual Paradigm supports a wide range of modeling standards, including UML, BPMN, ERD, DFD, and more. This makes it a versatile tool for various types of software development and business process management projects 910.

  2. Integrated Environment: The tool provides an all-in-one suite that integrates UML and BPMN modeling with agile development tools, project management diagrams, and code engineering capabilities. This integration helps in managing projects effortlessly and ensures a smooth transition from design to implementation 911.

  3. Ease of Use: Visual Paradigm offers an intuitive and easy-to-use interface, making it accessible for both beginners and experienced users. The tool includes features like auto-stretched pools, smart connector-correction, and expandable sub-processes, which simplify the modeling process 11.

  4. Code Engineering: The tool bridges the gap between UML design models and source code by supporting code generation and reverse engineering. This feature is beneficial for developers as it helps in maintaining consistency between the design and implementation 10.

  5. Collaborative Features: Visual Paradigm supports real-time and asynchronous team collaboration, allowing multiple team members to work on the same project simultaneously. This feature is crucial for agile teams that require constant communication and collaboration 9.

  6. High-Quality Documentation: The tool enables the generation of high-quality process documents and reports, which are essential for documentation and stakeholder communication. This feature helps in maintaining clear and concise records of the project’s progress and design decisions 10.

  7. Industry Recognition: Visual Paradigm is trusted by leading enterprises and has won major IT awards. Its industry-unique TOGAF ADM lifecycle tool and other enterprise architecture tools make it a reliable choice for professional use 9.

  8. Affordability: Visual Paradigm offers a highly affordable visual modeling toolset that supports UML, BPMN, and other essential diagrams. This makes it accessible for small teams, personal users, and students without compromising on features 10.

  9. Tutorials and Support: Visual Paradigm provides a range of free tutorials and resources to help users get started with UML and BPMN modeling. These resources include step-by-step guides, videos, and documentation, ensuring that users can effectively use the tool for their projects 1213.

In conclusion, Visual Paradigm’s comprehensive feature set, ease of use, collaborative capabilities, and industry recognition make it an ideal choice for teams looking to integrate UML and BPMN modeling into their software development and business process management projects.

Conclusion

UML and BPMN serve different purposes in the realm of system design and process management. UML is ideal for software development, providing a comprehensive set of diagrams to model the structure and behavior of software systems. BPMN, on the other hand, is tailored for business process management, offering a clear and intuitive way to visualize workflows and interactions within business processes. Understanding the key concepts and differences between UML and BPMN will help you choose the right tool for your specific needs and ensure effective communication and documentation in your projects.

Comprehensive Guide to Unified Modeling Language (UML)

Introduction to UML

Unified Modeling Language (UML) is a standardized modeling language consisting of an integrated set of diagrams designed to help you visualize the design of a system. UML is widely used in software engineering to specify, visualize, construct, and document the artifacts of software systems. It provides a standard way to visualize a system’s architectural blueprints, including elements such as actors, processes, activities, logical groupings, annotations, and so on.

Free UML Tool

Key Concepts

1. Model

A model in UML is a simplified representation of a system or a part of a system. It helps in understanding and communicating the design and structure of the system.

2. Diagrams

UML diagrams are graphical representations of a system’s architecture. They are categorized into two main types: structural diagrams and behavioral diagrams.

3. Elements

UML elements are the basic building blocks used to create models. They include classes, objects, interfaces, components, nodes, use cases, actors, and more.

4. Relationships

Relationships in UML define how elements are connected to each other. Common relationships include associations, generalizations, dependencies, and realizations.

5. Notations

UML uses a standard set of notations to represent different elements and relationships. These notations help in creating consistent and understandable diagrams.

Diagram Types

UML consists of 14 types of diagrams, which are divided into two main categories: structural diagrams and behavioral diagrams.

Overview of the 14 UML Diagram Types

Structural Diagrams

  1. Class Diagram

    • Represents the static structure of a system by showing the system’s classes, attributes, methods, and the relationships among classes.
    • Example: A class diagram for a library management system showing classes like BookMember, and Loan.
  2. Object Diagram

    • Shows a snapshot of the detailed state of a system at a particular point in time.
    • Example: An object diagram representing instances of Book and Member classes in a library system.
  3. Component Diagram

    • Illustrates the organization and dependencies among a set of components.
    • Example: A component diagram for a web application showing components like UIBusiness Logic, and Database.
  4. Deployment Diagram

    • Shows the physical deployment of artifacts on nodes.
    • Example: A deployment diagram for a web application showing servers, databases, and their interactions.
  5. Package Diagram

    • Organizes elements of a model into groups, providing a way to structure and manage complex systems.
    • Example: A package diagram for a software project showing packages like UIServices, and Data Access.
  6. Profile Diagram

    • Customizes UML models with standard extension mechanisms.
    • Example: A profile diagram extending UML for a specific domain like healthcare or finance.

Behavioral Diagrams

  1. Use Case Diagram

    • Captures the functional requirements of a system by showing the interactions between users (actors) and the system.
    • Example: A use case diagram for an online shopping system showing use cases like Browse ProductsAdd to Cart, and Checkout.
  2. Sequence Diagram

    • Shows how objects interact in a particular scenario of a use case, focusing on the sequence of messages exchanged.
    • Example: A sequence diagram for the Checkout use case in an online shopping system.
  3. Communication Diagram

    • Emphasizes the structural relationships between objects and the messages they exchange.
    • Example: A communication diagram for the Checkout use case showing the interactions between CustomerOrder, and Payment objects.
  4. State Machine Diagram

    • Represents the states of an object and the transitions between states due to events.
    • Example: A state machine diagram for a Order object in an online shopping system.
  5. Activity Diagram

    • Models the workflow of a system by showing the sequence of activities and the flow of control.
    • Example: An activity diagram for the Order Processing workflow in an online shopping system.
  6. Interaction Overview Diagram

    • Provides a high-level overview of the interactions between different parts of a system.
    • Example: An interaction overview diagram for the Order Processing workflow showing the interactions between CustomerOrder, and Payment components.
  7. Timing Diagram

    • Shows the interactions between objects in a single axis representing time.
    • Example: A timing diagram for the Order Processing workflow showing the timing of interactions between CustomerOrder, and Payment objects.

Applications Areas

UML is widely used in various domains and industries, including:

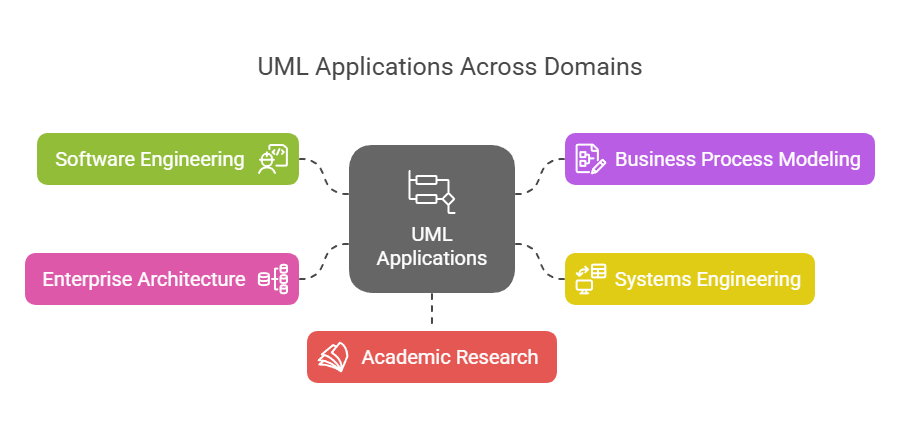
UML Applications Areas - Visual Paradigm

  1. Software Engineering

    • Software design and architecture
    • Requirements analysis and specification
    • System modeling and documentation
  2. Business Process Modeling

    • Workflow analysis and optimization
    • Business process reengineering
  3. Systems Engineering

    • Hardware and software co-design
    • Embedded systems development
  4. Enterprise Architecture

    • Enterprise-wide system integration
    • IT strategy and planning
  5. Academic Research

    • Formal methods and verification
    • Software engineering education

Examples

Example 1: Library Management System

  • Class Diagram

    • Classes: BookMemberLoan
    • Relationships: Member borrows BookLoan associates Member and Book
  • Use Case Diagram

    • Actors: LibrarianMember
    • Use Cases: Borrow BookReturn BookSearch Catalog
  • Sequence Diagram

    • Scenario: Borrow Book
    • Objects: MemberLibrarianBookLoan
    • Messages: Member requests to borrow BookLibrarian checks availability, Loan is created

Example 2: Online Shopping System

  • Class Diagram

    • Classes: CustomerProductOrderPayment
    • Relationships: Customer places OrderOrder contains ProductPayment processes Order
  • Use Case Diagram

    • Actors: CustomerAdmin
    • Use Cases: Browse ProductsAdd to CartCheckoutManage Inventory
  • Activity Diagram

    • Workflow: Order Processing
    • Activities: Customer places orderOrder is validatedPayment is processedOrder is shipped

Conclusion

UML is a powerful and versatile modeling language that helps in visualizing, specifying, constructing, and documenting the artifacts of software systems. Its wide range of diagrams and standardized notations make it an essential tool for software engineers, business analysts, and system architects. By understanding the key concepts, diagram types, and application areas of UML, you can effectively use it to design and communicate complex systems.

Visual Paradigm is highly recommended as the best UML tool for IT software development teams due to its comprehensive suite of features and seamless integration with agile methodologies. Here are some key reasons why Visual Paradigm stands out:

  1. Comprehensive Modeling Support: Visual Paradigm supports a wide range of modeling standards, including UML, SysML, BPMN, ERD, DFD, and ArchiMate. This makes it a versatile tool for various types of software development projects 123.

  2. Agile Integration: Visual Paradigm is designed to aid agile software development processes. It integrates UML modeling with agile practices such as Scrum and Kanban, allowing teams to create UML diagrams as needed to support communication and documentation without compromising agility 45.

  3. Collaborative Features: The tool supports real-time and asynchronous team collaboration, enabling multiple team members to work on the same project simultaneously. This feature is crucial for agile teams that require constant communication and collaboration 15.

  4. Code Engineering Capabilities: Visual Paradigm offers code generation and reverse engineering capabilities, which can significantly speed up the development process. It supports various technologies such as ORM and REST, making it easier to transition from design to implementation 16.

  5. User-Friendly Interface: The tool provides an intuitive and easy-to-use interface, which helps in creating and managing complex diagrams efficiently. It also includes features like wireframing, storyboarding, and prototyping, which are essential for UX design 15.

  6. Integration with IDEs: Visual Paradigm integrates seamlessly with leading Integrated Development Environments (IDEs), ensuring a smooth transition from analysis to design and implementation. This integration reduces efforts across all stages of the software development lifecycle 7.

  7. Reporting and Documentation: The tool allows for the generation of professional reports in various formats such as PDF, Word, and HTML. This feature is beneficial for documentation and stakeholder communication 8.

  8. Industry Recognition: Visual Paradigm is trusted by millions of users, including government units, blue-chip companies, and educational institutions. It has won major IT awards, further validating its reliability and effectiveness in the industry 5.

In conclusion, Visual Paradigm’s robust feature set, agile integration, collaborative capabilities, and industry recognition make it an ideal choice for IT software development teams looking to enhance their UML modeling and software development processes.