


Data Flow Diagrams (DFDs) are a cornerstone of systems analysis and design. They provide a clear, visual representation of how data moves through a system—showing where it comes from, how it’s processed, where it’s stored, and where it goes. For business analysts, developers, and system designers, DFDs help clarify complex systems, uncover inefficiencies, and align stakeholders around a shared understanding.
With the rise of AI-powered modeling tools, creating accurate, professional DFDs has become faster, more accurate, and far less manual. This guide explores the fundamentals of DFDs and how modern platforms—like Visual Paradigm—use artificial intelligence to streamline the entire modeling process.
What Is a Data Flow Diagram?
A Data Flow Diagram is a graphical tool that illustrates the flow of information within a system. It helps map out the logic of a system without getting bogged down in technical details. DFDs are especially useful during the early stages of system design, where the focus is on understanding data movement rather than implementation specifics.
At a high level, DFDs consist of four core components:
- External Entities: These represent sources or destinations of data outside the system—such as users, other systems, or external organizations. They are typically shown as rectangles or ovals.
- Processes: These are the activities that transform incoming data into output. Each process is usually represented by a circle or a rounded rectangle and labeled with a descriptive action (e.g., “Validate User Input”).
- Data Stores: These are repositories where data is held temporarily or permanently—like databases, files, or cloud storage. They are shown as open-ended rectangles.
- Data Flows: These are directed arrows that show the path of data between entities, processes, and data stores. Each flow is labeled with the type of data being transferred (e.g., “Customer Order,” “Payment Confirmation”).
DFDs are typically created in levels: a high-level Context Diagram (Level 0) shows the system as a single process interacting with external entities, while Level 1 and Level 2 diagrams break down that process into more detailed sub-processes.
Why DFDs Matter in Modern Systems Design
DFDs offer clarity in complex environments. They help teams:
- Identify missing data flows or redundant processes
- Understand system boundaries and dependencies
- Communicate system logic across technical and non-technical roles
- Support requirements analysis and system documentation
Despite their value, traditional DFD creation can be time-consuming. Drawing diagrams by hand or using basic software often involves repetitive effort, manual alignment, and a high risk of errors—especially when maintaining consistency across multiple levels.
The AI-Powered Evolution of DFD Creation
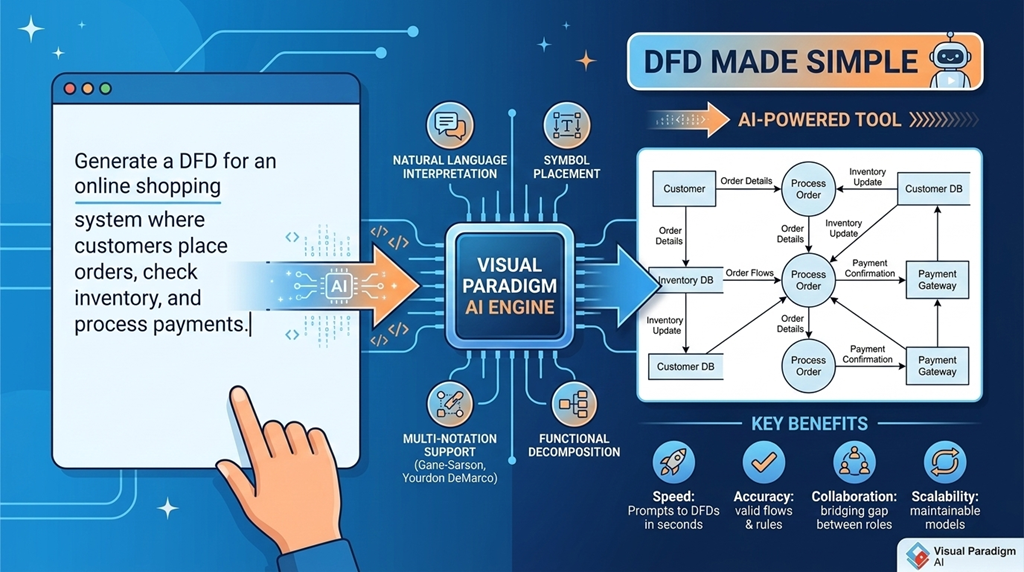
Platforms like Visual Paradigm have transformed DFD modeling by integrating AI into every stage of the process. Instead of starting from a blank canvas, users can generate complete diagrams from plain-text descriptions. This shift reduces friction and enables faster, more accurate modeling.
Key Features of AI-Driven DFD Tools
Visual Paradigm Desktop: AI Enabled Modeler
VP Desktop stands as Visual Paradigm’s flagship AI-powered diagram software. Here, AI diagram generation meets enterprise-grade tools for serious work.
Fire up the AI Diagram Generator inside VP Desktop. Select “Data Flow Diagram,” pick your notation and detail level (context, level 1, level 2+), then type a description like: “Generate a Data Flow Diagram for an online shopping system showing user registration, product browsing, order placement, payment processing, and inventory updates.” In seconds, the AI builds a clean, balanced DFD—entities as rectangles, processes as circles, data stores as open boxes, flows labeled clearly.
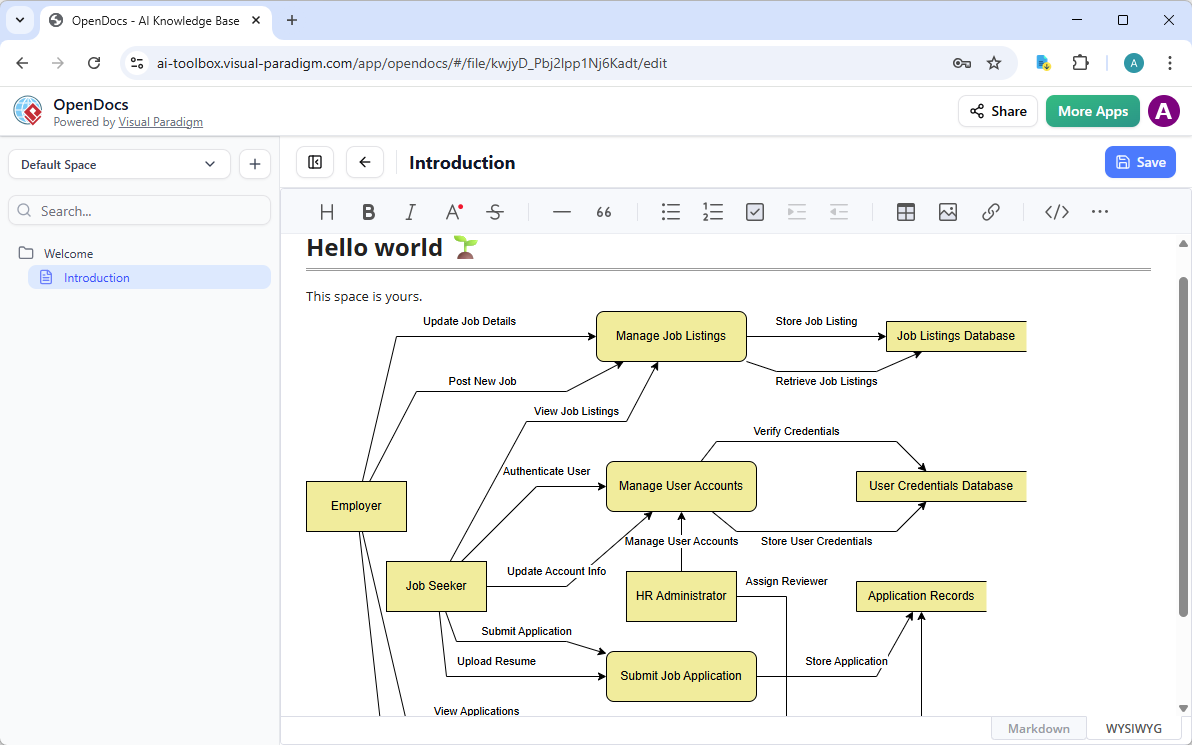
Visual Paradigm OpenDocs: Smart, AI Powered Knowledge Management Platform
Diagrams don’t live in isolation. They explain processes in reports, wikis, or knowledge bases. That’s where OpenDocs shines as part of Visual Paradigm’s AI platform for visual modeling and diagramming.
Visual Paradigm AI Chatbot for Visual Modelers
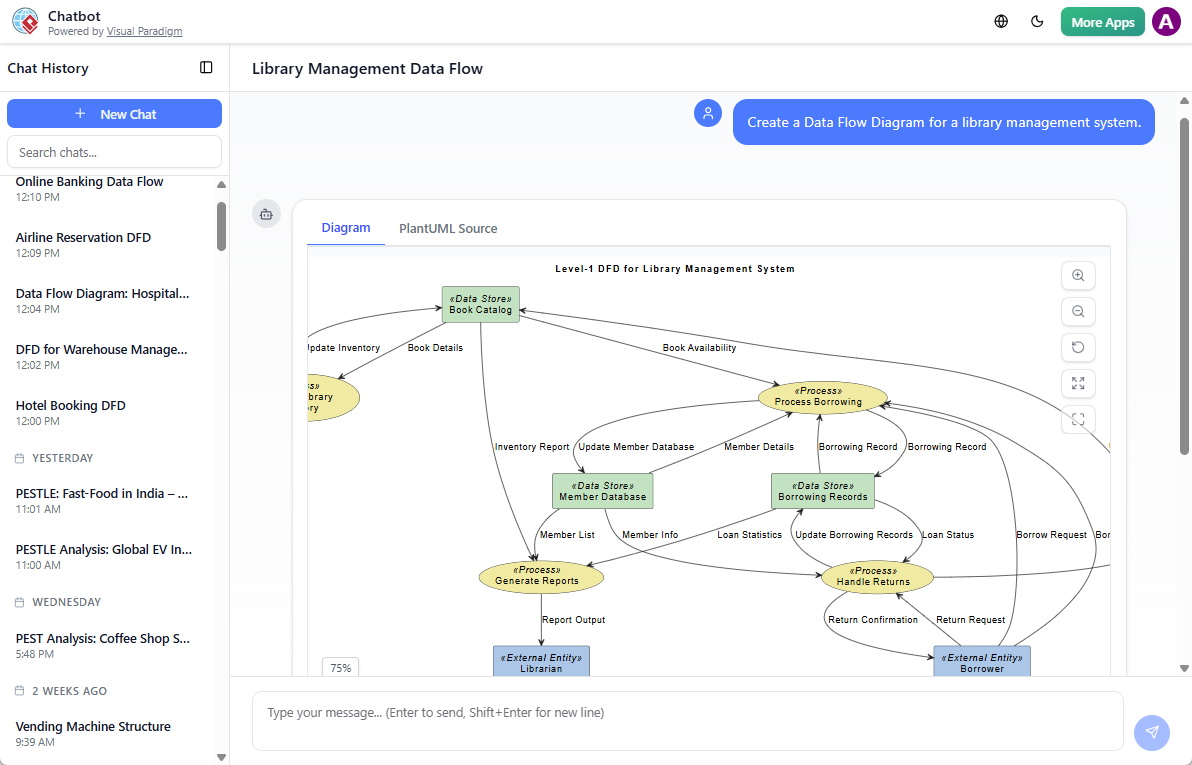
Sometimes you just need to brainstorm fast. Visual Paradigm’s AI Visual Modeling Chatbot turns diagramming into a conversation—ideal for overcoming that blank-canvas block.
Chat with the bot: “Create a Data Flow Diagram for a library management system.” It generates the DFD instantly. Or ask “Explain this data flow” or “Suggest improvements for security.”
Benefits of AI-Assisted DFD Modeling
- Faster Turnaround: Teams can move from concept to visual model in seconds, reducing design time by up to 90%.
- Error Reduction: AI ensures that flows are valid and follow notation rules—no more accidental direct data flows between data stores.
- Improved Collaboration: Non-technical stakeholders can describe system logic in plain language and see an accurate diagram instantly, bridging the gap between business and IT.
- Scalability: As systems grow, AI tools make it easier to maintain and update diagrams without manual effort.
Getting Started with AI-Generated DFDs
To create a Level-1 DFD, start with a clear system description. For example:
“A user logs into an e-commerce platform. The system authenticates the user, displays available products, allows them to add items to a cart, and processes the order. Payment is handled via a third-party gateway. The system updates inventory and sends a confirmation email.”
Input this into the AI Diagram Generator, select your preferred notation, and let the tool generate the diagram. Then use the chatbot to refine or expand the model.
Reference List
- Data Flow Diagram (DFD) Tool – Visual Paradigm: Comprehensive DFD editor supporting leveled diagrams, functional decomposition, entity/data store carry-over, drag-and-drop shapes, alignment guides, and AI-powered generation from system descriptions to visualize data flows, processes, external entities, and stores in multiple notations (Gane-Sarson, Yourdon DeMarco, Yourdon & Coad).
- New in OpenDocs: AI-Powered Data Flow Diagram (DFD) Support – Visual Paradigm Updates: Release announcement introducing AI generation of professional DFDs directly from natural language descriptions; supports standard, Yourdon DeMarco, Yourdon & Coad, and Gane-Sarson notations; diagrams are editable, embeddable in docs, collaborative in real-time Spaces, and compatible with relevant editions.
- AI-Powered DFD Generator via Visual Paradigm AI Chatbot – Updates: Details the conversational AI chatbot’s capabilities for instant DFD creation from text prompts (e.g., warehouse, hospital, banking systems), automatic element labeling/layout (processes, data stores, entities, flows), post-generation refinements through follow-up queries/edits, and quick visualization of data movement and transformations.
- Create Data Flow Diagrams from Text with AI – Visual Paradigm: Step-by-step guide to the AI workflow: choose DFD type and notation, input natural language system description, AI auto-identifies entities/processes/flows/data stores, generates editable diagram, supports decomposition, refinement, and export—saving time while maintaining accuracy and standards compliance.
- AI Diagram Generator: New DFD & ERD Support – Visual Paradigm Updates: Release highlights expanding AI capabilities to include DFD and ERD generation from text; improved stability, detail, and layout quality for non-UML diagrams, enabling faster modeling of data flows and database structures alongside existing UML/BPMN/SysML support.
- Visual Paradigm AI Diagram Generator Expansion: DFDs, ERDs, Mind Maps & More – ArchiMetric: Article on AI’s broadened scope beyond UML to include instant DFD creation from text, automatic notation selection (Gane-Sarson, Yourdon), refinement, and integration with documentation/reporting tools for system analysis, requirements documentation, and cross-diagram consistency.
- Comprehensive Guide to Visual Paradigm’s AI-Powered UML & Modeling Ecosystem (2025–2026) – Cybermedian: In-depth overview of AI as a modeling co-pilot, including DFD generation from text, conversational refinement, standards compliance across notations, traceability to requirements/UML, and future enhancements for efficient data flow/system modeling in software and enterprise contexts.
- Comprehensive Review: Visual Paradigm’s AI Diagram Generation Features – Fliplify: Third-party evaluation of AI tools for rapid, accurate diagram creation (including DFDs), standards adherence, conversational editing, usability for beginners/experts, and significant productivity gains in system analysis and process modeling workflows.
- Data-flow diagram – Wikipedia: General reference explaining DFDs as graphical representations of information flow within a system; covers levels (context, level 1/2+), core components (processes, external entities, data stores, data flows), common notations (Gane-Sarson, Yourdon DeMarco), symbols, and applications in requirements analysis and system design.