In the world of software engineering, modeling the architecture of a system is a fundamental skill. Whether you are designing a complex enterprise application or a simple web tool, visualizing your data and logic is essential. The Unified Modeling Language (UML) provides a standardized set of diagrams to achieve this. Among the most common and often confused diagrams are the Class Diagram and the Object Diagram. Both serve critical roles in the system design lifecycle, yet they operate at different levels of abstraction and time.
For students embarking on their journey in computer science or software engineering, understanding the nuance between these two is not just academic; it is practical. Confusing the blueprint with the building, or the general rule with the specific instance, can lead to design flaws that are expensive to fix later. This guide provides a comprehensive breakdown of Object Diagrams and Class Diagrams, exploring their syntax, semantics, and practical applications without the fluff.
Understanding the Class Diagram 🏗️
The Class Diagram is the backbone of object-oriented design. It represents the static structure of a system. Think of it as the architectural blueprint for a house. It shows what the house is made of, the types of rooms, and how they connect, but it does not show who is currently living in the rooms.
In UML, a class diagram is a static structure diagram. It describes the structure of the system by showing the system’s classes, their attributes, operations (methods), and the relationships among objects. It is the most widely used diagram in UML because it captures the most critical aspects of the system’s design.
Core Components of a Class Diagram
- Class Name: Usually written in bold at the top of the rectangle representing the class. This defines the identity of the blueprint.
- Attributes: These are the properties or data fields contained within the class. In a class diagram, attributes are listed with their visibility (private, protected, public) and data type.
- Operations: These represent the methods or functions the class can perform. They define the behavior associated with the data.
- Relationships: Lines connecting classes that define how they interact. Common relationships include Association, Aggregation, Composition, Generalization (Inheritance), and Realization (Interface).
Key Characteristics of Class Diagrams
When working with class diagrams, you are dealing with generalizations. They define the type of object, not the object itself. A class diagram exists independently of time. It remains valid as long as the design requirements do not change. It does not show a specific state of data. For example, a Class Diagram for a BankAccount class will define that an account has a balance and an account number, but it will not show that Account #12345 has a balance of $500.
Classes in a diagram often have multiplicities. For instance, one Customer class may be associated with one to many Order classes. This defines the contract of the relationship, not the specific instances that currently exist in the database.
Understanding the Object Diagram 🕰️
If the Class Diagram is the blueprint, the Object Diagram is the photograph. It captures a snapshot of the system at a specific moment in time. This diagram is also known as an Instance Diagram. It shows specific instances of classes (objects) and their actual values at a particular point during the execution of the system.
While a class diagram shows what could exist, an object diagram shows what does exist. This distinction is vital for debugging, testing, and understanding the runtime state of a complex application.
Core Components of an Object Diagram
- Object Name: Written in bold, usually underlined to distinguish it from a class name. It follows the naming convention:
objectName:ClassName. - Attribute Values: Unlike class diagrams where types are listed (e.g.,
balance: int), object diagrams list actual values (e.g.,balance: 500). - Links: These are the specific instances of associations. They connect one object to another, showing the actual relationship instance.
- Identity: Each object has a unique identity. Even if two objects have the same attribute values, they are distinct instances.
Key Characteristics of Object Diagrams
Object diagrams are transient. They represent a momentary state. If you run your application again, the object diagram will likely look different. They are highly specific. They do not generalize. If you have a class User and an object u1:User, the object diagram shows exactly what u1 is doing right now.
This diagram is often used to:
- Validate complex associations and multiplicities.
- Debug data flow issues by visualizing actual data states.
- Document specific test cases or scenarios.
- Provide a concrete example for developers to understand abstract class structures.
The Time Dimension: Static vs. Dynamic State ⏱️
The most profound difference between these two diagrams lies in the dimension of time. A class diagram is timeless. It describes the potential of the system. An object diagram is momentary. It describes the reality of the system at a specific timestamp.
Imagine a library system. The Class Diagram defines that a Book has a title, an author, and a status. It defines that a Librarian can borrow a Book. This structure does not change based on what happens in the library today.
The Object Diagram, however, would show bookInstance1:Book with title: "The Great Gatsby" and status: "Borrowed". It links this specific book to librarianInstance1:Librarian. This snapshot changes as soon as the book is returned. The class diagram remains the same; the object diagram changes.
Comparison Table: Object Diagram vs Class Diagram 📊
To clarify the distinctions, we can look at a structured comparison. This table highlights the technical differences that students often overlook.
| Feature | Class Diagram | Object Diagram |
|---|---|---|
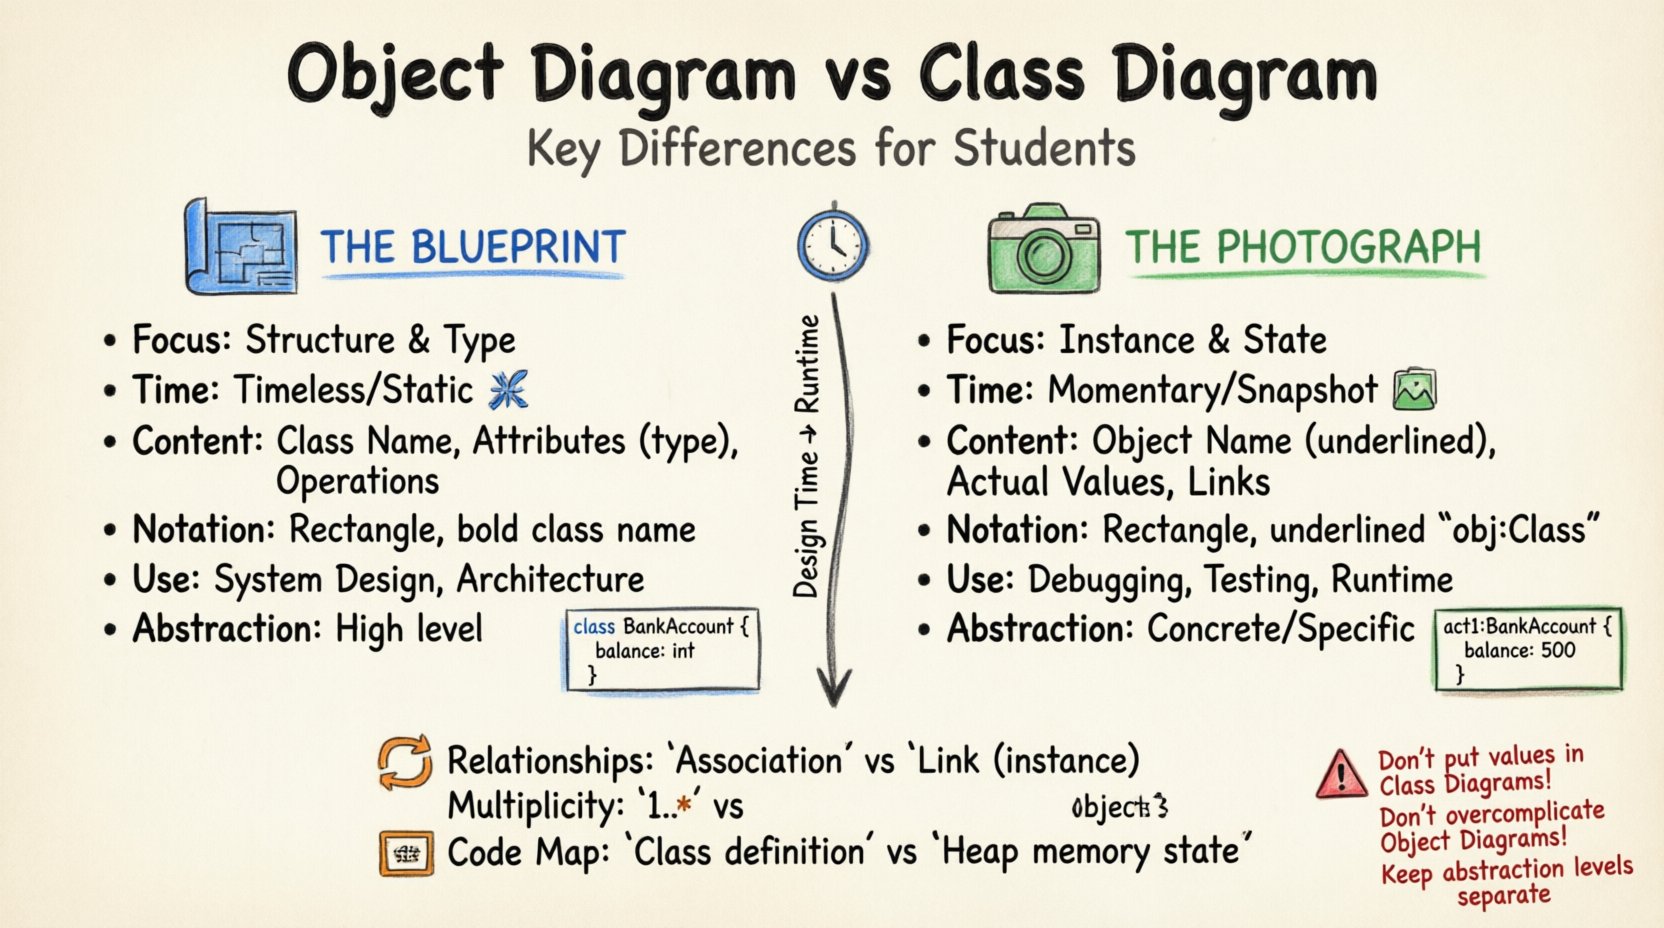
| Focus | Structure and Type | Instance and State |
| Time | Timeless (Static) | Snapshot (Momentary) |
| Content | Class Name, Attributes, Operations | Object Name, Attribute Values, Links |
| Notation | Rectangles with thick lines | Rectangles with underlined names |
| Use Case | System Design, Architecture | Debugging, Testing, Runtime Analysis |
| Stability | High (Changes rarely) | Low (Changes frequently) |
| Relationships | Associations, Inheritance | Links, Associations |
| Abstraction | High | Low (Concrete) |
Deep Dive into Relationships and Associations 🔗
Both diagrams utilize relationships to connect elements, but the interpretation of these connections differs. Understanding this distinction is crucial for accurate modeling.
Association
An association represents a structural relationship between classes. In a Class Diagram, it shows that objects of one class can be linked to objects of another. In an Object Diagram, this becomes a link. A link is a specific instance of an association.
For example, a Student class is associated with a Course class. The Class Diagram shows a line connecting them. The Object Diagram shows a specific line connecting studentA:Student to courseB:Course. This line represents the actual enrollment.
Aggregation vs. Composition
These are specialized forms of association that denote ownership and lifecycle dependencies.
- Aggregation: A “whole-part” relationship where the part can exist independently of the whole. In a Class Diagram, this is a diamond on the whole side. In an Object Diagram, the link exists, but the lifecycle of the part object is independent.
- Composition: A stronger form of aggregation where the part cannot exist without the whole. If the whole is destroyed, the parts are destroyed. In the Object Diagram, this is often visualized by the tight coupling of the specific instances.
Multiplicity
Multiplicity defines how many instances of a class participate in a relationship. In a Class Diagram, you might see 1..* (one or more). In an Object Diagram, you see the actual count. If the Class Diagram says a Department has many Employees, the Object Diagram might show the Department object linked to exactly three specific Employee objects.
When to Use Which Diagram? 🤔
Choosing the right tool for the job is part of the design process. Here are scenarios where one is preferred over the other.
Use Class Diagrams When:
- Designing the Schema: You are planning the database structure or the API data models.
- Communicating Architecture: You need to explain the system’s structure to stakeholders who care about the high-level design.
- Defining Interfaces: You need to specify methods and behaviors that will be implemented later.
- Long-term Documentation: You need a reference that remains valid across multiple versions of the software (assuming the class structure doesn’t change).
Use Object Diagrams When:
- Debugging: You need to trace how data flows through a specific execution path.
- Complex Associations: You have a many-to-many relationship with complex constraints and need to visualize a specific valid state.
- Test Cases: You are documenting a specific unit test scenario with pre-defined data states.
- Legacy Analysis: You are analyzing an existing system and want to understand the state of data at a specific point in a log or trace.
Mapping Code to Diagrams 💻
For students, bridging the gap between theoretical diagrams and actual code is a common hurdle. Understanding how these diagrams translate to programming languages like Java, C++, or Python helps solidify the concepts.
Class Diagram to Code
A class diagram maps almost directly to a source code file. The class name becomes the file name or the class declaration. Attributes become member variables. Operations become methods. The visibility modifiers (public, private) map directly to language keywords. This is why class diagrams are so popular; they are executable specifications.
Object Diagram to Code
An object diagram maps to the runtime memory state. It represents the heap. When you write code that instantiates an object (e.g., new User()), you are creating an object. The object diagram represents the collection of all these instances currently in memory. It is a view of the runtime, not the source code.
Common Mistakes Students Make ⚠️
Even with clear definitions, confusion persists. Here are common pitfalls to avoid.
- Confusing Instances with Types: Drawing a class diagram with specific values (e.g.,
name: "John") instead of types (e.g.,name: String). This turns a Class Diagram into an Object Diagram by mistake. - Ignoring Multiplicity: Failing to specify how many objects relate to each other in a Class Diagram. This leads to ambiguity in the design.
- Over-complicating Object Diagrams: Creating object diagrams for entire systems. Object diagrams are snapshots. An object diagram for a large system with thousands of objects is unreadable. They should be used for specific scenarios.
- Mixing Levels of Abstraction: Combining high-level design classes with low-level implementation details in the same diagram. Keep your diagrams focused.
- Assuming Object Diagrams are Always Necessary: They are not always required for simple systems. If the design is straightforward, the Class Diagram often suffices.
Best Practices for Documentation 📝
To ensure your diagrams are effective communication tools, follow these guidelines.
- Consistency: Use standard UML notation. Do not invent your own symbols.
- Naming Conventions: Ensure class names are capitalized (PascalCase) and object names are descriptive. Follow the
objectName:ClassNameconvention for objects. - Clarity: Avoid clutter. If a diagram has too many elements, break it down into subsystems.
- Version Control: Treat diagrams as code. Store them in your version control system. A class diagram should evolve with your codebase.
- Validation: Use object diagrams to validate class diagrams. If you cannot draw a valid object diagram for a class diagram, your class diagram might have logical errors.
The Relationship Lifecycle 🔄
There is a symbiotic relationship between these two diagrams. The Class Diagram dictates the rules for the Object Diagram. You cannot have an object diagram that violates the constraints of the class diagram. For instance, if a class diagram says an object must have a non-null ID, the object diagram cannot show an object with a null ID.
However, the Object Diagram can reveal gaps in the Class Diagram. If you find that you need to represent a specific state of data that the Class Diagram does not support, you may need to update the Class Diagram. This feedback loop is essential for iterative design.
Consider the lifecycle of a ShoppingCart system. The Class Diagram defines the cart, the items, and the user. The Object Diagram is used during the checkout process to show the cart filled with specific items, the user logged in, and the total calculated. This object state is temporary. Once the order is placed, the cart object is destroyed or archived, but the Class Diagram remains to support future carts.
Advanced Concepts: Generalization and Inheritance 🧬
Both diagrams handle inheritance (Generalization), but they treat it differently.
In a Class Diagram, inheritance is shown with a solid line and a hollow triangle. It indicates that a subclass is a specialized version of a superclass. It defines the hierarchy of types.
In an Object Diagram, inheritance is implicit. An object is an instance of a specific class. If a class Vehicle has a subclass Car, an object diagram will show myCar:Car. It does not explicitly draw the inheritance line to the superclass object, but the object myCar inherits the properties of Vehicle. The object belongs to the class hierarchy defined in the Class Diagram.
Conclusion on Modeling Strategy 🧠
Selecting between an Object Diagram and a Class Diagram is not about choosing the better option; it is about choosing the right tool for the specific phase of the project. The Class Diagram is your contract with the future system. It defines what is possible. The Object Diagram is your observation of the present system. It defines what is happening.
As a student, mastering the ability to switch between these perspectives is a mark of a skilled engineer. You must be able to think abstractly about types and structures, yet concretely about data and execution. By keeping these distinctions clear, you will produce designs that are robust, understandable, and maintainable.
Remember to practice drawing both. Sketch a simple class diagram for a library or a shop, then draw the corresponding object diagram for a specific scenario. This active engagement will cement the concepts better than passive reading. The goal is not just to draw diagrams, but to think in the language of the system you are building.