
When navigating the complex landscape of software architecture, visual representations serve as the bridge between abstract logic and concrete implementation. Among the various tools available, the object diagram stands out as a critical component for understanding the state of a system at a specific moment. Unlike other models that focus on blueprints, this diagram type captures instances, interactions, and data values in action. For those entering the field of software engineering, grasping this concept is essential for effective communication and design. 🚀
This guide provides a comprehensive look at how object diagrams function. It explores their structure, purpose, and application within the broader context of modeling languages. By the end, you will understand when to deploy them and how they differ from their more common counterparts. Let us dive into the mechanics of instance modeling.
What is an Object Diagram? 🤔
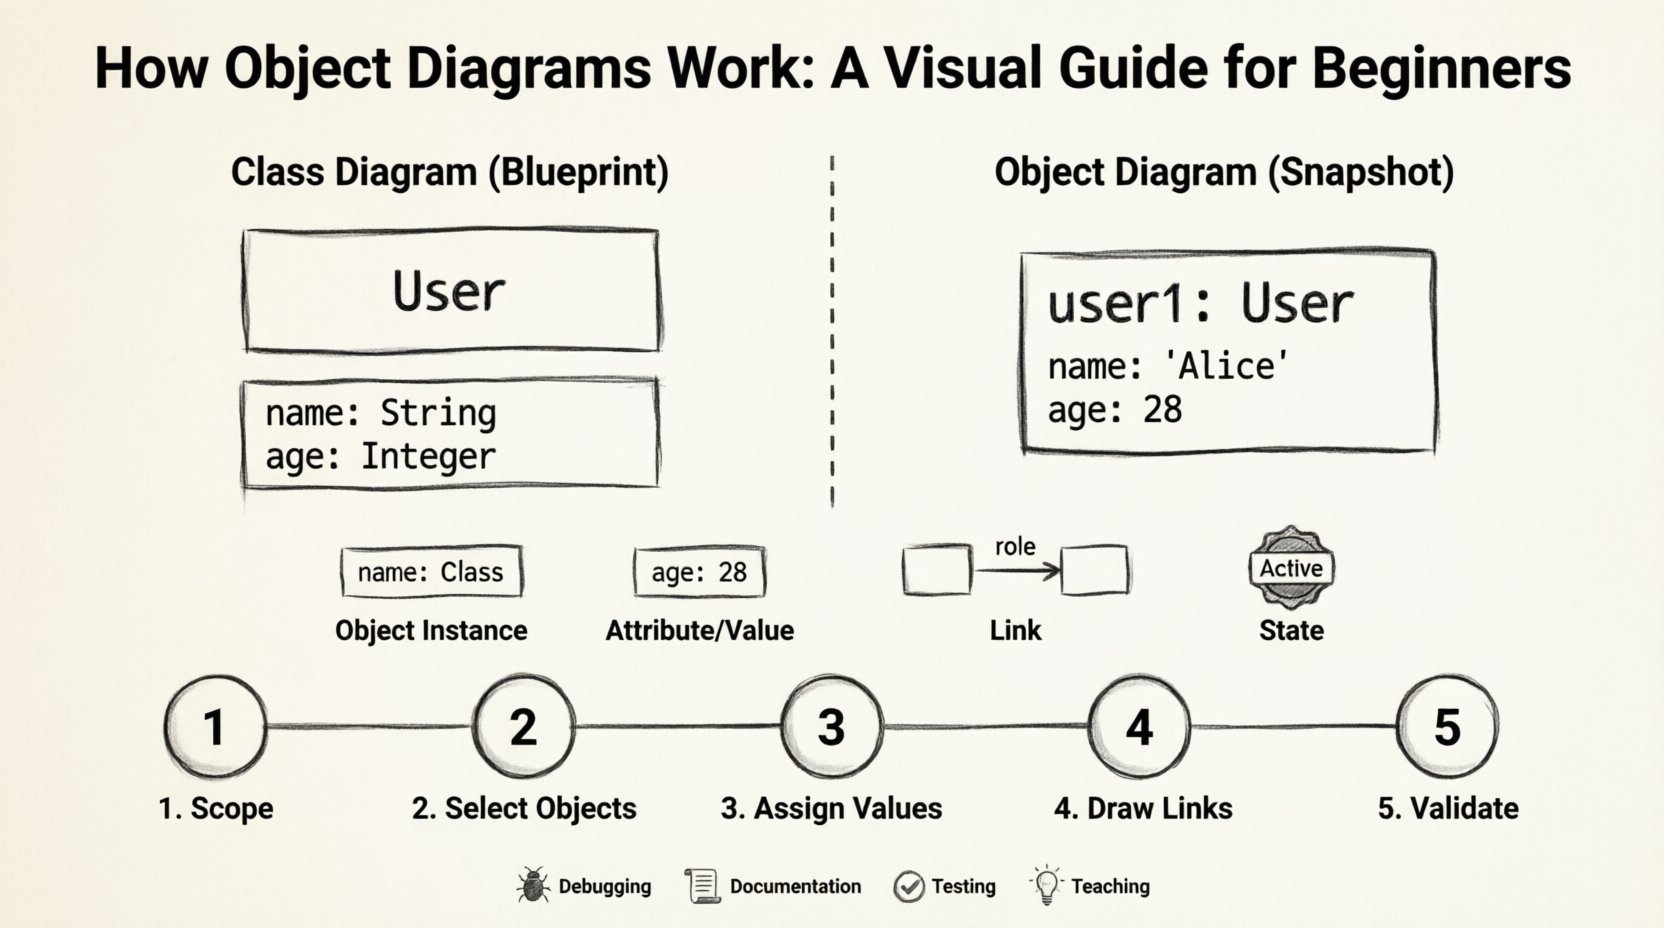
An object diagram is a static structure diagram that describes the system at a particular point in time. It is often referred to as an instance diagram. While a class diagram defines the types of objects and their general properties, an object diagram focuses on specific instances. Think of a class diagram as the blueprint for a house, showing where walls and doors go. An object diagram is a photograph of a specific house, showing which lights are on, who is in the rooms, and what furniture is placed where.
In the Unified Modeling Language (UML), object diagrams are used to:
- Visualize Data: Show the actual values held by attributes.
- Document Snapshots: Capture the state of a system during a specific test or execution.
- Clarify Relationships: Demonstrate how specific objects are linked through associations.
- Support Testing: Provide a reference for expected data structures during validation.
These diagrams are particularly useful when dealing with complex associations where multiple objects interact. They reduce ambiguity by showing concrete examples rather than theoretical possibilities. This concreteness helps developers identify potential issues with data flow before code is written.
Core Components of an Object Diagram 🧩
Understanding the building blocks is the first step toward creating effective diagrams. Every element serves a specific function in defining the system’s state. Below are the primary components you will encounter.
1. Object Instances
Objects are the central figures. Each instance represents a single entity within the system. They are typically labeled using the format name : Class. For example, user1 : User indicates a specific instance of the User class named “user1”.
- Name: The unique identifier for the instance (optional but recommended).
- Type: The class from which the instance is derived.
- Appearance: Often shown as a rectangle divided into two sections.
2. Attributes and Values
Attributes define the properties of an object. In an object diagram, these are populated with actual values rather than data types. This is a key distinction from class diagrams.
- Class Diagram: Shows
age : Integer. - Object Diagram: Shows
age : 28.
Populating these fields helps stakeholders understand the realistic data scenarios. It allows for validation of constraints and initial values.
3. Links
Links represent the connections between instances. They are the runtime equivalents of associations defined in class diagrams. A link indicates that two objects are related at a specific moment.
- Direction: Links can be unidirectional or bidirectional.
- Role Names: Labels on the link indicate the relationship from the perspective of each object.
- Multiplicity: Shows how many instances can participate in the relationship (e.g., 1..*).
4. State and Lifelines
While less common in basic static diagrams, some object diagrams include state information. This helps visualize the lifecycle of an object within the context of the snapshot. It shows if an object is active, pending, or terminated.
Class Diagram vs. Object Diagram 🆚
Confusion often arises between class diagrams and object diagrams. Both are static structure diagrams, but their focus differs significantly. One defines the template, and the other defines the content.
| Feature | Class Diagram | Object Diagram |
|---|---|---|
| Focus | General structure and types | Specific instances and data |
| Time Context | Timeless (definition) | Point in time (snapshot) |
| Attributes | Data types (e.g., String) | Actual values (e.g., “Hello”) |
| Instances | Class definitions only | Named instances (e.g., obj1 : Class) |
| Use Case | Designing the system architecture | Debugging, testing, or documentation |
| Complexity | High level overview | Low level details |
Recognizing these differences ensures you choose the right tool for the task. If you are designing the database schema, the class diagram is your primary tool. If you are debugging why a specific data value is null in production, the object diagram provides the necessary context.
How to Construct an Object Diagram 🛠️
Creating a diagram requires a logical approach. You do not simply draw shapes; you map relationships based on the system’s requirements. Follow this process to build accurate representations.
Step 1: Identify the Scope
Before drawing, determine what you are modeling. Are you looking at a specific transaction? A user session? A database state? Defining the scope prevents clutter and keeps the diagram focused.
- Define the Goal: What question does this diagram answer?
- Set Boundaries: Which objects are relevant? Exclude peripheral systems.
- Choose the Moment: When is the snapshot taken?
Step 2: Select the Objects
Based on the scope, select the instances that need to be represented. Refer to the class diagram to ensure the types are correct. Do not invent new classes here; stick to the established hierarchy.
- List the necessary instances.
- Assign unique names to distinguish them (e.g.,
order1,order2). - Ensure the types match the class definitions.
Step 3: Assign Attribute Values
Fill in the attributes with realistic data. This step transforms the diagram from a structure to a state representation.
- Use valid data types for each field.
- Ensure constraints are met (e.g., dates are in the past).
- Represent null values explicitly if they are significant to the scenario.
Step 4: Draw the Links
Connect the objects using lines that represent associations. Ensure the direction and multiplicity match the business rules.
- Draw lines between related objects.
- Label the lines with role names.
- Verify that the links correspond to the associations defined in the class diagram.
Step 5: Review and Validate
Once drawn, review the diagram against the requirements. Does it accurately reflect the scenario? Are all links valid? Is the data consistent?
Common Use Cases for Object Diagrams 📝
While they are less frequently drawn than class diagrams, object diagrams serve vital functions in specific scenarios. Knowing when to use them prevents wasted effort.
1. Debugging and Troubleshooting
When a bug occurs, developers often need to know the state of the system. An object diagram can illustrate exactly which objects were involved and what values they held when the error triggered. This visual aid is faster than tracing through logs.
2. Documentation for Stakeholders
Non-technical stakeholders may find class diagrams too abstract. Object diagrams provide concrete examples. Showing a specific order with a customer and payment method is easier to understand than showing the relationship between the Order and Customer classes.
3. Test Case Design
QA engineers use object diagrams to define the expected state before and after a test. It serves as a baseline for validation. If the actual state matches the diagram, the test passes.
4. Data Migration Planning
When moving data between systems, understanding the instance relationships is crucial. Object diagrams help map old data structures to new ones, highlighting any missing links or orphaned records.
5. Teaching and Learning
In educational settings, object diagrams help beginners grasp the concept of instantiation. Seeing multiple instances of a class helps clarify how objects relate to their definitions.
Advanced Concepts and Relationships 🔗
Beyond basic associations, object diagrams can handle more complex interactions. Understanding these nuances allows for deeper modeling.
Aggregation and Composition
These are specialized forms of association. In an object diagram, they are represented similarly to standard links but imply different lifecycle dependencies.
- Aggregation: A “whole-part” relationship where the part can exist independently. Visually, this is often shown with a hollow diamond.
- Composition: A strong “whole-part” relationship where the part cannot exist without the whole. Visually, this is often shown with a filled diamond.
While often implied in class diagrams, object diagrams make the existence of the parts explicit. If the composite object is deleted, the diagram shows the parts disappearing as well.
Recursive Associations
Sometimes an object relates to another object of the same type. A classic example is an Employee managing other Employees. An object diagram clarifies this hierarchy better than a text description.
manager : Employeesubordinate : Employee- Link connects
managertosubordinate.
Generalization
While less common, inheritance can be shown. An object instance might be typed as a subclass, showing it inherits properties from a superclass. This is useful for demonstrating polymorphism in action.
Best Practices for Clear Modeling 🌟
To ensure your diagrams remain readable and useful, adhere to these guidelines. Clarity is the primary goal of any visual model.
- Limit Scope: Do not try to model the entire system in one diagram. Break it down into logical subsystems or scenarios.
- Consistent Naming: Use clear, descriptive names for instances. Avoid generic names like
obj1unless no better option exists. - Keep it Static: Remember, this is a snapshot. Do not mix state changes or dynamic flows unless explicitly indicating a sequence of snapshots.
- Label Links: Always label associations to indicate the direction and role of the relationship.
- Use White Space: Avoid clutter. Let the connections breathe so the structure is visible.
- Align with Class Diagram: Ensure your instances match the classes defined elsewhere. Inconsistencies here cause confusion.
- Color Coding: If your tool allows, use colors to denote status (e.g., active, inactive, error) without adding CSS styles that break the semantic structure.
Common Pitfalls to Avoid 🚫
Mistakes in modeling can lead to misunderstandings in development. Be aware of these common errors.
- Overloading: Trying to show every possible state in one diagram. This creates a spaghetti mess that is impossible to read.
- Missing Links: Forgetting to draw the connections between objects, leaving the data isolated.
- Incorrect Types: Assigning an attribute a value that does not match its type (e.g., a string in an integer field).
- Ignoring Multiplicity: Showing a one-to-one relationship when the design allows for many-to-many.
- Dynamic Elements: Including time-based flows that belong in sequence diagrams, not object diagrams.
The Role in the Modeling Ecosystem 🌐
Object diagrams do not exist in isolation. They complement other UML diagrams to provide a complete picture of the software.
Relationship with Class Diagrams
As mentioned, the class diagram is the template. The object diagram is the content. You cannot have a valid object diagram without the definitions provided by the class diagram.
Relationship with Sequence Diagrams
Sequence diagrams show the flow of messages over time. Object diagrams can serve as the “state before” or “state after” for a sequence diagram. They provide the context for the interactions shown in the sequence.
Relationship with State Machine Diagrams
State diagrams show how an object changes state. Object diagrams can represent the specific state of that object at a given point, validating the transitions defined in the state machine.
Future Considerations and Trends 📈
As software development evolves, the role of static modeling diagrams shifts. With the rise of code generation and automated testing, the need for explicit diagrams may change.
- Code-First Approaches: Some teams prefer writing code and inferring diagrams from it. Object diagrams still serve as documentation for non-code artifacts.
- Automated Generation: Tools are emerging that can generate object diagrams from running applications. This provides real-time snapshots for monitoring.
- Integration with Databases: Object diagrams are increasingly used to visualize database schemas and actual data rows during migration projects.
Even with automation, the human ability to visualize complex relationships remains valuable. An object diagram condenses pages of logs into a single view. This cognitive shortcut is a skill that developers should cultivate.
Summary of Key Takeaways ✅
To wrap up this exploration, here are the essential points to remember regarding object diagrams.
- Definition: They are static diagrams showing instances and their values at a specific time.
- Structure: They consist of objects, attributes with values, and links between instances.
- Utility: They are best used for debugging, documentation, and testing scenarios.
- Comparison: They differ from class diagrams by showing data values rather than data types.
- Process: Build them by defining scope, selecting objects, assigning values, and drawing links.
- Best Practices: Keep them simple, consistent, and aligned with class definitions.
Mastering the use of object diagrams adds a layer of precision to your software engineering toolkit. It allows you to communicate complex data states clearly and effectively. By understanding the distinction between the blueprint and the building, you can create more robust and maintainable systems. 🏗️
Start by incorporating small object diagrams into your design process. Use them to document critical scenarios. Over time, they will become a natural part of your workflow. This practice leads to better code, fewer bugs, and clearer communication among team members.