


When you design a complex system, you often start with the structure of the code or the database. You think about classes, tables, and schemas. But there is a specific moment in the lifecycle of a design where you need to see a snapshot of reality. This is where an object diagram becomes essential. It is not just another chart; it is a static snapshot of your system at a specific moment in time. It shows you exactly how data flows between instances.
Many people find this concept confusing because it feels similar to a class diagram. However, the difference is distinct and critical for accurate documentation. This guide will walk you through the process of creating one, focusing on clarity, accuracy, and utility. We will avoid jargon where possible, but we will use the correct terminology to ensure you communicate effectively with your team. 🛠️
What Exactly Is an Object Diagram? 🤔
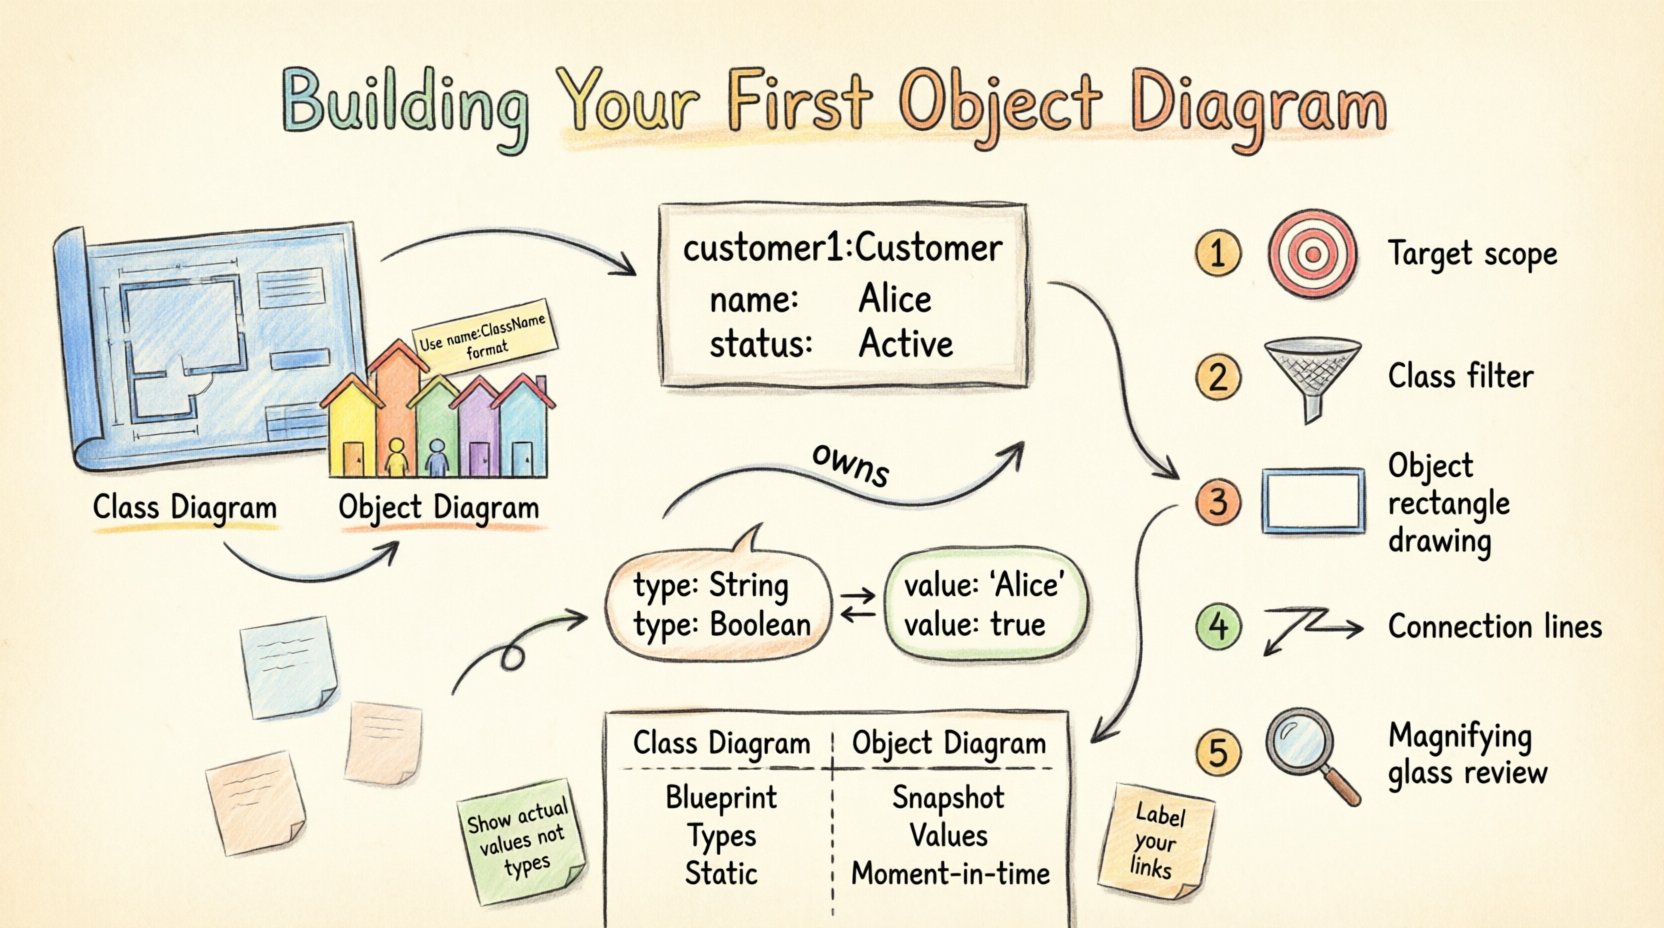
An object diagram represents a snapshot of instances of classes in your system. While a class diagram defines the blueprint (the type), an object diagram shows the actual buildings constructed from that blueprint (the instances). Think of it like a photograph of a neighborhood. A class diagram is the architectural plan showing that all houses have three bedrooms. An object diagram shows that House A has a blue door, while House B has a red door, and who lives in each house at this specific moment.
Why is this useful? It helps you understand the state of a system during execution. It is particularly valuable when:
- Visualizing Data Relationships: You need to see how specific data points link together.
- Debugging Complex Logic: When an algorithm fails, tracing the object links helps find the root cause.
- Communicating with Stakeholders: It is often easier for non-technical users to understand a concrete example than an abstract blueprint.
- Documenting Design Patterns: It shows how patterns like Singleton or Factory behave in practice.
By focusing on the static structure of instances, you gain a clearer picture of memory usage, data integrity, and flow. It is a tool for precision, not just decoration. 🎯
Core Components You Need to Know 🔍
Before drawing anything, you must understand the building blocks. Every object diagram relies on a few fundamental elements. If you miss one, the diagram loses its meaning.
1. Object Instances
An object is an instance of a class. In the diagram, it is represented by a rectangle. The top part of the rectangle contains the object name. The bottom part lists the current state of the object (its attributes and values).
- Name: Usually written in bold and underlined. It often includes the class name and a unique identifier, like user:User or order:Order#1024.
- State: This shows the actual data stored. For example, if the class is
User, the state might showname: "Alice"andstatus: "Active".
2. Links (Relationships)
Links connect object instances. They represent the relationships defined in the class diagram, but applied to specific data. A link is a line connecting two object rectangles.
- Direction: Lines can have arrows showing the direction of navigation or dependency.
- Multiplicity: This indicates how many objects can be connected. For example, a 1-to-many relationship means one order can have many items.
- Label: You often label the line to explain the nature of the connection, such as
ownsormanages.
3. Attributes and Values
Unlike a class diagram that lists attribute types (e.g., String), an object diagram lists the actual values. This is the key differentiator. It tells you exactly what is in memory.
Step-by-Step Guide to Creation 🚀
Creating a diagram requires a methodical approach. Rushing leads to errors and confusion. Follow this workflow to ensure your diagram is accurate and useful.
Step 1: Define the Scope and Context
Before drawing a single shape, decide what moment you are capturing. Are you documenting the moment a user logs in? The moment a transaction completes? The scope determines which objects are relevant.
- Identify the Trigger: What event caused this state? (e.g., “User clicked Checkout”).
- Set Boundaries: Do not include every object in the system. Only include those involved in the specific scenario.
- Define the Goal: Are you showing data flow, or just structure? This changes how you draw the links.
Step 2: Identify the Key Classes
Look at your class diagram. Which classes are active in your scenario? Pick the top three to five that are central to the interaction. You do not need to draw every class in existence.
- Focus on Interaction: If you are modeling a shopping cart, focus on
Cart,Item,Customer, andPayment. - Exclude Background: Ignore classes that are not directly touched, such as
SystemLogsorConfiguration.
Step 3: Create the Objects
Now, draw the rectangles. Give each object a unique name. Use the format name:ClassName. This helps distinguish between multiple instances of the same class.
- Example: customer1:Customer, cart1:ShoppingCart.
- Add State: Inside the rectangle, list the attributes. Write the actual values. If a date is involved, use a specific format (e.g.,
date: "2023-10-01").
Step 4: Draw the Links
Connect the objects based on your class diagram relationships. Use lines to show the associations. Ensure the multiplicity is respected.
- Check Multiplicity: If the class diagram says one customer has many orders, ensure your object diagram reflects that you can draw multiple order objects linked to one customer object.
- Label Links: Add text to the line describing the relationship (e.g.,
has,contains). - Direction: Use arrows if the relationship is navigable in one direction only.
Step 5: Review and Refine
Step back and look at the diagram. Does it tell a story? Can someone else read it without asking you questions? If the labels are vague, change them. If the state is inconsistent, update it.
- Consistency Check: Do the values match the data types defined in the class diagram?
- Completeness: Are all necessary links present? Did you miss a foreign key relationship?
- Clarity: Is the layout clean? Avoid crossing lines where possible.
Object Diagram vs. Class Diagram: Clear Differences 📊
Confusion often arises between these two diagram types. They are related but serve different purposes. Understanding the distinction is vital for proper documentation.
| Feature | Class Diagram | Object Diagram |
|---|---|---|
| Focus | Structure and Blueprint | Snapshot and Instance |
| Content | Class definitions, methods, types | Object names, attribute values |
| Lifespan | Static (defines the code) | Dynamic (defines a moment in time) |
| Usage | Development and Architecture | Testing, Debugging, Documentation |
| Example | class User { name: String } |
u1:User { name: "Bob" } |
Use the class diagram when you are designing the system. Use the object diagram when you need to explain how the system behaves in a specific case. They complement each other but should not be used interchangeably. 🔄
Best Practices for Effective Diagrams 🏆
To ensure your diagrams are professional and helpful, adhere to these standards. These practices save time in the long run by reducing ambiguity.
1. Naming Conventions
Consistency is key. If you name an object user1 in one diagram, do not call it user_a in another. Stick to a pattern.
- Prefix: Use a lowercase name followed by the class name (e.g.,
order1:Order). - Uniqueness: Ensure every object name is unique within the diagram to avoid confusion.
- Clarity: Avoid generic names like
obj1. Use descriptive names if possible.
2. Managing Complexity
As systems grow, diagrams can become cluttered. Don’t try to draw the entire database in one image.
- Modularize: Break a large system into smaller object diagrams based on feature areas.
- Focus: Highlight the objects relevant to the current discussion. Ignore the rest.
- Legend: If you use specific symbols or colors, provide a key.
3. State Accuracy
The values inside the object rectangles must be realistic. If you show a user status as "Active", ensure that state is logically possible for that user at that time.
- Realism: Use data that mimics production scenarios.
- Null Handling: If an attribute is null, explicitly show it as
nullor~. Do not leave it blank. - Constraints: Ensure values adhere to the constraints defined in the class (e.g., age must be > 18).
4. Link Multiplicity
Ensure the number of links matches the rules defined in your design. If a relationship is 1:1, do not draw multiple lines connecting the same two objects.
- Verify Rules: Check your class diagram constraints.
- Visual Cues: Use arrows to indicate directionality clearly.
- Avoid Overlap: Do not let lines cross unnecessarily.
Common Pitfalls to Avoid ⚠️
Even experienced designers make mistakes. Being aware of common errors helps you produce higher quality diagrams.
1. Confusing Type with Instance
One of the most common errors is listing class names in the object box instead of instance names. Remember, the box represents an instance.
- Wrong:
Rectangleinside the box. - Right: rect1:Rectangle inside the box.
2. Ignoring Lifecycle States
Objects change state. A user goes from Registered to Verified. If your diagram shows an old state, it misleads the reader.
- Update Regularly: Treat diagrams as living documents that need updates when logic changes.
- Version Control: If possible, version your diagrams to track changes over time.
3. Over-Engineering
Do not add every single attribute to every object. If an attribute is not relevant to the scenario, omit it.
- Simplicity: Less is more. Show only what is needed to understand the interaction.
- Focus: If you are showing payment flow, do not detail the user’s address unless it is relevant to the payment method.
4. Missing Links
It is easy to forget a relationship. This breaks the logical flow of the diagram.
- Double Check: Compare your object diagram against the class diagram to ensure all relationships are represented.
- Traceability: Follow the path from one object to another to ensure connectivity.
Advanced Use Cases 🧩
Beyond basic documentation, object diagrams can serve specific technical functions in your workflow.
1. Debugging Memory Leaks
When memory usage spikes, an object diagram can help visualize which objects are holding references that prevent garbage collection. By mapping the links, you can identify circular references or unexpected long-lived objects.
2. Explaining Design Patterns
Patterns like the Observer or Strategy pattern can be hard to explain with code alone. An object diagram shows the specific connections between the Subject and Observers, or the Context and Strategies, making the behavior concrete.
3. Data Migration Planning
When moving data between systems, you need to know how records relate. An object diagram of the source data helps map it to the target structure, ensuring no relationships are lost during the transfer.
4. API Contract Validation
When defining an API, the response structure can be modeled as an object diagram. This validates that the JSON response matches the expected state of the objects in the system.
Tools and Workflow Considerations 🛠️
You do not need expensive software to create these diagrams. The focus is on the logic, not the tool. However, having a consistent workflow helps.
- Whiteboard First: Sketch ideas on paper or a whiteboard to get the layout right before digitizing.
- Text-Based Tools: Some teams prefer using text descriptions to generate diagrams automatically. This keeps the documentation in the code repository.
- Manual Drawing: Simple drawing tools are sufficient. The value comes from the content, not the graphics.
Ensure that whoever creates the diagram has access to the latest class definitions. An outdated diagram is worse than no diagram at all.
Integrating with Documentation 📝
A diagram standing alone is often insufficient. It needs context. Place the diagram within a broader documentation structure.
- Contextual Text: Always write a paragraph before the diagram explaining what it shows.
- Scenario Description: Describe the event that triggered this state.
- Reference Links: Link back to the class diagram and the specific code modules involved.
- Version Notes: Note the date and the version of the system this diagram represents.
This integration ensures that future maintainers understand not just the structure, but the story behind it.
Final Thoughts on Static Structure 🎨
Creating an object diagram is an exercise in clarity. It forces you to stop thinking about abstract types and start thinking about concrete data. It bridges the gap between design and execution. By following the steps outlined here, you can produce diagrams that are not only accurate but also valuable assets for your team.
Remember, the goal is communication. If your diagram helps a colleague understand the system faster, you have succeeded. Keep it simple, keep it accurate, and keep it updated. With practice, these diagrams will become a natural part of your design process. They provide a window into the system’s state that code alone cannot offer. Embrace the static snapshot as a powerful tool in your technical arsenal. 🚀