


An object diagram serves as a static snapshot of a system at a specific moment in time. While class diagrams define the blueprint, object diagrams reveal the actual arrangement of data and relationships during execution. Understanding the anatomy of these diagrams is essential for architects and developers who need to validate structure against runtime behavior. This guide dissects every visual element to clarify its function and significance within the broader modeling framework.
Understanding the Core Concept 🧠
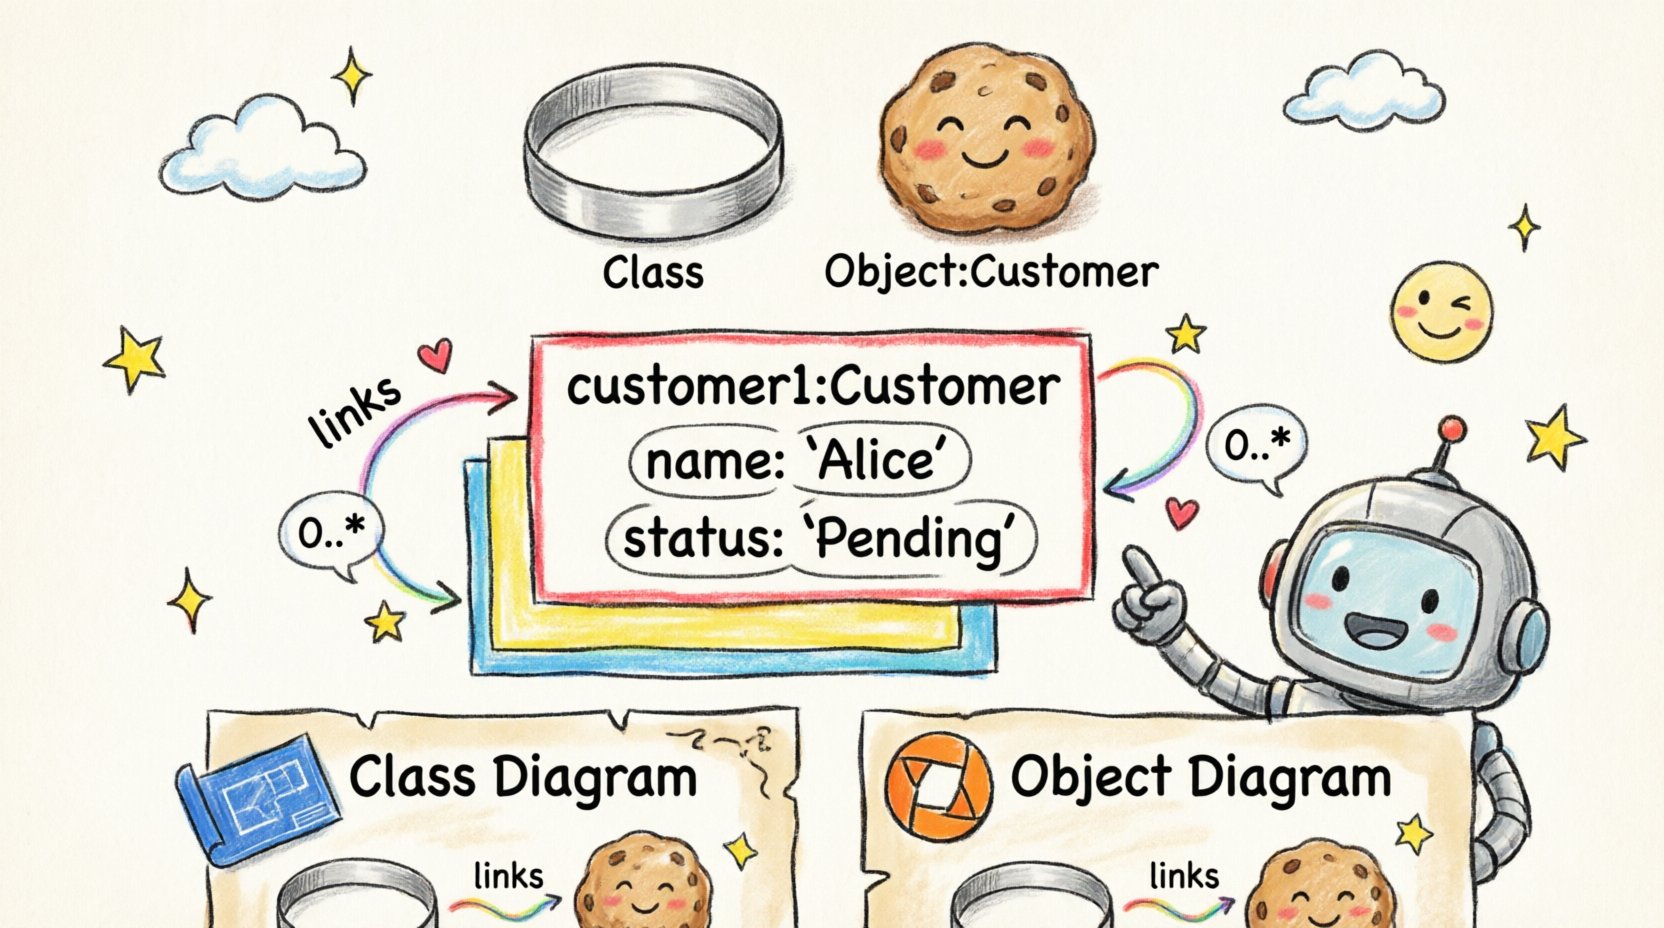
Before analyzing individual parts, it is necessary to establish what constitutes an object diagram. Unlike a class diagram which describes types, an object diagram describes instances. Think of a class as a cookie cutter and the object as the actual cookie produced. The diagram captures the state of these cookies at a precise point, showing which attributes hold specific values and how they connect to one another.
Why is this distinction critical? Because code executes based on instances, not abstract types. When debugging a memory leak or tracing a complex transaction, the class diagram shows you the potential, but the object diagram shows you the reality. This level of detail helps identify structural anomalies that theoretical models might miss.
The Anatomy of an Object Diagram 🏗️
An object diagram is composed of several distinct components. Each part carries specific semantic weight. Ignoring the nuance of any single element can lead to misinterpretation of the system’s state. The following sections break down the primary building blocks.
1. Objects (Instances) 🖼️
The most prominent feature is the object itself. In notation, an object appears as a rectangle divided into sections. Unlike a class, which is named generically (e.g., Customer), an object is named specifically (e.g., customer:Customer or c1:Customer).
- Instance Name: The text before the colon identifies the specific instance. This might be a variable name used in code or a unique identifier.
- Type Name: The text after the colon identifies the class to which this object belongs. This links the instance back to the structural definition.
When reviewing a diagram, the instance name provides context for debugging. If you see order:Order, you know you are looking at a specific order record. If you see o1:Order, you are looking at a generic instance used for illustrative purposes. Both are valid, but they serve different documentation needs.
2. Attributes and Values 📝
Below the object name, within the same rectangle, you will often find a list of attributes. In a class diagram, this section lists property names and types. In an object diagram, this section lists property names and current values.
This distinction is vital for understanding system state. For example:
- Class Diagram: status: String
- Object Diagram: status: “Pending”
By seeing the value “Pending”, a developer can immediately understand the workflow stage without executing code. This is particularly useful for documenting specific scenarios, such as error states or successful transactions. It bridges the gap between design and execution.
3. Links and Associations 🔗
Objects do not exist in isolation. They connect to other objects through links. These links represent the runtime realization of associations defined in the class diagram.
- Line Type: Typically a solid line connecting two objects.
- Role Names: Labels placed near the object ends of the line indicate how the object participates in the relationship.
- Direction: While associations are often bidirectional, some relationships imply a specific directionality in how data flows or ownership is held.
When tracing a link, ask yourself: What does this connection signify? Is it a composition where one object owns the other? Is it an aggregation where they are independent? The object diagram makes these dependencies visible in a concrete way.
4. Multiplicity Constraints 🔢
Multiplicity defines the cardinality of relationships. In an object diagram, this is often implicit because the diagram shows a single instance of the relationship, but the class definition dictates the rules.
However, when multiple links exist between objects, multiplicity helps validate the diagram against the rules. For example, if a class definition states a Customer can have zero or more Orders, the object diagram should reflect this. If you see a customer connected to three orders, that aligns with a 0..* multiplicity. If you see a single order connected to five customers where the rule allows only one, the diagram reveals a potential logic error.
Visual Elements Explained 🖍️
Visual consistency ensures that anyone reading the diagram understands the data without confusion. Standard notation dictates specific formatting rules.
- The Rectangle Box: Represents the object boundary. It is usually rectangular with a horizontal separator line.
- The Separator Line: Divides the instance name from the attributes. It ensures clarity between the identity of the object and its data.
- Text Styling: Instance names are often bolded or italicized to distinguish them from class names. Attribute values are often enclosed in quotes to denote string literals.
Object Diagram vs. Class Diagram 🆚
Confusion often arises between these two diagram types. While they share structural similarities, their purposes diverge significantly. The table below clarifies the distinctions.
| Feature | Class Diagram | Object Diagram |
|---|---|---|
| Focus | Static structure and types | Runtime instances and values |
| Time Context | Timeless (Blueprint) | Snapshot (Specific Moment) |
| Attribute Content | Property Names and Types | Property Names and Values |
| Usage | Design and Architecture | Debugging and Validation |
| Scope | Generalized | Specific |
Understanding this comparison prevents the misuse of diagrams. Using an object diagram to define the overall system architecture can lead to clutter, as it is too specific. Conversely, using a class diagram to debug a specific runtime error lacks the necessary detail.
Why Specific Components Matter 📉
Each component in an object diagram serves a functional purpose beyond mere representation. They provide evidence for architectural decisions and help in communication.
State Representation
The inclusion of values allows for state analysis. In complex systems, the state of an object determines its behavior. By documenting the state in the diagram, you create a reference for expected behavior. If the diagram shows a status of “Closed” but the code logic expects “Open”, the discrepancy is immediately visible.
Relationship Validation
Links validate the integrity of data relationships. In many systems, circular dependencies or orphaned records cause crashes. An object diagram can visualize these connections. If object A points to B, and B points back to A, the diagram highlights a circular reference that might require garbage collection handling or specific memory management strategies.
Runtime Logic Support
Developers often use these diagrams to trace execution paths. When a function is called, it manipulates objects. Seeing the objects and their links helps map the function’s impact on the system. It answers questions like: Which objects are modified? Which new objects are created? Which connections are severed?
Constructing Effective Diagrams 🛠️
Creating a clear object diagram requires discipline. Without standards, diagrams become unreadable noise. The following guidelines ensure clarity.
- Naming Conventions: Use consistent naming for instances. If customer is used, do not switch to client in the next section. Consistency reduces cognitive load.
- Link Directionality: Clearly label the ends of links with role names. This clarifies who is initiating the relationship and who is responding.
- Attribute Visibility: Only include attributes relevant to the scenario. Including every possible property clutters the view and hides important data.
- Scope Limitation: Do not attempt to draw the entire system state in one diagram. Break down complex interactions into logical groups or subsystems.
Common Pitfalls to Avoid ⚠️
Even experienced modelers make mistakes. Recognizing common errors helps maintain diagram quality.
- Overcrowding: Trying to fit too many objects into one view makes the diagram unreadable. Use multiple diagrams for different scenarios.
- Inconsistent Notation: Mixing different styles for attributes or links confuses the reader. Stick to a standard notation throughout the documentation.
- Missing Context: An object diagram without a reference to the class diagram can be ambiguous. Always ensure the types are defined elsewhere.
- Ignoring Multiplicity: Creating links that violate the defined multiplicity rules suggests a flaw in the design or the model.
Integration with System Architecture 🔗
Object diagrams do not exist in a vacuum. They interact with other modeling artifacts to provide a complete picture of the system.
Interaction with Sequence Diagrams
Sequence diagrams show the flow of messages over time. Object diagrams show the participants in that flow. When combined, they offer a powerful view of system dynamics. The sequence diagram shows how objects interact, while the object diagram shows what objects exist during that interaction.
Dependency Mapping
Understanding dependencies is crucial for maintenance. Object diagrams can highlight which objects are heavily interconnected. If one object is central to many links, it represents a potential single point of failure. Identifying these nodes early allows for better redundancy planning.
Reading and Interpreting the Data 📖
When reviewing an object diagram, follow a systematic approach to extract maximum value.
- Identify the Root: Find the entry point of the scenario. This is usually the first object created or the primary trigger.
- Trace the Links: Follow the lines from the root to see what data is accessed. This reveals the data dependencies.
- Check the Values: Look at the attribute values to understand the state. Are they null? Are they at expected limits?
- Validate Constraints: Ensure the links adhere to the multiplicity rules defined in the class structure.
- Assess Completeness: Check if all necessary objects for the scenario are present. Are there missing connections?
Conclusion on Structural Clarity 📝
The object diagram is a specialized tool designed to illuminate the concrete reality of a software system. It moves beyond abstract types to show the actual data structures in use. By understanding the components—objects, attributes, links, and values—stakeholders can validate designs against runtime requirements.
Properly constructed, these diagrams reduce ambiguity in documentation and aid in troubleshooting complex issues. They serve as a bridge between the theoretical design and the practical implementation. When used correctly, they provide clarity without clutter, ensuring that the system’s state is understood by everyone involved in the project lifecycle.
Focus on precision when creating them. Ensure every link has a purpose and every value reflects the intended state. This attention to detail pays dividends during the development and maintenance phases of any project.