


Understanding the structure of complex systems requires more than just understanding how things behave. It requires knowing how things exist at a specific moment. In the world of software architecture and modeling, this distinction is crucial. One of the most misunderstood tools in the Unified Modeling Language (UML) suite is the Object Diagram. Many beginners approach it with confusion, fearing it is overly complex or redundant. This guide aims to clear the air.
Whether you are designing a database schema, planning a distributed system, or simply trying to document a legacy codebase, grasping the true nature of object diagrams can save hours of miscommunication. We will dive deep into what these diagrams actually represent, dispel common misconceptions, and provide a practical framework for their use. No fluff, no hype, just clear technical facts.
What Exactly Is an Object Diagram? 🧩
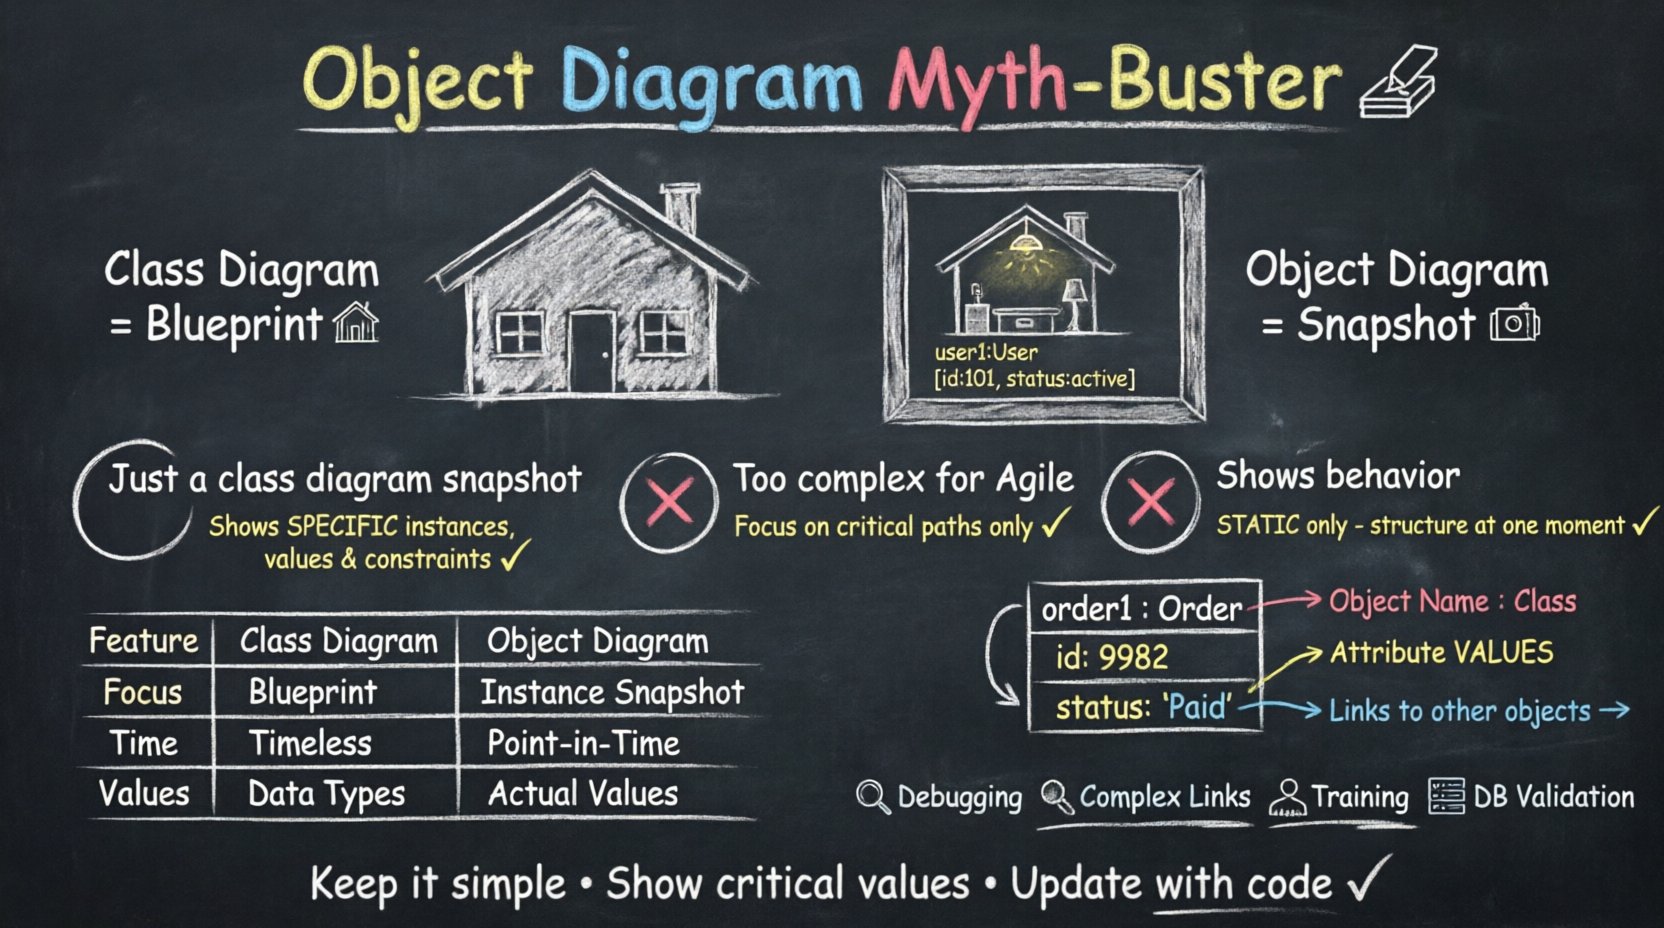
An Object Diagram is a type of static structure diagram in UML. It represents a snapshot of the system at a specific point in time. While Class Diagrams describe the blueprint or the template of the system, Object Diagrams describe the actual instances running within that blueprint.
Think of it this way:
- Class Diagram: The architectural plans for a house. It shows where the doors and windows go, the materials used, and the general layout.
- Object Diagram: A photograph of the house while someone is living in it. It shows the specific furniture placed in the rooms, the lights turned on, and the specific state of the house right now.
In technical terms, an object diagram consists of:
- Objects: Instances of classes. They are labeled with the object name followed by a colon and the class name (e.g.,
user1 : User). - Links: Associations between objects. These represent relationships that exist between specific instances.
- Attributes: The specific values held by an object at that moment (e.g.,
user1 : User [id: 101, status: active]).
These diagrams are essential for visualizing complex object structures, such as composite patterns or deep nesting, where a class diagram might become too abstract to be useful.
Myth 1: It Is Just a Snapshot of a Class Diagram 📸
The most persistent myth surrounding object diagrams is that they are merely a static view of a class diagram. While they share structural elements, this belief oversimplifies their utility and purpose.
It is true that every object in an object diagram must belong to a class defined elsewhere. However, the relationship is not one of simple reduction. Here is why this myth is misleading:
- Specificity: A class diagram defines potential relationships. An object diagram defines actual relationships. A class diagram might show a ‘Many-to-One’ association. An object diagram might show three specific users all linked to a single, specific ‘Admin’ instance.
- State Visibility: Class diagrams rarely show attribute values. Object diagrams often do. Seeing
accountBalance: 500.00is critical when debugging financial logic, but irrelevant when designing the generic ‘Account’ class. - Constraint Checking: Object diagrams help validate multiplicity constraints. If a class diagram allows zero or one parent, but the object diagram shows two parent objects linked to a child, the model is invalid. The object diagram exposes these logical errors immediately.
Consequently, treating them as identical tools leads to incomplete documentation. You lose the granularity required for runtime analysis.
Myth 2: They Are Too Complex for Agile or Rapid Development ⏱️
Another common misconception is that creating object diagrams takes too much time, making them unsuitable for agile methodologies or rapid prototyping. Critics argue that drawing instances for every variable is a waste of effort.
While it is true that exhaustive object diagrams for massive systems can be time-consuming, this view ignores the strategic application of the tool. You do not need to diagram every object in the system.
- Focus on Critical Paths: Only diagram the critical data structures involved in a specific feature or bug report. If a payment processing error occurs, diagram the objects involved in that transaction flow.
- Communication Tool: In team meetings, a quick sketch of object instances can clarify requirements faster than a page of text. It aligns the team on data flow without requiring a full design document.
- Iterative Refinement: Start with a high-level object diagram to define the scope, then refine it as the system evolves. It does not need to be perfect on the first draft.
The goal is clarity, not completeness. If the diagram helps the team understand the data state, it is worth the time spent creating it.
Myth 3: Object Diagrams Show Behavior 🎭
Some beginners confuse object diagrams with sequence diagrams or state machine diagrams. They believe that because objects are involved, the diagram must show how they act or change over time.
This is factually incorrect. Object diagrams are strictly static. They do not show:
- The order of method calls.
- The flow of data over time.
- State transitions (e.g., from ‘Pending’ to ‘Shipped’).
They only show the structural connections and the state of attributes at a single moment. If you need to show behavior, you must use a different diagram type. Mixing these concerns confuses the reader.
However, object diagrams are often used as a reference point for behavioral diagrams. They provide the context: ‘Here are the objects involved.’ Then, a sequence diagram explains: ‘Here is what they do.’ Keeping these distinct maintains model integrity.
Anatomy of a Proper Object Diagram 🛠️
To create effective diagrams, you must adhere to specific syntactic rules. Deviating from these standards creates ambiguity. Here are the core components you need to master.
1. Object Identification
Each object box must contain two lines:
- Top Line: The object name (optional, but recommended for uniqueness).
- Bottom Line: The class name it inherits from.
Example:
+---------------------+
| order1 : Order        |
+---------------------+
| id: 9982            |
| status: 'Paid'      |
+---------------------+
If the object name is omitted, it is often treated as an anonymous instance, which can make tracing relationships difficult.
2. Linking Objects
Links represent associations. Unlike class associations which are general, object links are specific.
- Direction: Links can be unidirectional or bidirectional.
- Labels: You can label the link to describe the relationship (e.g., ‘owns’, ‘manages’).
- Multiplicity: The end of the link may show multiplicity constraints (e.g., ‘1’, ‘0..*’, ‘1..1’).
3. Attribute Values
Attributes are displayed in the body of the object box. Unlike classes, where attributes define the type (e.g., price: float), objects show the value (e.g., price: 29.99).
Listing values is not mandatory, but it is highly recommended when the diagram is used for debugging or testing scenarios. It proves that the instance conforms to the expected state.
Object Diagram vs. Class Diagram: A Side-by-Side Comparison 📊
To further clarify the distinction, we can compare the two side-by-side. This table highlights the functional differences.
| Feature | Class Diagram | Object Diagram |
|---|---|---|
| Focus | Template / Blueprint | Instance / Snapshot |
| Time Context | Timeless (Structure) | Point in Time (Runtime) |
| Attributes | Shows Data Types | Shows Actual Values |
| Names | Class Names (e.g., User) |
Object Names + Class (e.g., u1 : User) |
| Usage | System Design, Schema Gen | Testing, Debugging, Documentation |
Notice how the Class Diagram is the foundation upon which the Object Diagram is built. You cannot have an object without a class, but you can have a class without an object diagram ever being created.
When Should You Use Object Diagrams? 🎯
Not every project needs an object diagram. Over-modeling leads to maintenance nightmares. You should consider adding them when:
- Complex Associations Exist: When a system has many-to-many relationships that are difficult to visualize in a class diagram, an object diagram can clarify the specific linkages.
- Debugging Production Issues: When a bug occurs, creating an object diagram of the state at the time of the crash helps developers understand the data flow.
- Serialization/Deserialization: When working with data formats like JSON or XML, object diagrams help map the runtime structure to the source code structure.
- Training New Hires: New team members often struggle with abstract class hierarchies. Showing them a concrete example of how data is connected helps them onboard faster.
- Database Schema Validation: Before implementing a database, an object diagram can verify that the proposed relationships support the required data integrity.
Common Pitfalls to Avoid ⚠️
Even experienced modelers make mistakes. Here are the most frequent errors to watch out for.
1. Mixing States and Structures
Do not try to show the entire lifecycle of an object in one diagram. If you show an object changing from ‘New’ to ‘Sold’, you are blurring the line between static and dynamic modeling. Keep it static.
2. Ignoring Null References
In many systems, links can be null. An object diagram should ideally show when a link is absent. If an object ‘A’ is supposed to link to ‘B’ but hasn’t yet, omitting the link is acceptable, but documenting the optional nature of the link is better.
3. Over-Labeling
Adding too many attribute values creates clutter. If the system has an object with 50 attributes, do not list them all in the diagram. List the critical ones relevant to the current context. Use ellipses (…) if necessary to indicate omitted data.
4. Forgetting Inheritance
Objects inherit structure from classes. If you have a subclass ‘PremiumUser’ extending ‘User’, the object diagram must reflect this hierarchy. The object box should indicate the specific subclass it belongs to, not just the parent class.
Integration with Other Diagrams 🔗
Object diagrams do not exist in isolation. They work best when integrated with other UML artifacts.
- With Class Diagrams: Use the class diagram to define the rules, and the object diagram to validate them against real data scenarios.
- With Sequence Diagrams: Sequence diagrams show the flow of messages. Object diagrams provide the static view of the participants receiving those messages. Referencing the object diagram in the sequence diagram header helps identify the exact instances being called.
- With State Diagrams: State diagrams show transitions. Object diagrams show the data state associated with each state. Combining them provides a complete picture of system behavior.
This interconnected approach ensures that the documentation is consistent. If you change a class, you must update the object diagram. If you change an object instance logic, you must update the class diagram.
Best Practices for Modeling Success 🏆
To ensure your diagrams remain useful over time, follow these guidelines.
- Keep Names Consistent: Ensure object names in the diagram match the variable names in the code or the database schema. This reduces translation errors during implementation.
- Use Color Sparingly: While color can help distinguish types, avoid using too many colors. Stick to standard black and white for print compatibility and simplicity. Use bolding for emphasis instead.
- Version Control: Treat diagrams as code. Store them in your version control system. Changes to the diagram should be reviewed in pull requests, just like code changes.
- Limit Scope: Do not try to diagram the entire system in one go. Break it down by module or feature. A diagram covering the ‘Payment Module’ is more useful than one covering the ‘Entire Application’.
- Review Regularly: Models rot. Schedule periodic reviews to ensure the object diagrams still match the current state of the system. If the code changes and the diagram does not, the diagram becomes a liability.
Understanding Multiplicity in Object Context 🔢
Multiplicity is a concept that applies heavily to object diagrams. It defines how many instances can be linked to another instance.
In a class diagram, you might see a ‘1..*’ on a line. In an object diagram, this translates to a specific count of links. For example, if a ‘Customer’ object is linked to ‘Order’ objects with a ‘1..*’ multiplicity, the object diagram must show at least one order line connected to the customer object.
Violating this multiplicity in an object diagram indicates a design flaw. For instance, if a ‘Product’ is supposed to be linked to a ‘Supplier’ (1:1), but the object diagram shows the ‘Product’ linked to three different ‘Supplier’ objects, the model is invalid.
Validating these constraints early prevents data integrity issues later in the development cycle. It is a form of static analysis that happens at the design level.
Real-World Scenarios for Application 🌍
Let us look at how this applies in different industries.
- FinTech: In banking, object diagrams are used to model transaction states. They show which accounts are debited and which are credited at the moment of a transfer. This is vital for audit trails.
- Healthcare: In patient management systems, object diagrams can map patient records to their specific diagnoses and medications. This ensures that the data structure supports complex medical histories.
- E-Commerce: For shopping carts, object diagrams help visualize the relationship between a cart, the items inside it, and the user who owns it. It clarifies how inventory is reserved.
These scenarios demonstrate that the tool is versatile. It is not limited to abstract software engineering; it applies to any system where data relationships matter.
Final Thoughts on Modeling Clarity 💡
Mastering the object diagram is not about memorizing syntax. It is about understanding the difference between potential and actual. It is about knowing when to look at the blueprint and when to look at the building.
By avoiding the myths discussed in this guide, you can leverage object diagrams to reduce ambiguity in your projects. They serve as a bridge between abstract design and concrete implementation. When used correctly, they act as a safety net for data integrity.
Start small. Pick a complex module in your current project. Draw the class diagram. Then, draw the object diagram for a specific use case. Compare them. Notice the differences. This practice will solidify your understanding faster than any theoretical study.
Remember, the goal of modeling is communication. If your diagram helps a colleague understand the data structure, it has succeeded. Keep it simple, keep it accurate, and keep it up to date.