

When embarking on a software design assignment, the path from concept to code often feels like navigating a maze without a map. Students and junior engineers frequently focus heavily on class structures, forgetting that classes are merely blueprints. To truly understand how a system functions at runtime, one must visualize the actual instances that exist at a specific moment in time. This is where the Object Diagram becomes indispensable. It provides a concrete snapshot of the system, transforming abstract theory into tangible reality. 🧩
This guide explores the critical role object diagrams play in software design assignments. We will dissect their purpose, distinguish them from related models, and outline how they enhance clarity and precision in your work. By the end, you will understand why this specific artifact is not just an academic requirement, but a practical tool for robust engineering.
Understanding the Object Diagram 🧠
An object diagram is a static structural diagram that represents a specific set of objects and their relationships at a given point in time. Unlike the class diagram, which defines the template or structure, the object diagram depicts the actual data. Think of the class diagram as the architectural plan for a building, and the object diagram as a photograph of the building while it is being occupied. 🏢
In the context of your first assignment, this distinction is vital. Professors and reviewers are looking for evidence that you understand not just how the system is defined, but how it behaves when instantiated. The object diagram bridges the gap between the static definition of data and the dynamic flow of information.
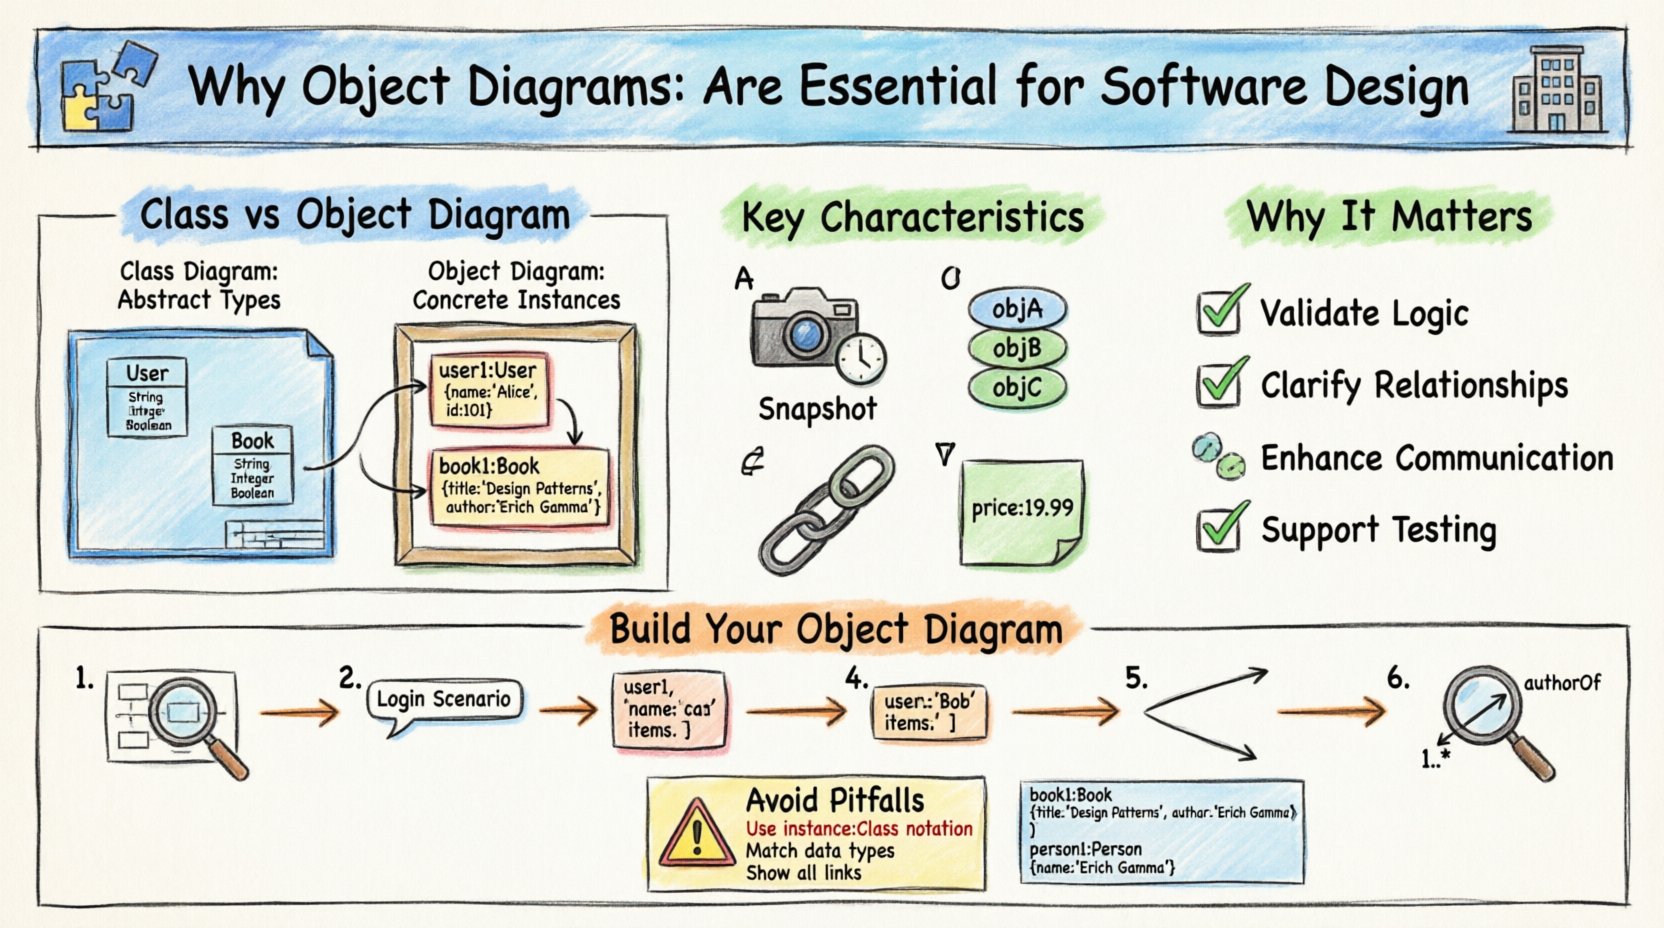
Key Characteristics
- Snapshot View: It captures the state of the system at a specific instant.
- Instance Focus: It deals with specific objects, not generic classes.
- Relationships: It shows links between objects, mirroring associations in the class model.
- Attribute Values: Unlike class diagrams that list types, object diagrams list actual values assigned to attributes.
Object Diagrams vs. Class Diagrams 🆚
Confusion between these two models is common among beginners. To ensure your assignment demonstrates deep understanding, you must clearly differentiate them. The table below highlights the structural and functional differences.
| Feature | Class Diagram | Object Diagram |
|---|---|---|
| Focus | Abstract structure and types | Concrete instances and data |
| Notation | Underlined class names | Underlined object names (instance.class) |
| Time | Static definition (Blueprint) | Snapshot in time (Reality) |
| Attributes | Data types (e.g., String, Integer) | Specific values (e.g., “John”, 25) |
| Usage | Design phase, coding structure | Validation, debugging, documentation |
By including an object diagram in your assignment, you signal to the reader that you have considered the data integrity and the actual state of the system, not just the schema. 🛡️
Why It Matters for Your Assignment 📝
There are several compelling reasons why object diagrams are essential for academic and professional design tasks. These reasons go beyond simply fulfilling a checklist item. They fundamentally improve the quality of your design.
1. Validation of Design Logic ✅
When you draw an object diagram, you are forced to instantiate your classes. This process often reveals logical gaps that were invisible in the class diagram. For example, you might realize that an object requires a value that cannot be derived from its constructor, or that a relationship implies a dependency that was not previously accounted for. It acts as a sanity check for your architecture.
- Identifies missing constraints.
- Reveals impossible data configurations.
- Ensures multiplicity rules are followed.
2. Clarifying Complex Relationships 🔗
Software systems often involve complex associations, such as many-to-many relationships or aggregation. While a class diagram shows the potential for these links, an object diagram shows them in action. It answers the question: “If I have User A and Order B, how exactly do they connect?” Visualizing the links between specific instances makes the navigation paths of your data much clearer.
3. Enhancing Communication 🗣️
Design is a communication tool. Stakeholders, including your instructors or team leads, may not be able to visualize a complex class hierarchy instantly. An object diagram provides a concrete example that is easier to grasp. It serves as a narrative of how the system works, making your documentation more accessible and reducing ambiguity.
4. Supporting Testing Scenarios 🧪
In your assignment, you might be asked to describe test cases. Object diagrams are the foundation of unit testing scenarios. They represent the initial state of the system before a test method runs. By documenting the expected state before and after an operation, you create a clear benchmark for success.
Constructing an Object Diagram: A Step-by-Step Approach 🛠️
Creating a high-quality object diagram requires a methodical approach. Do not rush the drawing process. Follow these steps to ensure accuracy and completeness.
- Analyze the Class Diagram: Start with your existing class definitions. Identify which classes are relevant to the specific scenario you are modeling.
- Define the Scenario: Determine what moment in time you are capturing. Is it during initialization? After a transaction? During a search? Context matters.
- Create Instances: Draw the objects. Name them using the convention `instanceName : ClassName`. This clearly distinguishes them from the class itself.
- Assign Attribute Values: Fill in the attributes. Use representative data. If a name is a String, write “Alice”. If an ID is an Integer, write 101. This demonstrates you understand the data types.
- Draw Links: Connect the objects with lines. Label the links if necessary to show the role played in the relationship.
- Verify Multiplicity: Check that the number of links matches the multiplicity constraints defined in your class diagram (e.g., one-to-many).
Common Pitfalls to Avoid ⚠️
Even experienced designers make mistakes when creating these diagrams. To ensure your assignment receives the highest marks, avoid these common errors.
- Using Class Names for Objects: Never label an object simply as “User”. It must be “user1 : User”. This is a critical syntax rule.
- Inconsistent Data Types: Do not put text in a numeric field. If the attribute is defined as an integer, do not write “twenty”. Write 20.
- Omitting Links: If two objects are related, draw a line. Empty space implies no relationship.
- Overcomplicating: Do not try to model the entire system in one diagram. Focus on a specific use case or interaction. A diagram showing every possible object is too large to be useful.
- Ignoring Null Values: If an object does not currently hold a value for a mandatory field, represent this clearly (often with or null).
Integrating with the Development Lifecycle 🔄
Object diagrams are not isolated artifacts. They integrate into the broader software development lifecycle (SDLC). Understanding where they fit helps you justify their inclusion in your assignment documentation.
During Analysis
At the analysis stage, object diagrams help stakeholders visualize the data. They ensure that the requirements regarding data storage and relationships are understood before code is written.
During Design
During design, developers use these diagrams to plan memory allocation and initialization sequences. They help decide how objects are created and destroyed.
During Testing
Testers use the diagrams to set up preconditions. A test case is essentially a sequence of state changes, and the object diagram represents the starting state.
During Maintenance
When fixing bugs, engineers often draw an object diagram to trace the flow of data that caused the error. It helps in understanding the state of the system at the moment of failure.
Deep Dive: Attributes and Values 📊
One of the most distinct features of an object diagram is the handling of attribute values. In a class diagram, you write price : decimal. In an object diagram, you write price : 19.99. This specificity is what gives the diagram its power.
Consider a scenario involving a library management system. The class diagram might define a Book class with attributes like title and author. The object diagram, however, would show a specific book instance: book1 : Book with title = “The Design Patterns” and author = “Erich Gamma”.
This level of detail forces you to think about the actual data. It prevents vague designs where you assume the data will exist without verifying if the constraints allow it. For instance, if the class diagram says the author must be a Person object, the object diagram must show a link to an actual Person instance, not just a string name.
The Role of Links and Associations 🔗
Links in an object diagram represent the connections between objects. They are the runtime counterparts to associations in the class diagram. It is important to understand how these are represented.
- Association Links: These connect objects that are related. For example, a Student object linked to a Course object.
- Role Names: If an association has a role name (e.g., “enrolled in”), it should be labeled on the link in the object diagram.
- Multiplicity: The number of links connected to an object must adhere to the multiplicity defined in the class diagram. If a Student can enroll in many Courses, the object diagram should show the Student object connected to multiple Course objects.
When drawing these links, ensure they are straight and clear. Avoid crossing lines where possible, as this reduces readability. If lines must cross, use a bridge notation to indicate they do not intersect at that point.
Documentation and Presentation 📄
In an assignment context, how you present the diagram is just as important as the diagram itself. You must provide context. A diagram without a caption or description is difficult to interpret.
Best Practices for Presentation
- Clear Title: Give the diagram a descriptive title, such as “Order Processing State at Checkout”.
- Legend: If you use specific colors or line styles, include a legend to explain them.
- Annotations: Use text boxes to explain complex interactions or specific data values that might not be immediately obvious.
- Consistency: Ensure the object names match the naming conventions used elsewhere in your documentation.
Remember, the goal is clarity. If a reviewer has to guess what a label means, the diagram has failed its purpose. Make the connections obvious and the data explicit.
Advanced Considerations: Aggregation and Composition 🏗️
Understanding the difference between aggregation and composition is crucial for advanced assignments. While class diagrams show this with diamond shapes, object diagrams show the lifecycle dependency.
- Aggregation: The whole can exist without the part. In the diagram, you might see the whole object and the part object exist independently.
- Composition: The part cannot exist without the whole. In the diagram, this is implied by the strong binding of the instance. If the whole object is removed, the part object is typically removed as well.
When modeling these in an assignment, ensure your link styles reflect the strength of the relationship. Solid lines usually denote association, while filled diamonds denote composition. Ensure you follow the standard notation guidelines provided in your course materials.
Conclusion: Elevating Your Design Work 🚀
The object diagram is more than a diagrammatic requirement; it is a thinking tool. It forces you to move from the abstract to the concrete, from the potential to the actual. By including this in your first software design assignment, you demonstrate a maturity in your engineering approach. You show that you care about the data, the state, and the reality of the system, not just its theoretical structure.
Take the time to learn this notation. Use it to validate your logic. Use it to communicate with your peers. And use it to build software that is robust, clear, and well-documented. This small addition to your toolkit will pay dividends throughout your career in software engineering.