


👋 Introduction to Visual Literacy in Software Design
In the complex landscape of software architecture, understanding the static structure of a system is crucial. While text-based documentation provides details, visual representations offer immediate insight into how components interact at a specific moment in time. This is where the Object Diagram becomes an essential tool for developers, architects, and stakeholders. Reading an object diagram effectively requires more than just recognizing shapes; it demands an understanding of instances, attributes, and relationships as they exist in a concrete state.
This guide is designed to build your visual literacy. We will move beyond simple definitions to explore the mechanics of interpretation. By the end of this article, you will be able to look at a diagram and understand the exact state of an application’s data structure without needing to run the code. This skill is vital for debugging, documentation, and system design reviews. We will focus on the core elements, the notation, and the logic behind the connections, ensuring you can decode these diagrams with confidence.
🧩 What Exactly Is an Object Diagram?
An object diagram is a snapshot of a system at a specific point in time. It is a specialized type of UML (Unified Modeling Language) diagram that focuses on instances rather than blueprints. While a class diagram shows the rules and templates for how objects should be built, an object diagram shows the actual objects that have been created and how they are connected right now.
- Static View: It represents a static structure, much like a class diagram, but populated with real data.
- Instance Focus: It deals with specific instances (objects) rather than general classes.
- Time-Bound: It captures a moment, often representing a specific test case or a production scenario.
Imagine a class diagram as a blueprint for a house. It shows where the doors and windows should go. An object diagram is a photograph of a specific house that has been built. It shows the actual door, the specific paint color on the walls, and who is standing in the doorway. This distinction is fundamental to reading these diagrams correctly.
🔍 Anatomy of an Object Diagram
To read a diagram fluently, you must understand its components. Every object diagram is constructed from a few key elements. These elements carry specific meanings that, when combined, tell the story of the system’s state.
1. Object Instances
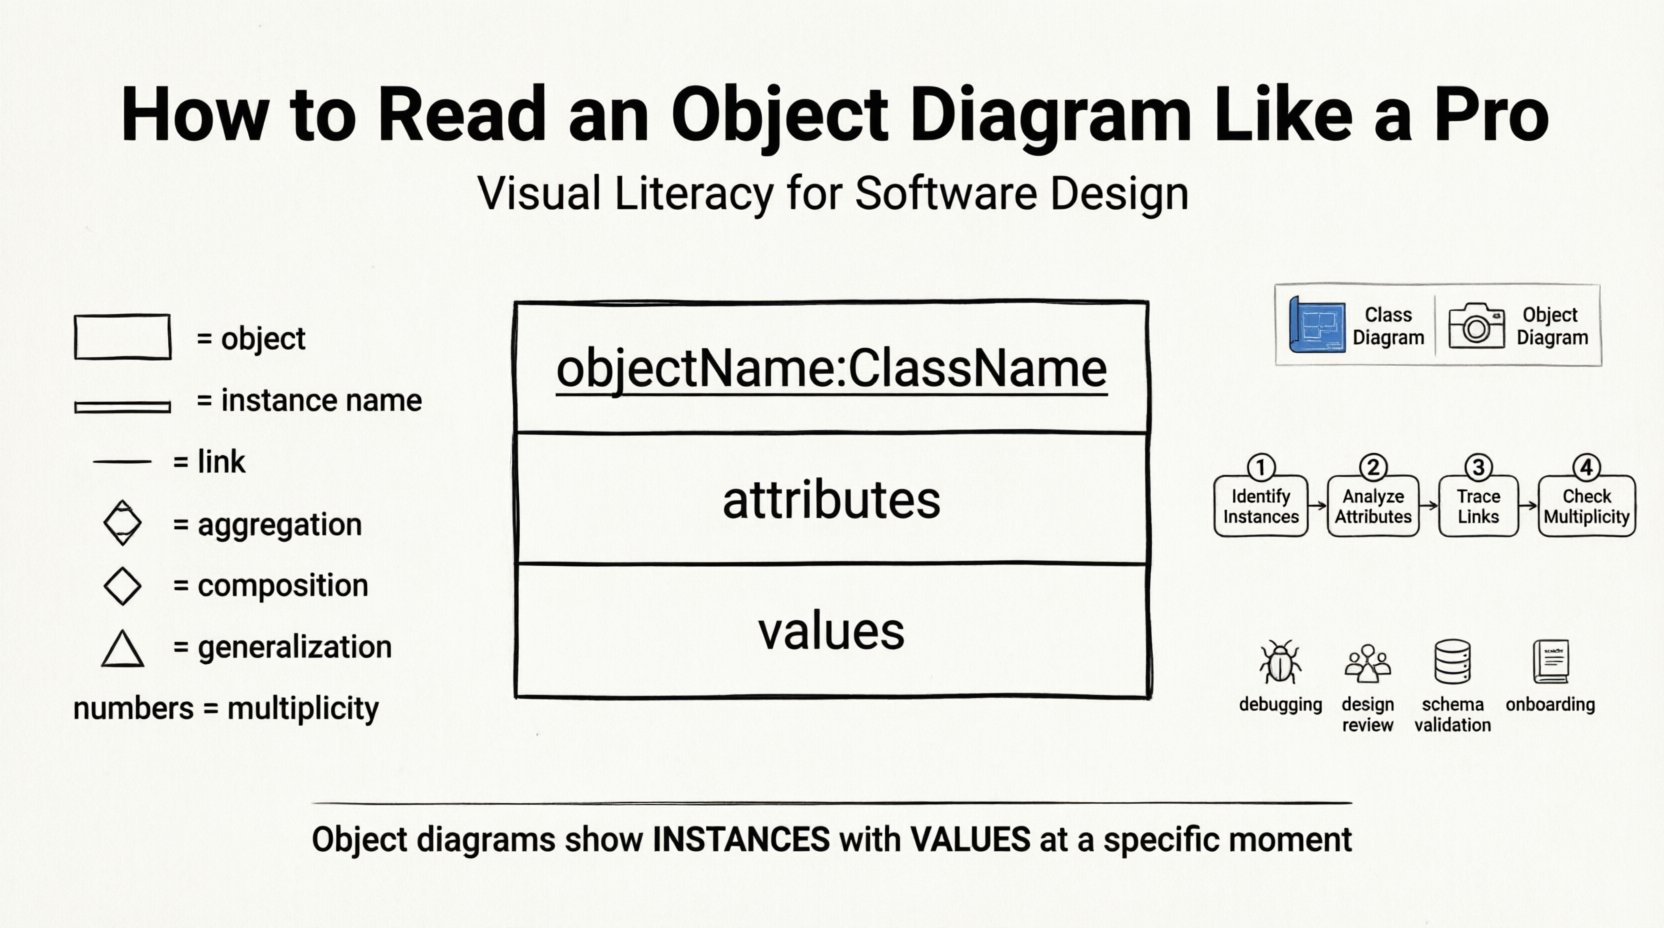
Instances are the primary actors in the diagram. They are represented as rectangles. Each rectangle represents a specific object that has been instantiated from a class. The rectangle is divided into sections, typically three, to convey different levels of information.
- Top Section: Contains the object name and the class name it belongs to.
- Middle Section: Lists the attributes of the object.
- Bottom Section: Lists the values assigned to those attributes at the time of the snapshot.
2. Links and Relationships
Objects do not exist in isolation. They are connected to other objects through links. These links represent the associations between instances. A link is essentially a specific relationship between two objects, similar to an association between classes, but concrete.
- Association Links: Standard connections between objects.
- Multiplicity: Indicates how many objects one object can be linked to (e.g., one-to-many).
- Navigability: Sometimes indicated by arrows, showing which direction the relationship can be traversed.
📋 Notation Guide: Symbols and Meanings
Visual literacy relies on recognizing symbols quickly. The table below outlines the standard notation used in object diagrams. Understanding these symbols allows you to scan a diagram rapidly and extract meaning.
| Element | Visual Representation | Meaning |
|---|---|---|
| Object Instance | Rectangle with three sections | A specific instance of a class with defined values |
| Object Name | Underlined text at the top | Unique identifier for the instance (e.g., user1) |
| Class Name | Text following the instance name | The blueprint the instance was created from (e.g., :Customer) |
| Attribute | Text in the middle section | A property of the object (e.g., email) |
| Attribute Value | Text in the bottom section | The actual data stored at this moment (e.g., “[email protected]”) |
| Link | Line connecting two objects | A relationship between two specific instances |
| Link Label | Text on the connecting line | The role or name of the relationship |
| Multiplicity | Numbers on the ends of links | Constraints on how many objects can connect |
🧭 Step-by-Step Process for Reading
Reading a diagram is a systematic process. Rushing through it can lead to misunderstandings about the system state. Follow this structured approach to ensure accurate interpretation.
Step 1: Identify the Instances
Start by scanning the diagram to locate all the rectangles. Count them. Each rectangle represents a distinct entity in the system. Note the names. If you see order1 and order2, you are looking at two separate transactions, not one generalized order.
Step 2: Analyze the Attributes
Look at the middle and bottom sections of each rectangle. This tells you the state of the data. If an attribute is empty, it might be null or uninitialized. If it has a value, it is active. Pay attention to data types. A string value looks different from an integer value.
Step 3: Trace the Links
Move to the lines connecting the objects. Trace from one object to another. Ask yourself: What does this connection represent? Is it a parent-child relationship? Is it a dependency? Follow the direction of the arrows if present. This reveals the flow of data or control.
Step 4: Check Multiplicity
Look at the numbers near the ends of the links. If you see a 1, it means exactly one. If you see a 0..*, it means zero or more. This is critical for understanding constraints. For example, a Customer might be linked to 0 or more Orders. An Order must be linked to exactly 1 Customer.
🔗 Understanding Relationships in Detail
Relationships define how objects interact. In object diagrams, these are more concrete than in class diagrams. Here is a breakdown of the common relationship types you will encounter.
- Association: A structural relationship where objects are linked. It implies that one object knows about the other. In an object diagram, this is a solid line. Example: A Driver drives a Car.
- Aggregation: A whole-part relationship where the part can exist independently of the whole. Visually, this is often a diamond shape on the whole end. Example: A Department has Employees, but Employees exist without the Department.
- Composition: A stronger form of aggregation where the part cannot exist without the whole. If the whole is destroyed, the part is destroyed. Visually, this is a filled diamond. Example: A House has Rooms. If the House is gone, the Rooms are gone.
- Generalization: Inheritance. A subclass object is also an instance of the superclass. Visually, a line with a hollow triangle points to the superclass. Example: A Dog object is also a Mammal object.
⚖️ Object Diagram vs. Class Diagram
It is common to confuse object diagrams with class diagrams. Both use similar shapes, but their purpose and content differ significantly. Understanding this difference prevents misinterpretation of the system architecture.
| Feature | Class Diagram | Object Diagram |
|---|---|---|
| Focus | General structure and rules | Specific instances and data |
| Content | Class names, methods, attributes | Object names, attribute values |
| Time | Static, timeless rules | Snapshot at a specific time |
| Usage | Design phase, blueprinting | Debugging, testing, validation |
| Complexity | High level overview | Detailed, concrete state |
When you see a diagram with method signatures like +getName(): String, you are looking at a class diagram. When you see a diagram with values like name: “John Doe”, you are looking at an object diagram. This distinction is the first step in accurate reading.
🛠️ Real-World Scenarios for Object Diagrams
Why do we create and read these diagrams? They serve practical purposes in software development and maintenance. Knowing the context helps you read with the right intent.
1. Debugging Complex State
When a bug occurs, it is often due to a specific state of objects. An object diagram can help visualize the state at the moment of failure. Instead of guessing which variable holds what value, the diagram provides a clear map of the data flow and object connections.
2. Design Reviews
During a design review, stakeholders need to see how data will flow. An object diagram provides a concrete example of a typical scenario. It helps non-technical stakeholders understand the system by showing specific data points rather than abstract classes.
3. Database Schema Validation
Before writing code, developers can use object diagrams to validate the database schema. By mapping out the objects and their links, one can ensure that foreign keys and relationships are correctly defined before implementation begins.
4. Documentation and Onboarding
New team members often struggle to understand the system. A set of object diagrams showing key transactions (like “Placing an Order” or “Logging In”) provides a quick reference for how data moves through the application.
🚫 Common Mistakes to Avoid
Even experienced readers can fall into traps when interpreting diagrams. Being aware of these common pitfalls will improve your accuracy.
- Ignoring Multiplicity: Failing to check the numbers on the links can lead to incorrect assumptions about data volume. Always verify if a link is one-to-one or one-to-many.
- Confusing Class and Object: Do not treat object names as class names. customer1 is not a class; it is an instance of the Customer class.
- Overlooking Null Values: An empty attribute box does not mean the attribute doesn’t exist. It means the value is currently null or unset. This is critical for logic checks.
- Missing Link Labels: A line without a label is ambiguous. Try to infer the relationship from the context, but be aware that the diagram might be incomplete.
- Assuming Dynamic Behavior: Object diagrams are static. They do not show behavior or methods. Do not try to infer the logic of the code from the diagram alone.
✅ Best Practices for Visualization
Creating and reading object diagrams effectively requires adherence to certain best practices. These guidelines ensure clarity and consistency across documentation.
- Consistent Naming: Use clear, descriptive names for objects. Avoid generic names like obj1 or obj2. Use order1 or activeUser to provide context.
- Logical Layout: Arrange objects logically. Group related objects together. Use white space to separate distinct clusters of data.
- Standard Notation: Always use standard UML notation. Deviating from standard symbols can confuse readers who are used to the conventions.
- Focus on Key Objects: Do not try to diagram the entire system in one view. Break it down into use case-specific diagrams. Focus on the objects relevant to the scenario being depicted.
- Regular Updates: If the diagram represents a live state, ensure it is updated. An outdated object diagram can be more confusing than helpful.
🧠 Deep Dive: Interpreting Attribute Values
The bottom section of an object rectangle is often the most informative part. It contains the actual data. Here is how to interpret it more deeply.
- Data Types: Notice the distinction between strings, integers, and booleans. A value of true indicates an active flag. A value of 0 might indicate a count or an ID.
- References: Sometimes, an attribute value is another object. This is shown as a reference (e.g., customer: customer1). This indicates a direct link to another instance in the diagram.
- Complex Objects: Some objects contain complex data structures. In diagrams, these might be represented as nested boxes or simplified into a single value depending on the level of detail required.
- Collection Types: Lists or arrays are common. A value like [“item1”, “item2”] indicates a collection of items associated with that object.
🚀 Advanced Reading Techniques
Once you are comfortable with the basics, you can apply more advanced techniques to analyze system behavior and integrity.
Tracing Data Flow
Follow a chain of links to see how data propagates. Start at a user input object and trace the links through the system to the database object. This helps in understanding the journey of data through the application.
Identifying Orphan Objects
Look for objects that are not linked to anything. These are “orphan” objects. They might represent data that has been created but not associated with a parent. This is often a sign of a logic error in the system design.
Validating Constraints
Check if the diagram violates any constraints. For example, if a link requires a specific role, ensure the object fulfills it. If a multiplicity says “at most one”, ensure no object has multiple links in that direction.
📝 Final Considerations
Visual literacy in software design is a skill that improves with practice. Reading object diagrams allows you to see the invisible structure of your application. It bridges the gap between abstract code and concrete reality. By understanding the components, notation, and relationships, you can navigate complex systems with ease.
Remember to take your time. Do not rush the reading process. Look at the instances, check the values, and trace the links. With practice, you will find that these diagrams become a natural part of your workflow. They are powerful tools for communication, debugging, and design. Use them to clarify your thoughts and share your vision with others.
Keep these tips in mind as you continue to explore system architecture. The ability to interpret these diagrams accurately will make you a more effective developer and a more valuable team member. Start with simple diagrams and gradually move to more complex structures. The journey to mastery begins with understanding the basics.