


In the complex architecture of modern information systems, the distance between a database record and a running application instance is often bridged by abstraction. Developers and architects frequently rely on class diagrams to define structure, yet these static blueprints often fail to capture the dynamic reality of data at a specific moment in time. This is where the object diagram becomes an essential tool. It serves as a snapshot of the system, revealing how instances interact, how data flows, and how the code actually behaves during execution.
Understanding this distinction is critical for anyone involved in system design, database engineering, or software maintenance. While class diagrams describe the type definitions, object diagrams describe the actual state. This guide explores the mechanics, benefits, and practical applications of object diagrams within information systems, providing a clear path to better system visibility.
🔍 What Is an Object Diagram? 🧩
An object diagram is a type of diagram used in the Unified Modeling Language (UML). It represents a specific instance of a system at a given point in time. Unlike a class diagram, which outlines the potential structure and relationships, an object diagram shows the concrete data that exists within the system during a particular operation or transaction.
Think of the class diagram as the architectural blueprint of a building, specifying the materials and dimensions. The object diagram is a photograph of the building after it has been constructed, showing exactly where the furniture is placed, who is inside, and which lights are on. In the context of information systems, this distinction is vital for debugging, documentation, and verifying data integrity.
Key Characteristics
- Instances: It focuses on instances (objects) rather than classes. For example, instead of showing a
Customerclass, it shows a specific object namedcust_101. - State: It displays the current values of attributes. A
Customerclass might have an attributestatus, but the object diagram showsstatus = "Active". - Links: It visualizes the connections between specific objects, showing exactly how
cust_101is linked toorder_55. - Static Snapshot: It represents a static view of the system at a specific moment, freezing the dynamic flow of data.
⚖️ Class Diagram vs. Object Diagram ⚙️
Confusion often arises between class diagrams and object diagrams because both deal with structure. However, their purposes differ significantly. One defines the rules; the other shows the reality. Understanding when to use which prevents design errors and documentation gaps.
| Feature | Class Diagram | Object Diagram |
|---|---|---|
| Focus | Abstract definitions and types | Concrete instances and data |
| Notation | Underlined class names | Underlined object names (e.g., name:Type) |
| Timeframe | Timeless (defines structure) | Point-in-time snapshot |
| Attribute Values | Data types only (e.g., String) |
Actual values (e.g., "John Doe") |
| Usage | Initial design and schema definition | Debugging, testing, and state verification |
When designing an information system, the class diagram is created first. It sets the contract. The object diagram is used later to validate that the implementation adheres to that contract under real-world conditions.
🔗 The Role of Object Diagrams in Information Systems 🌐
Information systems are not just code repositories; they are data processing engines. They ingest, store, transform, and output data. The object diagram provides a layer of visibility that is often missing in high-level architectural documents. It connects the abstract logic of the code to the tangible reality of the database.
1. Validating Data Persistence
One of the most common challenges in system development is ensuring that data saved to a database is correctly represented in the application code. An object diagram can map the state of an object before and after a transaction. This helps architects verify that:
- Foreign keys are correctly resolved.
- Nullable fields are handled appropriately.
- Complex relationships (one-to-many, many-to-many) are maintained.
By visualizing the instance links, developers can spot broken chains of data that might not be obvious when looking at code alone.
2. Debugging Complex State Changes
When a system behaves unexpectedly, the issue often lies in the state of the objects rather than the logic itself. A sequence diagram shows the flow of messages, but an object diagram shows the state of the objects involved in that flow.
For example, if a payment fails, an object diagram can show the state of the Payment object, the Account object, and the TransactionLog object at the moment of failure. This allows engineers to see if the data was corrupted, missing, or in an invalid state before the error was thrown.
3. Simplifying API Documentation
APIs expose data structures to external consumers. While JSON schemas describe the types, they do not always describe the relationships effectively. An object diagram can illustrate a sample payload, showing how nested objects relate to one another. This is particularly useful for:
- Onboarding new developers to a legacy system.
- Explaining data models to non-technical stakeholders.
- Documenting edge cases in data structures.
🛠️ Constructing Effective Object Diagrams 📝
Creating a useful object diagram requires discipline. It is easy to create a cluttered mess that adds confusion rather than clarity. To maintain authority and precision, follow these structural guidelines.
1. Select the Scope Carefully
Do not attempt to diagram the entire system in a single view. Information systems are vast. Focus on a specific use case or a critical transaction flow.
- Too Broad: An object diagram showing every customer, order, and product in the database.
- Just Right: An object diagram showing the state of a single customer’s active shopping cart and pending order.
2. Use Consistent Naming Conventions
Object names should be unique and descriptive. A common convention is objectName:ClassName. This makes it clear which class the instance belongs to while distinguishing it from other instances of the same class.
- Example:
order_001:Order - Example:
user_admin:User
3. Represent Relationships Accurately
Links between objects must reflect the actual constraints defined in the class diagram. If a Customer can have many Orders, the object diagram must show the specific Order instances linked to the specific Customer instance.
- Association: A simple line connecting two objects.
- Aggregation: A line with a hollow diamond, indicating a “has-a” relationship where the parts can exist independently.
- Composition: A line with a filled diamond, indicating a strong “owned-by” relationship where parts cannot exist without the whole.
4. Label Attribute Values
Unlike class diagrams, object diagrams must display attribute values. This is the primary source of information. If an attribute is empty or null, represent that clearly.
- Correct:
balance: 500.00 - Correct:
status: null - Incorrect: Just showing the attribute name without a value.
📉 Common Pitfalls and How to Avoid Them ⚠️
Even experienced architects can stumble when working with object diagrams. Recognizing these pitfalls early saves time and reduces technical debt.
1. Over-Modeling
Creating diagrams for every possible state leads to maintenance nightmares. Systems evolve, and keeping diagrams synchronized with code is difficult.
- Solution: Treat object diagrams as documentation for critical paths only. Do not document every CRUD operation.
2. Ignoring Lifecycle States
An object diagram often implies a static state, but objects are dynamic. Failing to document the lifecycle transitions (e.g., from Pending to Shipped) can lead to confusion about valid states.
- Solution: Use multiple object diagrams to represent different stages of the same entity’s lifecycle.
3. Mixing Levels of Abstraction
Combining high-level system objects with low-level implementation details in one diagram reduces readability.
- Solution: Keep implementation details (like internal IDs or temporary variables) out of the diagram unless they are critical to the specific scenario being analyzed.
💾 Integration with Database Design 🗃️
The relationship between object diagrams and database schemas is symbiotic. While the database schema defines the storage structure, the object diagram defines the runtime structure. Bridging these two views ensures data consistency.
1. Schema Validation
When a database schema is updated, the object diagrams should be reviewed. If a new column is added to a table, the corresponding object diagram should reflect this new attribute. This helps identify code that might break due to the schema change.
2. Mapping Complexity
Object-oriented programming often maps poorly to relational databases. An object diagram can reveal these mismatches. For instance, if a code model has a deeply nested object graph, but the database is flat, the object diagram highlights the complexity that the ORM (Object-Relational Mapping) layer must resolve.
3. Performance Implications
By visualizing the links between objects, architects can identify potential N+1 query problems. If an object diagram shows a User object linked to 100 Logs, and the code attempts to fetch all logs for every user in a list, performance degradation is likely. The diagram makes this structural risk visible.
🔄 Maintenance and Evolution 🌱
Software systems are living entities. They grow, change, and adapt. An object diagram that is valid today may be obsolete tomorrow. Maintaining these diagrams requires a strategy that balances accuracy with effort.
1. Automated Generation
While manual creation offers precision, automated tools can generate object diagrams from running systems or code snapshots. This ensures the diagram always reflects the current state of the application.
- Pros: Always up-to-date, no manual maintenance.
- Cons: Can be noisy, may include internal debugging data not relevant to business logic.
2. Version Control
Just like code, object diagrams should be version controlled. Changes to the data structure should be tracked. This allows teams to review historical states of the system when investigating past issues.
3. Stakeholder Review
Object diagrams are not just for developers. They are valuable for database administrators, QA engineers, and product managers. Regular reviews ensure that the representation of data aligns with business requirements and expectations.
🚀 Practical Example: E-Commerce Transaction 🛒
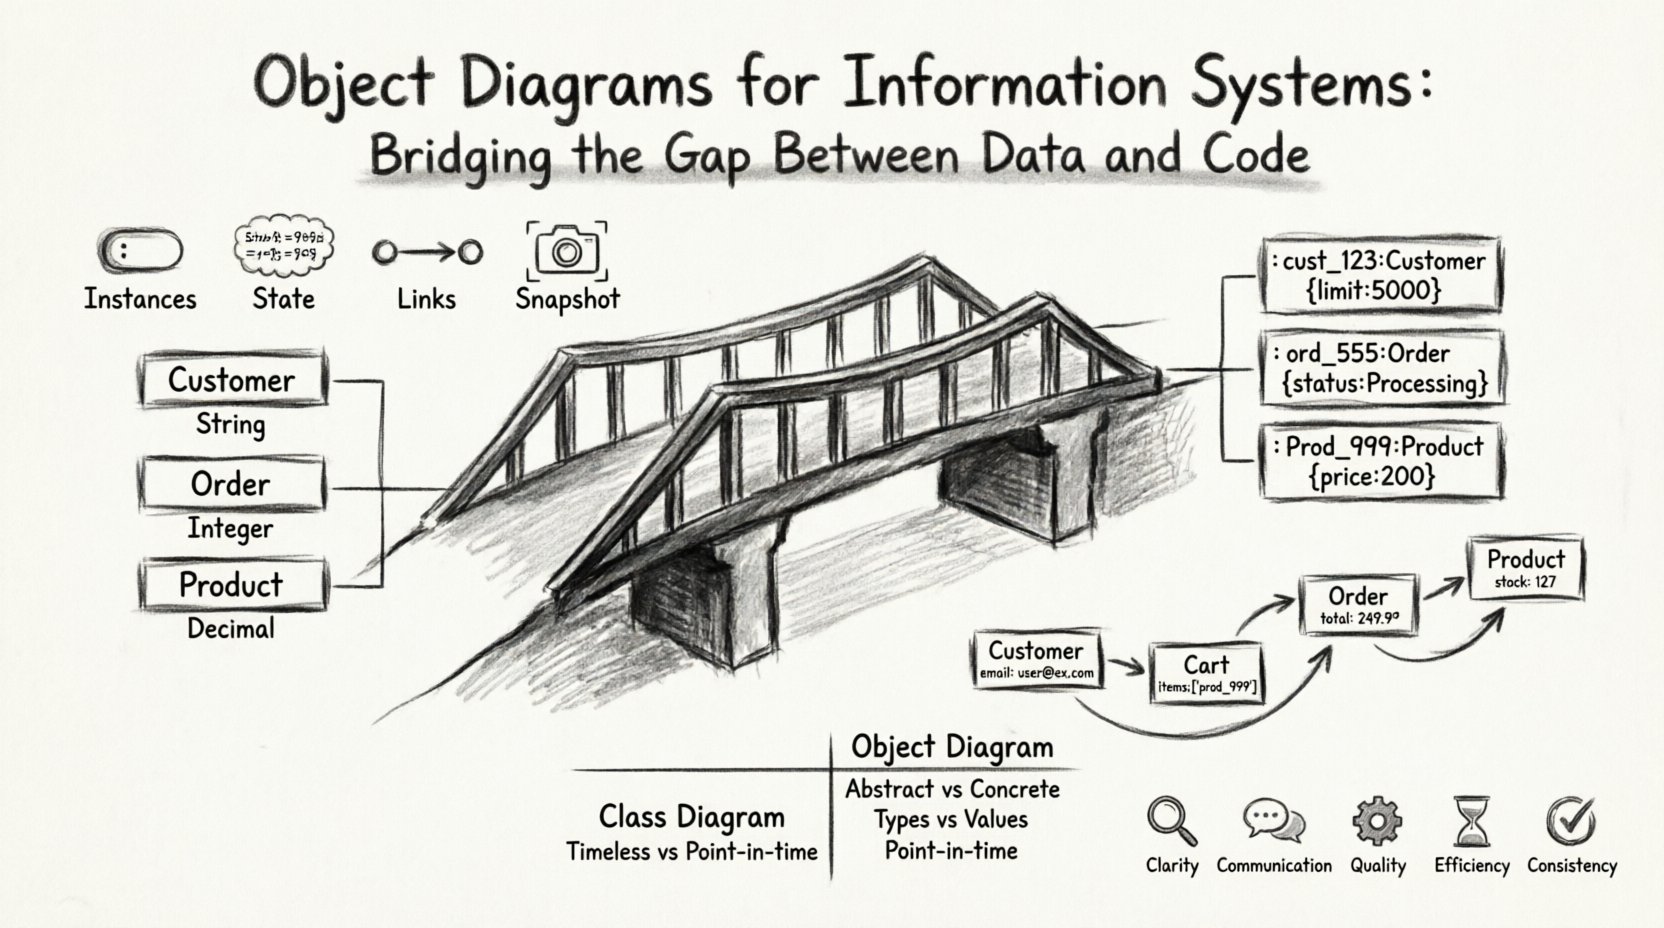
To illustrate the value of an object diagram, consider an e-commerce transaction where a user places an order.
Imagine the following scenario:
- A
Customerobject exists with an ID of123and a credit limit of$5000. - The customer adds a
Product(ID999, Price$200) to aCart. - The system creates an
Orderobject (ID555, StatusProcessing). - The
Orderis linked to theCustomerand contains theProduct.
A class diagram would simply show that Customer has Order and Order has Product. An object diagram, however, shows:
cust_123:Customer(limit: 5000)prod_999:Product(price: 200)cart_X:Cart(items: [prod_999])ord_555:Order(status: Processing, customer: cust_123)
This visualization confirms that the order is linked to the correct customer and that the product is included. If the link were missing, the diagram would immediately reveal the data inconsistency.
📊 Summary of Benefits 📈
Integrating object diagrams into the information systems lifecycle offers distinct advantages that go beyond simple documentation.
- Clarity: Reduces ambiguity in how data is structured at runtime.
- Communication: Provides a common language for technical and non-technical teams.
- Quality: Helps identify data integrity issues before deployment.
- Efficiency: Speeds up debugging by visualizing state rather than guessing.
- Consistency: Ensures the database schema matches the application logic.
By treating object diagrams as a core component of system design rather than an afterthought, organizations can build more robust, reliable, and maintainable information systems. The bridge between code and data becomes solid, ensuring that the system functions as intended in the real world.
🔮 Future Considerations 🌐
As systems become more distributed and microservices-oriented, the need for clear data representation increases. Object diagrams remain relevant even in cloud-native environments. They help define the payload structures passed between services and ensure that data contracts are respected across the network.
The principles of object modeling do not change with the technology stack. Whether using traditional monoliths or serverless architectures, the relationship between data instances and code logic remains constant. Mastering this relationship is key to building systems that scale.
Continuing to refine how we visualize and document object states will lead to better software architecture. It is a practice of precision that pays dividends in system stability and developer productivity.