


Welcome to the world of software modeling. If you have ever looked at a complex system and wondered how different pieces connect in real-time, you are thinking like a modeler. Object Diagrams are a powerful tool in the Unified Modeling Language (UML) arsenal. They provide a snapshot of a system at a specific moment in time.
This guide is designed for beginners who want to understand the mechanics of Object Diagrams without getting lost in jargon. We will explore the theory, the notation, the practical steps, and the best practices. No marketing fluff, just clear technical knowledge.
What is an Object Diagram? 📊
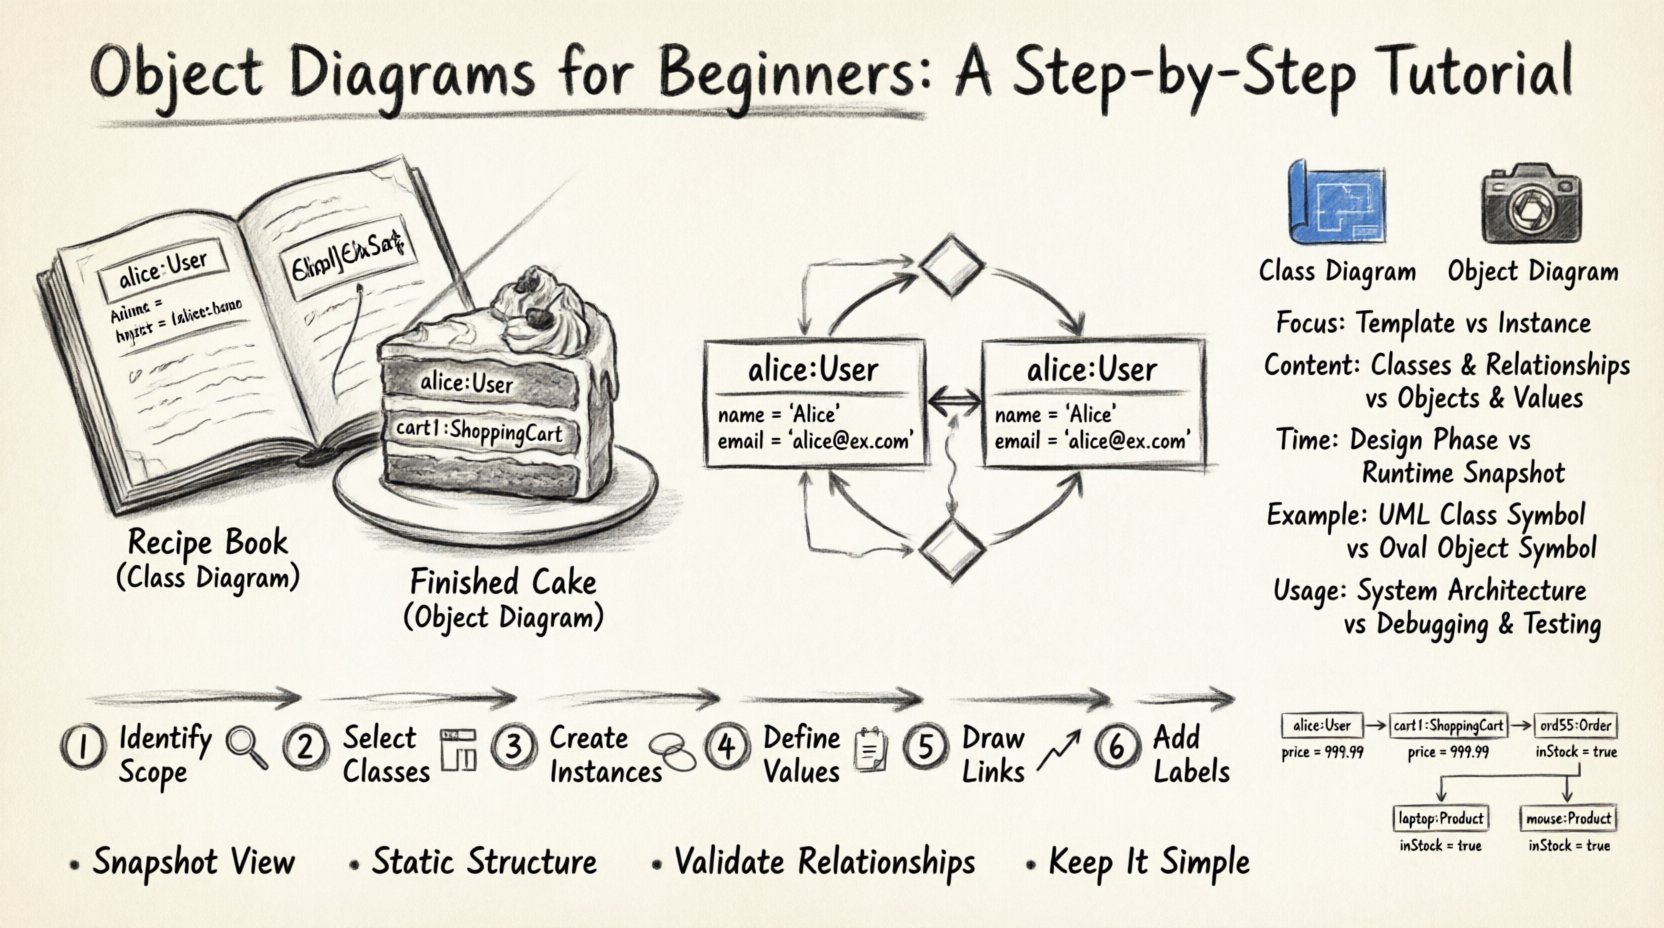
An Object Diagram is a static structure diagram. It describes the structure of a system by showing a set of objects and their relationships at a particular point in time. While a Class Diagram shows the blueprint of your system, an Object Diagram shows the actual building blocks in place.
Think of a Class Diagram as a recipe. It tells you what ingredients you need and the proportions. An Object Diagram is the actual cake on the plate. It shows the specific state of the data.
Key characteristics include:
- Snapshot View: It represents a specific instance of a system.
- Static Structure: It does not show behavior or flow, only relationships.
- Realization: It helps visualize how the code will look when running.
- Validation: It is used to verify if the design matches the intended logic.
Core Components of an Object Diagram 🧩
To create a valid diagram, you must understand the fundamental elements. Each element has a specific visual representation and a technical definition.
1. Objects (Instances)
An object is a concrete instance of a class. In the diagram, an object is represented by a rectangle. The rectangle is divided into three sections:
- Top Section: Contains the object name. It is often italicized to distinguish it from the class name.
- Middle Section: Contains the type or class name, preceded by a colon. Example:
User:Customer. - Bottom Section: Contains the attribute values. This is where the actual data lives.
2. Links (Associations)
Links represent the relationships between objects. A link is a line connecting two objects. This is the runtime version of an association defined in a Class Diagram.
- Direction: Arrows indicate navigability.
- Multiplicity: Labels on the line show how many objects can be connected (e.g., 1, 0..1, *).
3. Roles
When two objects are linked, they often play specific roles. The name of the role is placed near the end of the link line. This clarifies the relationship.
4. Aggregation and Composition
These are special types of links representing part-of relationships.
- Aggregation (Diamond): A weak relationship. If the whole is destroyed, the parts may still exist.
- Composition (Filled Diamond): A strong relationship. If the whole is destroyed, the parts are destroyed.
Object Diagram vs. Class Diagram ⚖️
Beginners often confuse these two. Understanding the difference is crucial for accurate modeling. Below is a comparison to clarify the distinction.
| Feature | Class Diagram | Object Diagram |
|---|---|---|
| Focus | Blueprint / Template | Instance / Snapshot |
| Content | Classes, Attributes, Methods | Objects, Attribute Values |
| Time | Timeless (Design) | Point in Time (Runtime) |
| Example | Class: Car |
Object: myCar: Car (Red, Model X) |
| Usage | Database Design, Code Structure | Testing, Debugging, Documentation |
Step-by-Step: Creating an Object Diagram 🛠️
Now that we understand the theory, let us walk through the process of creating one. Follow these steps to build a clear diagram.
Step 1: Identify the System Scope
Decide what part of the system you are modeling. Do not try to model the entire application in one diagram. Focus on a specific use case or scenario. For example, “Order Processing” or “User Login”.
Step 2: Select Relevant Classes
Look at your Class Diagram. Identify the classes involved in your specific scenario. If you are modeling an order, you likely need Customer, Order, and Product classes.
Step 3: Create Object Instances
For each selected class, create at least one object instance. Name them uniquely. Do not use generic names like “Object1”. Use names that reflect the data, such as cust1 or orderA.
Step 4: Define Attribute Values
Populate the bottom section of the object rectangles. Assign concrete values. If a class has a property status, the object might have status: "Pending". This is what makes the diagram an “Object” diagram.
Step 5: Draw Links Between Objects
Connect the objects based on the associations defined in your Class Diagram. Ensure the multiplicity is respected. If a Customer can have many Orders, draw multiple links or indicate the multiplicity clearly.
Step 6: Add Roles and Multiplicity
Label your links. Add the multiplicity at the end of the line. This ensures anyone reading the diagram knows the cardinality of the relationship.
Practical Example: An Online Store 🛒
Let us apply this to a concrete scenario. Imagine a simple e-commerce system. We want to visualize a single transaction.
Classes Involved:
UserShoppingCartOrderProduct
The Scenario: Alice logs in, adds a Laptop and a Mouse to her cart, and places an order.
Object Diagram Description:
- User Object: Name:
alice:User. Attributes:email: "[email protected]",id: 101. - Cart Object: Name:
cart1:ShoppingCart. Attributes:items: 2,total: 1500. - Order Object: Name:
ord55:Order. Attributes:date: "2023-10-25",status: "Shipped". - Product Objects:
laptop:Product(Price: 1000),mouse:Product(Price: 500).
Relationships:
- alice is linked to cart1.
- cart1 is linked to ord55.
- ord55 is linked to laptop and mouse.
When to Use Object Diagrams 📅
You do not need an Object Diagram for every project. Use them strategically when they add value.
- Database Schema Validation: Before writing SQL, use the diagram to check if the data relationships make sense.
- Complex Associations: When a Class Diagram becomes too cluttered with navigation paths, an Object Diagram can clarify a specific path.
- Testing Scenarios: Testers use these to understand the expected state of data during a test case.
- Legacy System Analysis: When reverse engineering code, Object Diagrams help map existing data states.
Best Practices for Clear Modeling 📝
Following conventions ensures your diagrams are readable by other developers and stakeholders.
1. Naming Conventions
Use a consistent naming style. A common convention is lowercase:ClassName. For example, user1:User. This immediately tells the reader that user1 is an instance of the User class.
2. Keep It Simple
Avoid cluttering the diagram with too many objects. If you have 50 orders, do not draw 50 rectangles. Draw a representative sample (e.g., 3 to 5) to illustrate the relationship.
3. Consistent Multiplicity
Ensure the multiplicity on the link matches the business rules. If a rule states “One Order has One Customer”, do not draw a many-to-many link.
4. Color and Shape
While we are not using CSS styles here, in a drawing tool, you might use colors to denote status. For example, red for errors, green for success. Keep this consistent across all diagrams.
5. Update Regularly
Object diagrams represent a snapshot. If the data changes, the diagram becomes outdated. Treat them as living documents within your documentation set.
Common Mistakes to Avoid ❌
Even experienced modelers make errors. Watch out for these common pitfalls.
- Confusing Class and Object: Do not write the class name without the colon or instance name. It must be clear which is which.
- Ignoring Null Values: If an attribute is optional and currently empty, represent that clearly. Do not leave it blank if it implies a value exists.
- Overusing Composition: Composition implies ownership. Do not use it for relationships where objects exist independently.
- Missing Links: If two objects interact, they must be linked. If you forget a link, the logic is broken.
- Too Much Detail: Do not list every single attribute if only a few are relevant to the scenario. Focus on the data that matters for the context.
Advanced Concepts: Dynamic Object Diagrams 🔄
Standard Object Diagrams are static. However, in some methodologies, you might look at a sequence of snapshots. This is similar to a state machine but focused on data.
This is useful for:
- Tracing data flow during a transaction.
- Visualizing the lifecycle of a specific entity.
- Debugging memory leaks or object persistence issues.
While this requires more effort, it provides deep insight into system behavior that a Class Diagram cannot show.
Integrating with Other UML Diagrams 🧠
An Object Diagram does not exist in isolation. It complements other diagrams in the UML suite.
With Class Diagrams
The Class Diagram defines the rules. The Object Diagram tests the rules. If your Object Diagram violates the constraints of the Class Diagram, you have a design error.
With Sequence Diagrams
A Sequence Diagram shows the flow of messages. The Object Diagram shows the participants in that flow. Using them together gives a complete picture of who is talking and what state they are in.
With Use Case Diagrams
A Use Case Diagram shows the functionality. The Object Diagram shows the data required to perform that functionality. This helps in requirement analysis.
Tools and Implementation 🖥️
You do not need expensive software to create these diagrams. Many free tools support UML notation. When selecting a tool, look for:
- Drag-and-Drop Interface: Ease of creating rectangles and links.
- Text Labels: Ability to edit attribute values easily.
- Export Options: Ability to save as PDF or PNG for documentation.
- Validation: Some tools can check if your diagram follows UML standards.
Remember, the tool is secondary. The clarity of your thinking is primary. A hand-drawn sketch is often better than a poorly made digital diagram.
Reviewing Your Diagrams 🔍
Before finalizing a diagram, perform a peer review. Ask these questions:
- Does it match the Class Diagram? Are the relationships consistent?
- Is the data realistic? Do the attribute values make sense for the scenario?
- Is it readable? Can a new developer understand the structure without explanation?
- Is it complete? Are all necessary objects and links present?
Summary of Key Takeaways 🎯
Object Diagrams are a vital part of system design. They bridge the gap between abstract design (Classes) and concrete reality (Data).
- Understand the Difference: Class is the type; Object is the instance.
- Focus on Snapshots: Capture the state at a specific moment.
- Follow Notation: Use the standard rectangle and link syntax.
- Validate Relationships: Ensure links match business rules.
- Keep it Simple: Avoid unnecessary complexity.
By mastering these diagrams, you improve your communication with developers and stakeholders. You reduce ambiguity and ensure the system is built on a solid foundation of clear data structures.