Debugging software is often compared to searching for a needle in a haystack. Developers spend countless hours tracing execution flows, inspecting variable states, and reading stack traces. While this process is necessary, it can become inefficient when the underlying data structures are complex. This is where object diagrams become invaluable. An object diagram provides a snapshot of the runtime state of a system at a specific moment in time. By visualizing instances and their relationships, you gain a clearer understanding of how data flows through your application.
When you move beyond abstract class definitions and look at concrete instances, you can identify issues that static analysis often misses. This guide explores how to leverage object diagrams to improve your debugging workflow. We will look at practical applications, common pitfalls, and the strategic benefits of incorporating these visual tools into your development routine. Let us dive into the mechanics of visualization and how it translates to tangible code quality improvements.
Understanding the Object Diagram 📊
An object diagram is a static view of a system. Unlike a class diagram, which describes the blueprint, an object diagram describes the actual living entities within the codebase at a specific point during execution. It is a subset of a snapshot diagram. In this context, rectangles represent objects, not classes. Lines connecting them represent associations, showing how these specific instances interact.
Key Differences from Class Diagrams
Confusion often arises between class diagrams and object diagrams. To debug effectively, you must distinguish between the two. A class diagram defines the potential structure. An object diagram defines the actual state. Consider the following comparison:
- Class Diagram: Defines a
Userclass with attributes likenameandemail. It shows the rules for what a User can be. - Object Diagram: Shows a specific instance
User: john_doewith attributesname: "John"andemail: "[email protected]". It shows what a User currently is.
When debugging, the class diagram tells you what should happen. The object diagram tells you what is happening. This distinction is critical when state anomalies occur.
Visualizing Runtime State
Runtime state is ephemeral. Variables change, objects are created and destroyed, and memory addresses shift. Capturing this state visually allows you to freeze time. When a bug manifests, the system is often in a specific, reproducible state. Drawing the object diagram for that moment allows you to see the configuration that led to the error.
For example, if a function returns null unexpectedly, a class diagram shows the method signature. An object diagram shows that the object referenced by the parameter is actually missing or disconnected from the parent node in the graph.
Integrating Object Diagrams into Your Debugging Workflow 🛠️
Integrating visual aids into a debugging session requires a shift in mindset. Instead of relying solely on the debugger stepping through lines, you pause to map the structure. This approach is particularly effective for complex data structures like trees, graphs, or linked lists.
Step 1: Identify the Failure Point
Before drawing, locate the exact line of code where the failure occurs. Does the error happen during initialization? During a data transfer? Or during a specific operation like sorting or filtering? Knowing the timing helps you determine which objects are relevant to the diagram.
Step 2: Isolate the Relevant Objects
You do not need to diagram the entire system. Focus on the cluster of objects surrounding the failure point. Identify the input objects, the processing objects, and the output objects. Draw the instances that are directly involved in the logic error.
- Input Objects: The data entering the function.
- Processing Objects: The controllers or managers handling the logic.
- Output Objects: The result or side effects generated.
Step 3: Map Relationships and Links
Draw lines between the objects to represent associations. Label the lines with the role names or attribute names that define the connection. Pay close attention to cardinality. Is it a one-to-one relationship? Is it a one-to-many collection? Misunderstanding the cardinality is a common source of bugs.
Step 4: Annotate Attribute Values
Inside the object boxes, list the current values of the attributes. This is the most crucial step. A class diagram might say status: int. An object diagram shows status: 5 or status: null. If a conditional logic check depends on this value being 5, and the diagram shows 3, you have found the discrepancy.
Common Scenarios Where Object Diagrams Shine ✨
There are specific types of bugs where visualizing objects provides a distinct advantage over stack traces. These scenarios involve memory management, state consistency, and structural integrity.
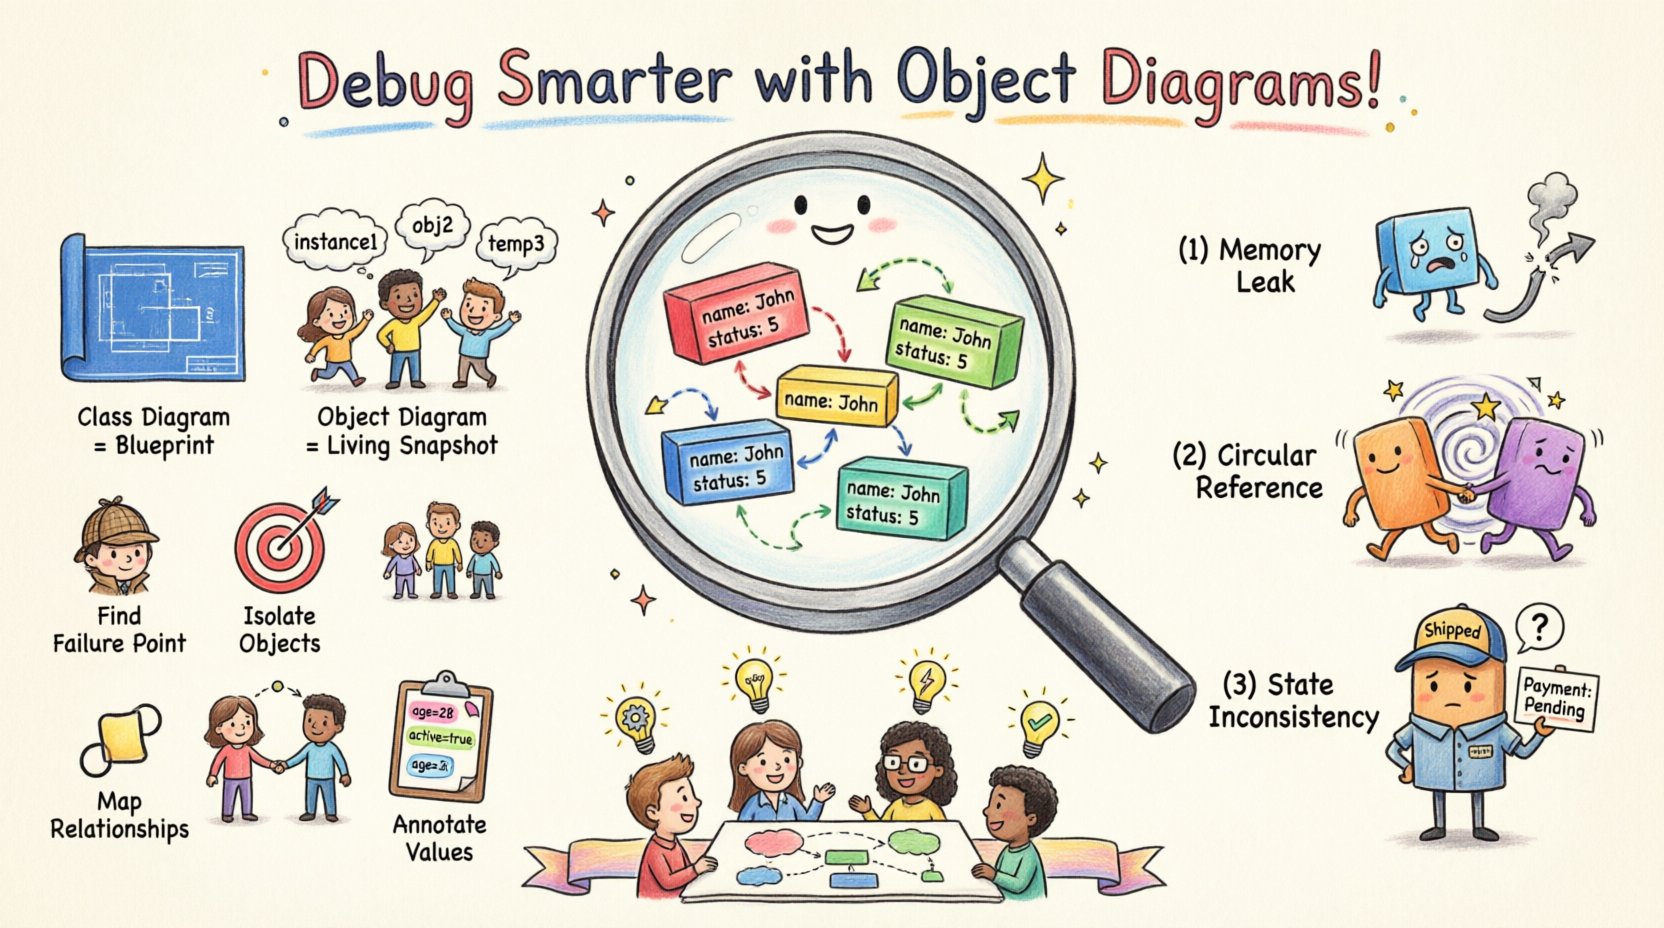
1. Memory Leaks and Orphaned Objects
A memory leak occurs when objects are allocated but never released. Often, this happens because a reference to the object is still held somewhere in the graph, preventing garbage collection. An object diagram helps trace these references.
- Visual Check: Look for objects that have no incoming arrows from active paths but still exist in memory.
- Root Cause: Sometimes a static collection holds onto an object indefinitely. The diagram reveals the holding pattern.
2. Circular References and Infinite Loops
Circular references occur when Object A references Object B, and Object B references Object A. While sometimes valid, they can cause stack overflows or serialization errors. Tracing these in code requires following pointers manually. In a diagram, they appear as a closed loop.
| Issue Type | Visual Indicator in Diagram | Debugging Action |
|---|---|---|
| Circular Reference | A closed loop between two or more nodes | Break the link or use weak references |
| Null Pointer Exception | A line ending abruptly without a target node | Validate the existence of the target before access |
| Missing State | An attribute box is empty or marked undefined |
Trace initialization logic of the parent object |
3. State Inconsistencies
State inconsistency happens when an object is in a state that contradicts its contract. For instance, an Order object might be in a Shipped state but still have a Payment status of Pending. A class diagram defines valid states. An object diagram shows the current violation.
By drawing the diagram, you can see the disconnect between the state of the parent object and its children. This is common in multi-threaded environments where race conditions alter state unpredictably.
Collaboration and Documentation Benefits 🤝
Debugging is rarely a solitary activity. You often need to explain the issue to a colleague, a manager, or a client. Describing a complex runtime state in text is difficult and prone to misinterpretation. An object diagram serves as a universal language.
Reducing Communication Overhead
Imagine trying to describe a nested JSON structure over a voice call. It is frustrating. A simple diagram conveys the hierarchy and relationships instantly. When you attach an object diagram to a bug report, the context is established immediately. This reduces back-and-forth clarification.
Legacy Code Maintenance
When working with legacy systems, documentation is often missing or outdated. Reconstructing the object diagram for a specific module helps you understand the current architecture. It acts as a reverse-engineering tool. You can map the existing objects to a conceptual model, revealing where the code has diverged from the original design.
- Map the Current State: Draw what exists today.
- Compare to Design: Overlay the intended design if available.
- Identify Drift: Highlight where the implementation has become convoluted.
Limitations and Best Practices ⚠️
While powerful, object diagrams are not a silver bullet. They have limitations that you must acknowledge to use them effectively. Over-reliance on manual diagramming can slow down development if not balanced with automated tools.
Limitations
- Static Snapshot: An object diagram captures a single moment. It does not show the history of how the object arrived at that state. You may need to combine it with a sequence diagram for temporal context.
- Manual Effort: Creating diagrams by hand takes time. For large systems, this is not feasible. It is best reserved for complex, isolated issues.
- Dynamic Changes: If the state changes rapidly (e.g., high-frequency trading), the diagram may become obsolete before you finish drawing it.
Best Practices for Efficiency
To maximize the value of object diagrams, follow these guidelines:
- Focus on the Bug: Do not diagram the whole application. Only the affected subsystem.
- Use Automation When Possible: Modern development environments offer features to export object states. Use these to generate the initial draft, then refine it manually.
- Keep it Clean: Avoid clutter. Use consistent naming conventions. If an attribute is irrelevant to the bug, omit it.
- Version Your Diagrams: If the bug is intermittent, save diagrams from different runs. This helps identify patterns.
Advanced Techniques for Deep Debugging 🔍
For senior developers, object diagrams can be extended to analyze deeper architectural issues. This involves looking at the lifecycle and ownership of objects.
Ownership and Scope Analysis
In many languages, object ownership is implicit. However, bugs arise when scope is misunderstood. An object diagram helps visualize scope boundaries. You can see if an object created in a local scope is being accessed from a global scope, which often leads to stale data errors.
Dependency Injection Visualization
Modern architectures rely heavily on dependency injection. This decouples components but can obscure where dependencies are coming from. An object diagram clarifies the wiring. You can trace exactly which instance of a service is injected into which class instance.
- Identify Singleton Issues: Are you accidentally creating multiple instances of a singleton?
- Check Injection Points: Ensure the correct factory is being used to create the dependencies.
Comparing Debugging Methods 📈
How does using an object diagram compare to traditional debugging methods? The table below outlines the trade-offs.
| Method | Best For | Time Required | Depth of Insight |
|---|---|---|---|
| Stack Trace | Logic errors, exceptions | Low | Linear flow only |
| Logging | Tracing execution paths | Medium | Sequential data |
| Object Diagram | Structural issues, state anomalies | High | Full structural context |
| Memory Profiler | Memory leaks, allocation | Medium | Resource usage |
Using an object diagram is not about replacing other methods but augmenting them. When a stack trace points to a line but the data looks wrong, the diagram explains why. When a profiler shows high memory usage, the diagram shows which objects are consuming it.
Practical Example: Fixing a Null Pointer Exception 🧩
Consider a scenario where an application crashes with a NullPointerException. The stack trace points to line 45, where a method is called on an object.
Traditional Approach: You set a breakpoint at line 45. You inspect the variable. It is null. You ask, “Why is it null?” You trace back to where it was assigned. It was assigned in a constructor. You trace the constructor call. It was called by a factory. The factory returned null. You check the factory logic. It returns null if a condition is met.
Object Diagram Approach: You draw the factory, the object it returns, and the object it is supposed to initialize. You label the factory as Factory: PaymentFactory. You label the result as Payment: null. You draw the condition line leading to the factory. You see that the condition variable isValid is false. You check the input data. The input data is malformed. The diagram reveals that the input data did not match the expected schema before it even reached the factory.
The diagram highlights the structural mismatch between the input and the expected object graph, rather than just the symptom of the null pointer.
Maintaining Diagram Accuracy 📝
A diagram that is out of date is worse than no diagram. To ensure accuracy, you must treat the diagram as a living document during the debugging session.
- Update in Real-Time: As you step through the code, update the attribute values on the diagram.
- Mark Changes: Use different colors to highlight objects that have changed state between steps.
- Review Assumptions: If the diagram shows something unexpected, question your assumption about how the code works. The diagram often reveals that the implementation differs from the design.
Conclusion on Visual Debugging 🎯
Debugging is fundamentally about understanding the relationship between code and data. Object diagrams bridge the gap between abstract logic and concrete reality. They force you to slow down and map the connections that your code makes implicitly. This visual discipline reduces cognitive load and exposes structural flaws that text-based debugging misses.
By incorporating object diagrams into your toolkit, you shift from reactive fixing to proactive analysis. You stop guessing where the data is and start seeing where it is. This clarity leads to faster resolution times and more robust code. Whether you are fixing a simple reference error or untangling a complex microservice architecture, the ability to visualize the runtime state is a powerful asset. Prioritize understanding the structure, and the logic will follow.
Remember, the goal is not to create perfect diagrams for every issue. The goal is to create enough clarity to solve the problem. Start small. Pick one recurring bug. Draw the object diagram for it. Observe how it changes your perspective. Over time, this practice will become a natural part of your development process, enhancing your ability to write and maintain high-quality software.
Adopting this method requires discipline, but the payoff in system reliability is significant. As you refine your skills, you will find that you spend less time chasing symptoms and more time addressing root causes. This is the essence of effective engineering: seeing the problem clearly before attempting to fix it.