


Business Process Model and Notation (BPMN) is the globally recognized standard for modeling business processes. It provides a visual language that enables organizations to design, analyze, document, and optimize workflows across departments, systems, and even across organizational boundaries. This comprehensive guide walks you through the core elements of BPMN, their meanings, and how to effectively use them—especially with Visual Paradigm, a powerful and intuitive BPMN 2.0 modeling tool.
1. Introduction to BPMN
BPMN is designed to be both business-friendly and technically precise. It bridges the gap between business stakeholders and IT professionals by offering a common visual language for describing business processes. Developed by the Object Management Group (OMG), BPMN 2.0 is the current standard, supporting rich semantics for process modeling, including events, activities, gateways, and connecting objects.
 with Visual Paradigm")
With tools like Visual Paradigm, creating professional BPMN diagrams has become faster, more collaborative, and more insightful—offering features such as process drill-down, simulation, animation, and integration with other modeling standards.
2. Core BPMN Elements
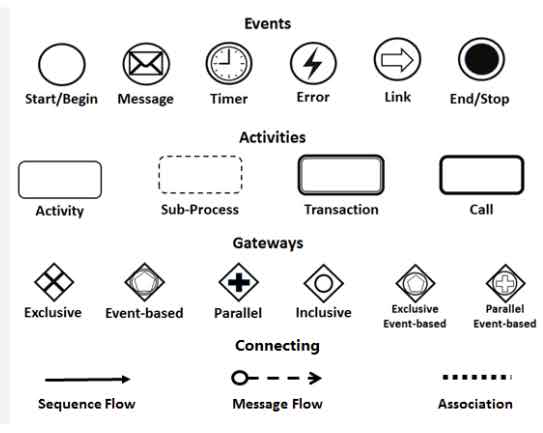
BPMN diagrams are built from four fundamental categories of elements:
-
Events
-
Activities
-
Gateways
-
Connecting Objects
These elements work together to define the what, when, how, and flow of a business process.
2.1 Events: Triggers and Outcomes
Events are represented by circles and signify something that happens during a process—either initiating, interrupting, or concluding it.
Types of Events:
| Symbol | Event Type | Description |
|---|---|---|
| 🟢 Empty Circle | Start/Begin Event | Marks the beginning of a process. Can be triggered by a message, timer, or other external input. |
| 📧 Circle with Envelope | Message Event | Indicates a message is sent or received between participants (e.g., customer order received). |
| ⏰ Circle with Clock | Timer Event | Triggers a process at a specific time or after a delay (e.g., “Send reminder after 3 days”). |
| ⚡ Circle with Lightning Bolt | Error Event | Indicates an error has occurred during execution. Used for exception handling. |
| 🔗 Circle with Rightward Arrow | Link Event | Connects different parts of a diagram (e.g., in large diagrams split across pages). |
| 🔴 Filled Circle | End/Stop Event | Marks the conclusion of a process. Can be normal (success) or error-based. |
✅ Tip: Use Intermediate Events (placed between activities) to capture time-based triggers, message exchanges, or error conditions without stopping the flow.
2.2 Activities: Units of Work
Activities represent the work performed in a process and are shown as rounded rectangles. They define what needs to be done.
Types of Activities:
| Symbol | Activity Type | Description |
|---|---|---|
| 🟦 Rounded Rectangle | Activity (Task) | A single, atomic unit of work (e.g., “Approve Invoice”). |
| 🟦 Dashed Border | Sub-Process | A compound activity that can be expanded into a detailed sub-diagram (e.g., “Process Loan Application” → detailed steps). |
| 🟦 Double Border | Transaction | A group of activities that must all succeed or fail together (e.g., financial transfer with rollback capability). |
| 🟦 Thick Border | Call Activity | Refers to a globally defined, reusable process or sub-process (e.g., “Authenticate User” from a shared library). |
✅ Best Practice: Use Sub-Processes to break down complex workflows for clarity. Use Call Activities to promote reuse and maintain consistency across multiple diagrams.
2.3 Gateways: Decision Points and Flow Control
Gateways are diamond-shaped symbols that control the flow of execution by determining branching, merging, or splitting paths.
Types of Gateways:
| Symbol | Gateway Type | Description |
|---|---|---|
| 🔴 Diamond with ‘X’ | Exclusive (XOR) | Only one outgoing path is taken based on a condition (e.g., “Is approval required?” → Yes/No). |
| 🔵 Diamond with Circle Inside | Event-Based | The path taken depends on which event occurs first (e.g., “Wait for Payment or Refund”). |
| 🟢 Diamond with ‘+’ | Parallel (AND) | All outgoing paths are executed simultaneously (e.g., “Send email and update database”). |
| 🟡 Diamond with ‘O’ | Inclusive (OR) | One or more paths can be taken (e.g., “Send notification to manager, team, or client”). |
⚠️ Note: Gateways must be connected with sequence flows and are critical for modeling decision logic, concurrency, and complex routing.
2.4 Connecting Objects: Defining Relationships
Connecting objects define how elements in the diagram relate to each other. They ensure the process flows logically from start to end.
Types of Connecting Objects:
| Symbol | Connection Type | Description |
|---|---|---|
| ➡️ Solid Arrow | Sequence Flow | Shows the order of execution between flow elements (events, activities, gateways). |
| ➤ Dashed Line (Open Circle → Arrow) | Message Flow | Represents communication between different participants (e.g., two pools in a collaboration diagram). |
| ⋮ Dotted Line | Association | Links artifacts (e.g., data objects, annotations) to flow elements. Does not affect execution order. |
✅ Pro Tip: Use Message Flows to model interactions between separate organizational units or systems (e.g., Customer → Sales Team → ERP System). Use Associations to add notes or attach documents to tasks.
3. Creating BPMN Diagrams with Visual Paradigm
Visual Paradigm is a leading BPMN 2.0 modeling tool that simplifies the creation of professional business process diagrams. Its intuitive interface and powerful features make it ideal for both beginners and advanced users.
Key Features of Visual Paradigm:
-
Drag-and-Drop Interface: Easily add events, activities, gateways, and connecting objects.
-
Professional Templates: Start with pre-built BPMN templates for common processes (e.g., Order Fulfillment, Employee Onboarding).
-
Process Drill-Down: Expand Sub-Processes into detailed diagrams for deeper analysis.
-
Simulation & Animation: Run simulations to test process logic and visualize execution paths.
-
Integration with Other Standards: Supports UML, ERD, and other modeling languages for enterprise-wide consistency.
-
Cloud Collaboration: Work in real time with team members using the online BPMN diagram tool.
4. Step-by-Step Guide to Drawing a BPMN Diagram
-
Define the Process Scope: Identify the start and end points (e.g., “Customer Order Process”).
-
Add a Start Event: Use a Start Event (empty circle) to mark the beginning.
-
Add Activities: Insert Rounded Rectangles for each task (e.g., “Receive Order,” “Check Inventory”).
-
Insert Gateways: Use Exclusive Gateways to model decisions (e.g., “Is stock available?”).
-
Connect with Sequence Flows: Draw solid arrows to define execution order.
-
Add End Event: Use a Filled Circle to close the process.
-
Enhance with Artifacts: Use Associations to link notes, data objects, or documents.
-
Simulate & Validate: Use Visual Paradigm’s simulation feature to test different scenarios.
📌 Example: A simple Order Processing Workflow:
Start → Receive Order → Check Inventory → (If Yes) → Ship Order → End
(If No) → Notify Supplier → Wait for Stock → Continue
5. Benefits of Using BPMN and Visual Paradigm
| Benefit | Explanation |
|---|---|
| Clarity & Communication | BPMN diagrams are easy to understand for both business and technical teams. |
| Process Optimization | Visualizing workflows helps identify bottlenecks and redundancies. |
| Standardization | BPMN ensures consistency across departments and organizations. |
| Automation Readiness | BPMN models can be directly used to generate code or configure workflow engines. |
| Collaboration & Documentation | Visual Paradigm supports version control, sharing, and documentation export. |
6. Learning Resources: Getting Started with BPMN in Visual Paradigm
To master BPMN modeling with Visual Paradigm, explore these official resources:
- Introduction to BPMN Part I – Visual Paradigm
A foundational tutorial introducing BPMN concepts and providing step-by-step guidance on creating and drawing BPMN diagrams. - How to Draw BPMN Diagram? – Visual Paradigm
A practical, step-by-step tutorial demonstrating how to create business process diagrams using Visual Paradigm’s user-friendly interface. - How to Create BPMN Diagram? – Visual Paradigm
An instructional guide explaining BPMN basics and the process of building workflow diagrams with Visual Paradigm’s dedicated software. - BPMN Notation Overview – Visual Paradigm
A comprehensive guide to BPMN symbols, notations, and real-world diagram examples. - What is BPMN? – Visual Paradigm
An explanatory overview of BPMN as a standard notation for business workflows, detailing its history, benefits, and modeling capabilities. - Business Process Design with Powerful BPMN Software – Visual Paradigm
An in-depth look at how Visual Paradigm’s BPMN 2.0 modeler enables fast, professional process modeling with simulation, animation, and integration features. - Online BPMN Diagram Tool – Visual Paradigm
A guide to Visual Paradigm’s cloud-based BPMN tool, emphasizing ease of use, collaboration, and accessibility from any device.
7. Conclusion
BPMN is more than just a diagramming tool—it’s a strategic asset for business process improvement. With the right tool like Visual Paradigm, organizations can model, analyze, simulate, and optimize their workflows with precision and collaboration.
Whether you’re a business analyst, process manager, or IT developer, mastering BPMN and leveraging powerful tools like Visual Paradigm will empower you to design efficient, transparent, and scalable business processes.
🔗 Start Your BPMN Journey Today:
Explore the full suite of Visual Paradigm’s BPMN features at https://www.visual-paradigm.com