


Strategic planning is a cornerstone of business education. Whether you are studying economics, marketing, or management, understanding the external environment is crucial for success. One of the most effective tools for this is the PEST analysis. This framework helps you identify key factors influencing an organization or project. For students, mastering this tool means better grades, clearer project scopes, and a deeper understanding of market dynamics.
This guide provides a comprehensive breakdown of the PEST analysis template. We will explore how to construct one, what each letter represents, and how to apply it to academic assignments without relying on specific software. You will learn to gather data, categorize risks, and present findings logically.
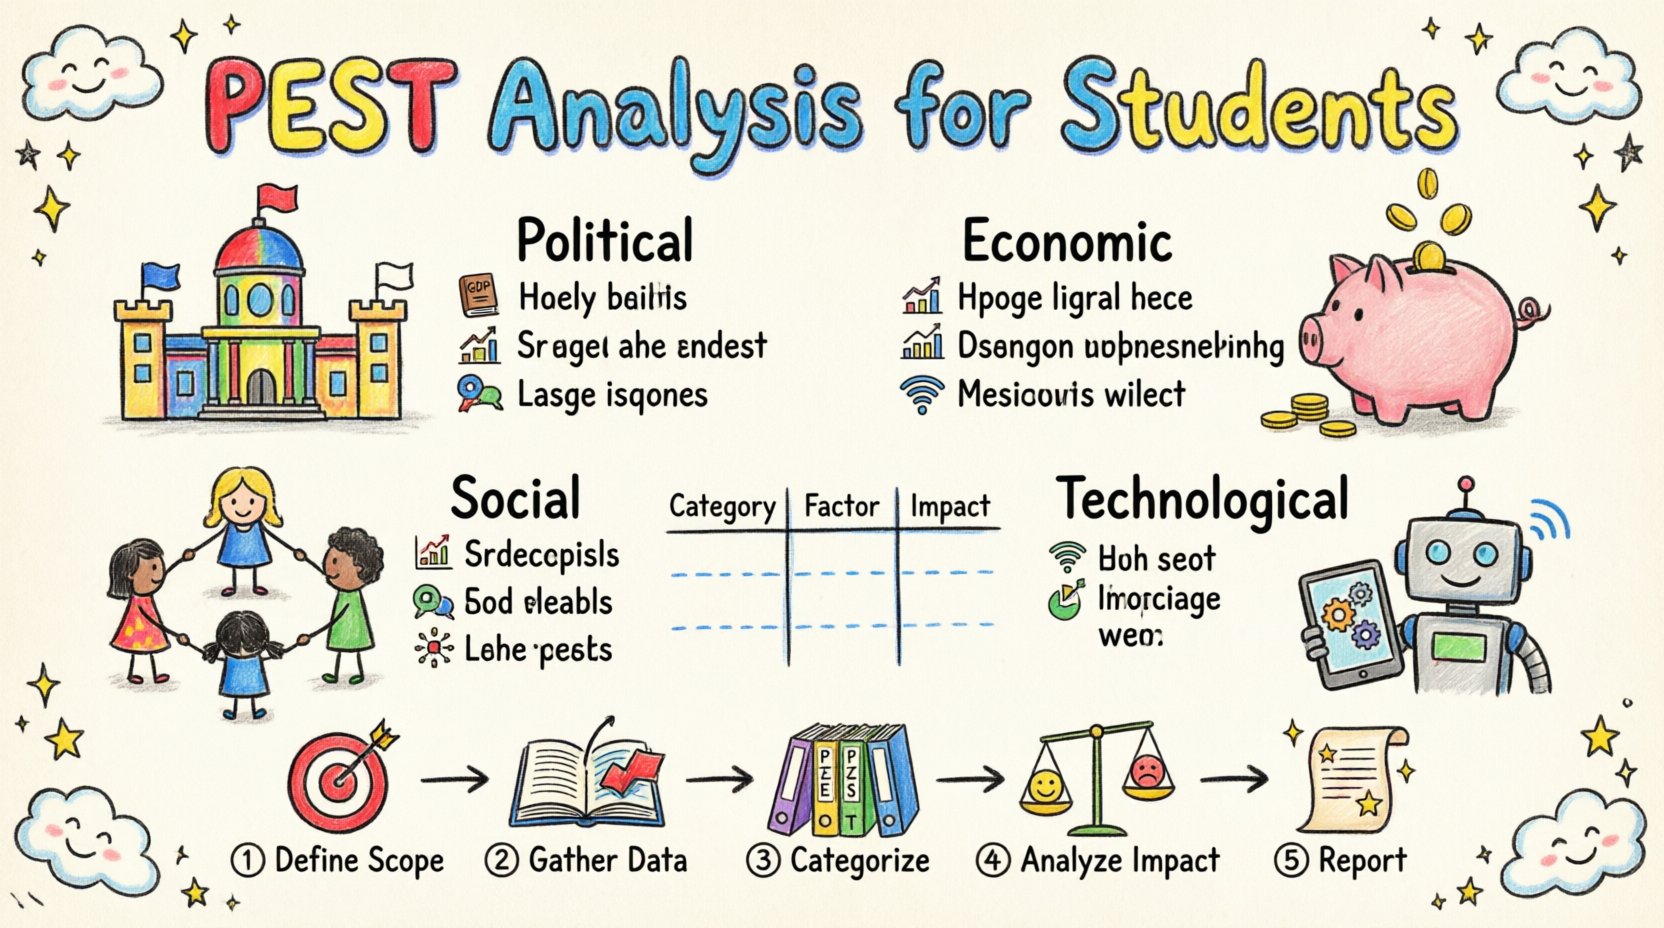
🔍 Understanding the PEST Framework
PEST stands for Political, Economic, Social, and Technological. It is an environmental scanning tool used to understand macro-environmental factors. Unlike internal analysis tools that look at strengths and weaknesses, PEST focuses on external forces that are beyond your direct control.
- Why it matters: It prevents you from making decisions based on internal desires alone.
- Why students need it: Case studies and business plans often require an external audit.
- How it works: You list factors under each category and assess their impact.
Using a structured template ensures you do not miss critical data points. It organizes your thoughts and provides a clear visual for your professors or peers.
🏛️ Breaking Down Each Component
Each letter in PEST represents a specific domain of the external environment. To create a robust analysis, you must investigate each area thoroughly. Below is a detailed look at what to consider for each section.
1. Political Factors 🏛️
Political factors relate to government intervention and stability. These are often the most volatile elements in a business environment. When analyzing this for a student project, consider the following:
- Government Policy: Are there new laws regarding taxes, trade, or labor?
- Political Stability: Is the region safe for investment or operation?
- Trade Restrictions: Are there tariffs or quotas affecting international supply chains?
- Regulatory Environment: How strict are health and safety regulations?
Example: If you are analyzing a coffee shop chain, political factors might include minimum wage laws or zoning permits for new storefronts.
2. Economic Factors 💰
Economic factors dictate the purchasing power of consumers and the financial health of the market. These are critical for forecasting revenue and costs.
- Inflation Rates: How does rising cost of living affect consumer spending?
- Exchange Rates: Does currency fluctuation impact import costs?
- Interest Rates: How do loan costs affect expansion or student debt?
- GDP Growth: Is the economy expanding or contracting?
- Unemployment Rates: High unemployment might lower wages but increase availability of labor.
Example: In an economic downturn, luxury goods companies might see a drop in demand, while discount retailers might see growth.
3. Social Factors 👥
Social factors look at the cultural aspects of the market. This includes demographics, lifestyle trends, and social attitudes. These factors change slowly but have long-term impacts.
- Demographics: Age distribution, population growth, and income distribution.
- Health Consciousness: Is the population more focused on fitness or wellness?
- Work-Life Balance: How do people prioritize leisure over work?
- Education Levels: Does the workforce have the skills required for modern jobs?
- Consumer Attitudes: Are people more ethical or environmentally conscious?
Example: A rise in remote work trends (Social factor) increases the need for home office furniture and software.
4. Technological Factors 📱
Technological factors involve innovation, automation, and the rate of technological change. This is often the fastest-moving category in the modern era.
- R&D Activity: What new technologies are being developed?
- Automation: Is manual labor being replaced by machines?
- Internet Infrastructure: How accessible is high-speed connectivity?
- Data Security: How are privacy laws and cyber threats evolving?
- Obsolescence: How quickly does current tech become outdated?
Example: The shift to mobile payments (Technological factor) forces traditional banks to update their apps.
📝 Step-by-Step Guide to Conducting a PEST Analysis
Creating a PEST analysis is a logical process. You do not need complex software to do this effectively. Follow these steps to build your analysis from scratch.
Step 1: Define the Scope 🎯
Before listing factors, determine what you are analyzing. Is it a specific industry? A new product launch? A local business? A specific country’s market?
- Set clear boundaries for your project.
- Identify the time horizon (e.g., the next 1 to 5 years).
- Decide the level of detail required for your assignment.
Step 2: Gather Data 📚
Reliable data is the backbone of a good analysis. Use academic journals, government reports, and reputable news sources.
- Search for government economic reports for Economic factors.
- Look for legislative updates for Political factors.
- Read sociological studies for Social factors.
- Check tech blogs and industry whitepapers for Technological factors.
Step 3: Categorize Findings 🗂️
Place your gathered information into the four categories. Avoid overlap. For instance, if a new law is about technology, decide if it is Political (regulation) or Technological (innovation).
- Keep lists concise.
- Focus on the most relevant factors.
- Discard information that does not impact the specific scope.
Step 4: Analyze Impact ⚖️
Simply listing factors is not enough. You must explain why they matter. Assess the impact on the business or project.
- Is the impact positive or negative?
- Is it immediate or long-term?
- How significant is the influence?
Step 5: Synthesize and Report 📄
Combine your findings into a cohesive document. Use a table for clarity. Write a summary that connects the dots between the different factors. Ensure your recommendations are based on the analysis.
📋 PEST Analysis Template Structure
A well-structured template makes your work easier to read. Below is a layout you can adapt for your documents. Use a table format to organize the data effectively.
| Category | Key Factor | Description | Impact (High/Med/Low) | Implication for Strategy |
|---|---|---|---|---|
| Political | New Tax Regulations | Introduction of higher corporate tax rates in 2024. | High | Reduce profit margins; focus on cost efficiency. |
| Economic | Inflation Spike | Consumer prices rising by 5% annually. | Medium | Adjust pricing strategy; offer value packs. |
| Social | Remote Work Trend | 60% of workforce prefers hybrid models. | High | Invest in digital collaboration tools. |
| Technological | AI Advancement | Automation tools becoming affordable for SMEs. | Medium | Explore AI integration to lower labor costs. |
When creating your own template, ensure the columns match the depth of analysis required by your instructor. Some assignments may require only the first three columns, while others demand a full strategic implication.
⚠️ Common Mistakes to Avoid
Students often struggle with the PEST framework not because it is difficult, but because of common errors in execution. Be mindful of these pitfalls.
- Being Too Vague: Do not write “Economy is bad.” Write “Inflation has increased by 3% due to supply chain issues.” Specificity adds credibility.
- Ignoring the Future: PEST is about looking forward. Do not just list current events; predict trends.
- Confusing PEST with SWOT: PEST is external. SWOT includes internal strengths and weaknesses. Do not mix them in the same category.
- Overloading Information: List only the top 3-5 factors per category. Too much data dilutes the key insights.
- Lack of Sources: Always cite where you found your data. Academic integrity is paramount.
🎓 Integrating PEST into Academic Projects
How can you use this in your coursework? The application varies by assignment type.
For Case Studies
When analyzing a real company, use PEST to explain why they succeeded or failed. Did they ignore a technological shift? Did they fail to adapt to social changes? Use the analysis to support your arguments.
For Business Plans
Investors want to know you understand the risks. Include a PEST section in your business plan to show you have identified external threats and opportunities.
For Group Projects
Assign different categories to different team members. One person handles Political and Economic, another handles Social and Technological. This ensures comprehensive research and balances the workload.
🌍 Real-World Application Examples
Seeing the framework in action helps solidify understanding. Here are brief examples of how different industries apply PEST.
Automotive Industry 🚗
- Political: Emission standards and carbon tax.
- Economic: Cost of raw materials like lithium for batteries.
- Social: Shift towards sustainable living and car-sharing.
- Technological: Development of autonomous driving software.
Healthcare Sector 🏥
- Political: Changes in healthcare legislation and insurance coverage.
- Economic: Funding cuts or increases in public health budgets.
- Social: Aging population increasing demand for care.
- Technological: Telemedicine and electronic health records.
Retail Industry 🛍️
- Political: Import tariffs on clothing.
- Economic: Disposable income levels of customers.
- Social: Preference for online shopping over in-store.
- Technological: Mobile payment systems and inventory AI.
❓ Frequently Asked Questions
Students often have questions when applying this framework. Here are answers to common queries.
1. How often should I update a PEST Analysis?
For academic purposes, update it when the environment changes significantly. In the real world, companies review this annually or quarterly.
2. Is PEST the same as PESTLE?
PESTLE adds Legal and Environmental factors. PEST is the base version. If your assignment requires PESTLE, simply add those two sections to the template.
3. Can I use PEST for personal career planning?
Absolutely. You can analyze the job market using these factors. Political stability affects hiring, Economic conditions affect salaries, Social trends affect skill demand, and Technological changes affect job roles.
4. What is the difference between PEST and SWOT?
SWOT looks inside the organization (Strengths, Weaknesses) and outside (Opportunities, Threats). PEST looks strictly at the outside environment. Use PEST to inform the “Opportunities and Threats” section of a SWOT analysis.
5. Do I need to use software to make the template?
No. A word processor or a simple spreadsheet works fine. The focus is on the content and analysis, not the tool used to create the document.
📌 Final Thoughts
Conducting a PEST analysis is a valuable skill for any student. It teaches you to look beyond the immediate and consider the broader context. By following this step-by-step framework, you can produce high-quality analysis that demonstrates critical thinking and strategic awareness.
Remember to keep your data current, your sources reliable, and your focus on impact. With practice, this tool will become second nature in your academic and professional journey. Start applying this template to your next project to see the difference it makes.