


In the landscape of software architecture, clarity is everything. When developers and stakeholders discuss a system, they often rely on static blueprints to visualize how data behaves at a specific moment in time. This is where the Object Diagram becomes an essential tool. It serves as a snapshot of the system, capturing the state of objects and their relationships during execution. Unlike other diagrams that describe potential structures, this diagram reveals reality in motion.
This guide provides a deep dive into the mechanics, syntax, and practical applications of object modeling. Whether you are a student learning UML notation or a professional refining system specifications, understanding this concept is vital for accurate documentation.
Understanding the Core Concept 🔍
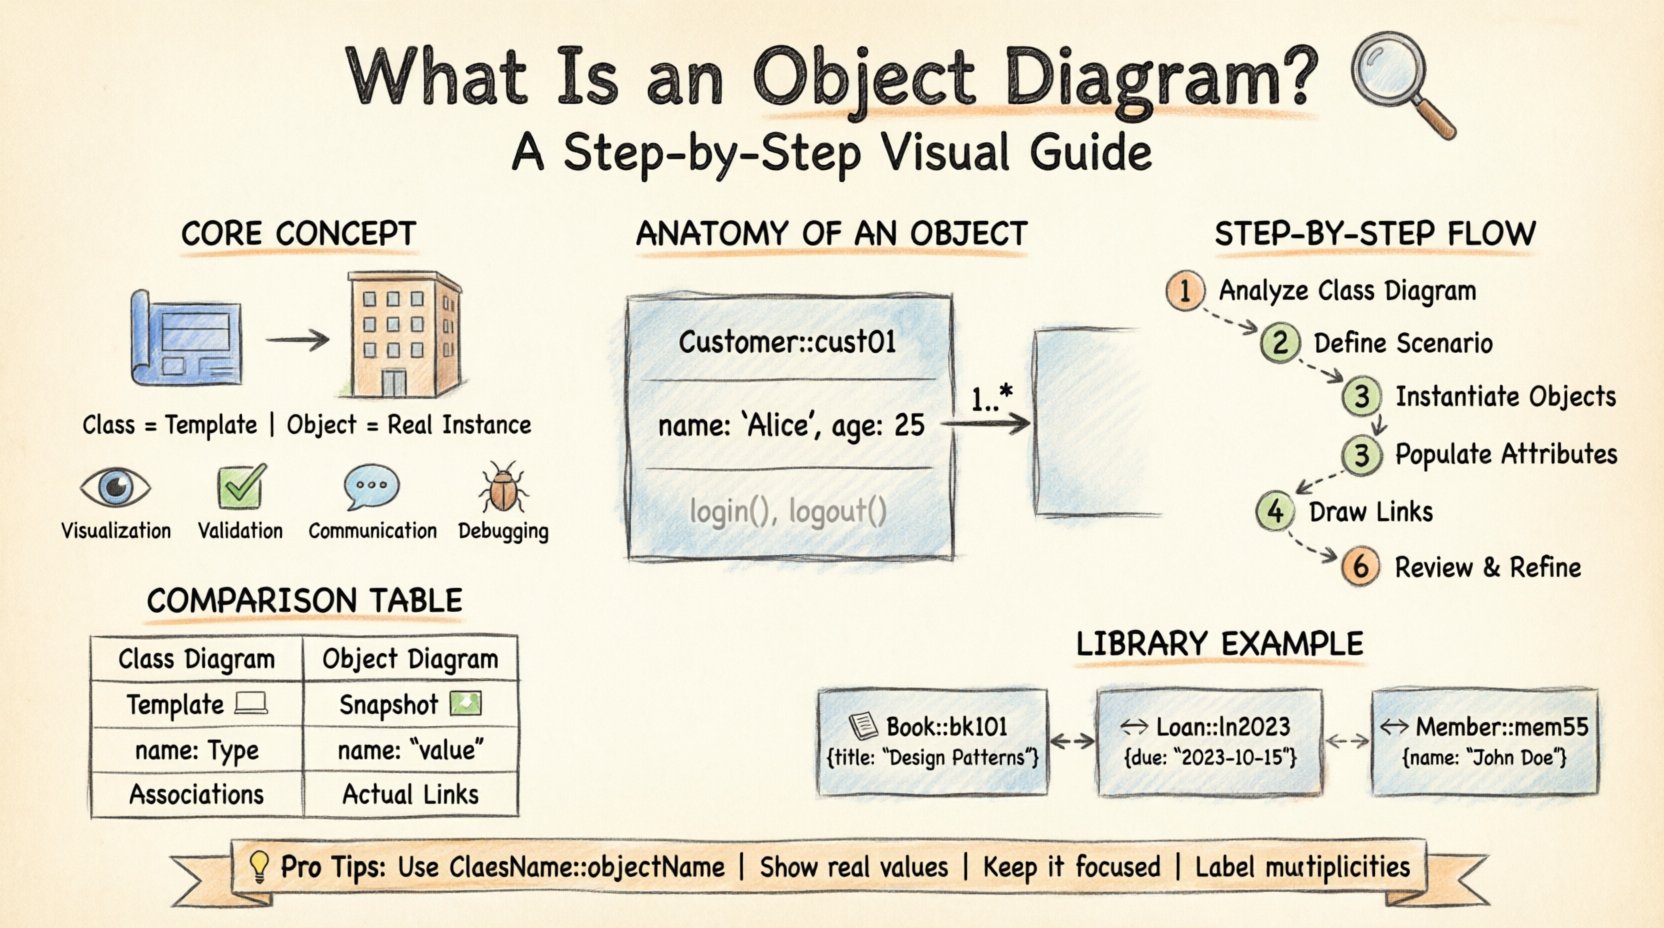
An Object Diagram is a type of diagram used in the Unified Modeling Language (UML). It illustrates a specific snapshot of instances within a system. While a Class Diagram describes the template or the blueprint of a system, an Object Diagram describes the actual items built from that blueprint.
Why Use an Object Diagram?
- Visualization of Data: It shows what the data looks like in a real scenario, not just what it could look like.
- Validation: It helps validate that the class structure supports the required data states.
- Communication: It provides a concrete example for non-technical stakeholders to understand data relationships.
- Debugging: It assists in tracing errors by showing the state of objects when a failure occurs.
Anatomy of an Object Diagram 🏗️
To draw an effective diagram, one must understand its components. Every element serves a specific purpose in defining the system’s state.
1. Objects
An object is an instance of a class. In the diagram, it is represented by a rectangle divided into three compartments:
- Top Compartment: Contains the object name. This typically follows the format
ClassName::objectName. For example,Customer::cust01. - Middle Compartment: Lists the attributes and their current values. This distinguishes it from a Class Diagram, where only attribute types are shown.
- Bottom Compartment: Lists the operations or methods available to the object, though this is less common in static snapshots.
2. Links (Relationships)
Links represent the connections between objects. They show how one object relates to another at a specific point in time. A link is a physical instance of an association defined in the Class Diagram.
- Directionality: Arrows indicate navigation or dependency.
- Multiplicity: Labels on the link show how many objects are connected (e.g., 1, 0..1, *).
- Role Names: The name given to the link from the perspective of the connected object.
3. Attribute Values
In a Class Diagram, an attribute is defined as name: type. In an Object Diagram, it is defined as name: value. This is the critical difference. If a class has an attribute age: Integer, the object instance will show age: 25.
Step-by-Step: Creating an Object Diagram 📝
Creating a robust diagram requires a systematic approach. Follow these steps to ensure accuracy and consistency.
Step 1: Analyze the Class Diagram
Begin with the existing Class Diagram. This serves as the source of truth for available classes and their relationships. Identify the classes that will be instantiated in your scenario.
Step 2: Define the Scenario
Establish the context. What is happening in the system? Is it a user login? A transaction processing? The scenario dictates which objects exist and how they interact.
Step 3: Instantiate Objects
Create rectangles for each object involved. Use the naming convention ClassName::objectName. Assign unique identifiers to avoid confusion.
Step 4: Populate Attributes
Fill in the attribute compartments. Instead of data types, enter actual values relevant to the scenario. Ensure data types match the underlying class definitions.
Step 5: Draw Links
Connect the objects using lines. These lines represent associations. Ensure the multiplicity on the links matches the constraints defined in the class model.
Step 6: Review and Refine
Check for consistency. Do the links match the cardinality? Are all attributes filled? Is the notation standard? Clean up the layout to ensure readability.
Object Diagram vs. Class Diagram 📊
Confusion often arises between these two diagram types. While both belong to the structural family, they serve different purposes. The table below clarifies the distinctions.
| Feature | Class Diagram | Object Diagram |
|---|---|---|
| Focus | Static structure and template | Dynamic state at a specific time |
| Content | Classes, Interfaces, Operations | Instances, Objects, Attribute Values |
| Notation | ClassName |
ClassName::objectName |
| Attributes | Defined as type |
Defined as value |
| Relationships | Associations (Potential) | Links (Actual) |
| Lifetime | Permanent (until system redesign) | Temporary (exists during runtime) |
Practical Example: A Library System 🏛️
To visualize the theory, let us examine a simple Library Management scenario. This example demonstrates how abstract classes become concrete objects.
The Classes
- Book: Contains title, ISBN, and author.
- Member: Contains memberID, name, and address.
- Loan: Connects Book and Member, containing dateDue.
The Objects
Imagine a snapshot where Member John Doe has borrowed a specific book.
- Book Object:
- Name:
Book::bk101 - Title:
"Design Patterns" - Author:
"Gang of Four" - Member Object:
- Name:
Member::mem55 - Name:
"John Doe" - Status:
"Active" - Loan Object:
- Name:
Loan::ln2023 - DateBorrowed:
"2023-10-01" - DateDue:
"2023-10-15"
The Relationships
In this diagram, the Book::bk101 is linked to Loan::ln2023, which is linked to Member::mem55. This chain represents the physical reality of the transaction, not just the possibility of one.
Common Mistakes to Avoid ❌
Even experienced modelers can make errors. Awareness of common pitfalls ensures your diagrams remain accurate and useful.
- Using Class Names for Objects: Never label an object simply as
Customer. It must beCustomer::cust001. - Ignoring Attribute Values: Leaving the middle compartment blank defeats the purpose of showing state.
- Overcomplicating: Do not include every possible object in the system. Focus on the relevant subset for the scenario.
- Inconsistent Notation: Ensure line styles and arrowheads are uniform throughout the document.
- Missing Multiplicity: Always label the ends of links to clarify how many instances can participate.
Advanced Scenarios and Use Cases 🎯
Object diagrams are not limited to simple examples. They scale to complex systems where state management is critical.
1. Database Snapshots
When analyzing a database dump, an object diagram can represent the rows in tables as objects and the foreign keys as links. This helps in understanding data integrity without writing SQL queries.
2. Serialization and Deserialization
In systems that save state to disk, object diagrams model the serialized form. This ensures that when the system restarts, the objects are reconstructed with their correct attributes.
3. Distributed Systems
In microservices, an object diagram can show how instances of a service communicate with instances of another service across a network. It highlights the physical connections.
4. Legacy System Analysis
When reverse-engineering code, object diagrams help map the existing runtime behavior. This is crucial when class documentation is missing or outdated.
Best Practices for Documentation ✅
To maintain high standards in your modeling efforts, adhere to these guidelines.
1. Consistency is Key
Ensure that the naming conventions used in your Object Diagrams match those in your Class Diagrams and your codebase. This reduces cognitive load for anyone reading the documentation.
2. Keep It Current
Object diagrams represent a moment in time. As the system evolves, the diagram may become obsolete. Update them whenever significant changes occur in data flow.
3. Use White Space
Layout matters. Avoid crossing lines where possible. Use white space to group related objects. A cluttered diagram is hard to read and prone to errors.
4. Focus on Relevance
Do not include objects that are not part of the immediate problem being discussed. Selectivity improves clarity.
5. Document Constraints
If there are specific business rules governing the object relationships, note them in the diagram text or as tags. This adds context to the visual representation.
The Role of Object Diagrams in Agile 🚀
In modern development environments, documentation often takes a backseat to code. However, object diagrams still hold value in Agile teams.
- Backlog Grooming: They help clarify the data requirements for user stories.
- Refactoring: They assist in understanding the impact of changing class structures on current data states.
- Onboarding: New team members can use them to understand how data flows through the system quickly.
Conclusion
Mastering the Object Diagram is about precision. It requires a shift in thinking from the potential to the actual. By capturing the state of instances, these diagrams bridge the gap between abstract design and concrete reality.
When you draw an Object Diagram, you are telling a story about your system’s data. You are showing what exists, how it connects, and what values it holds. This level of detail is indispensable for maintaining complex software systems. With the right tools and a disciplined approach, you can create diagrams that serve as a reliable reference for development, testing, and maintenance.
Remember, the goal is clarity. If the diagram can be understood by a developer, a tester, or a business analyst without explanation, it has succeeded. Use these guidelines to build your next diagram with confidence and accuracy.