


Creating effective diagrams is a critical skill for any technical professional. Among the various modeling techniques available, the object diagram stands out for its ability to depict a snapshot of a system at a specific moment in time. While class diagrams provide the blueprint, object diagrams illustrate the actual data structures in use. This guide explores the strategies that distinguish high-quality modeling from basic sketches. By understanding the nuances of instance management, relationship mapping, and documentation standards, you can produce artifacts that truly add value to your development lifecycle.
Many teams treat object diagrams as optional extras. Experts know better. They use these diagrams to validate complex logic, communicate state to stakeholders, and serve as a reference for debugging. This article delves into the specific practices that elevate your modeling work. We will cover everything from notation standards to the timing of when these diagrams should be created. Let us begin by establishing the fundamental differences between static structure and dynamic instances.
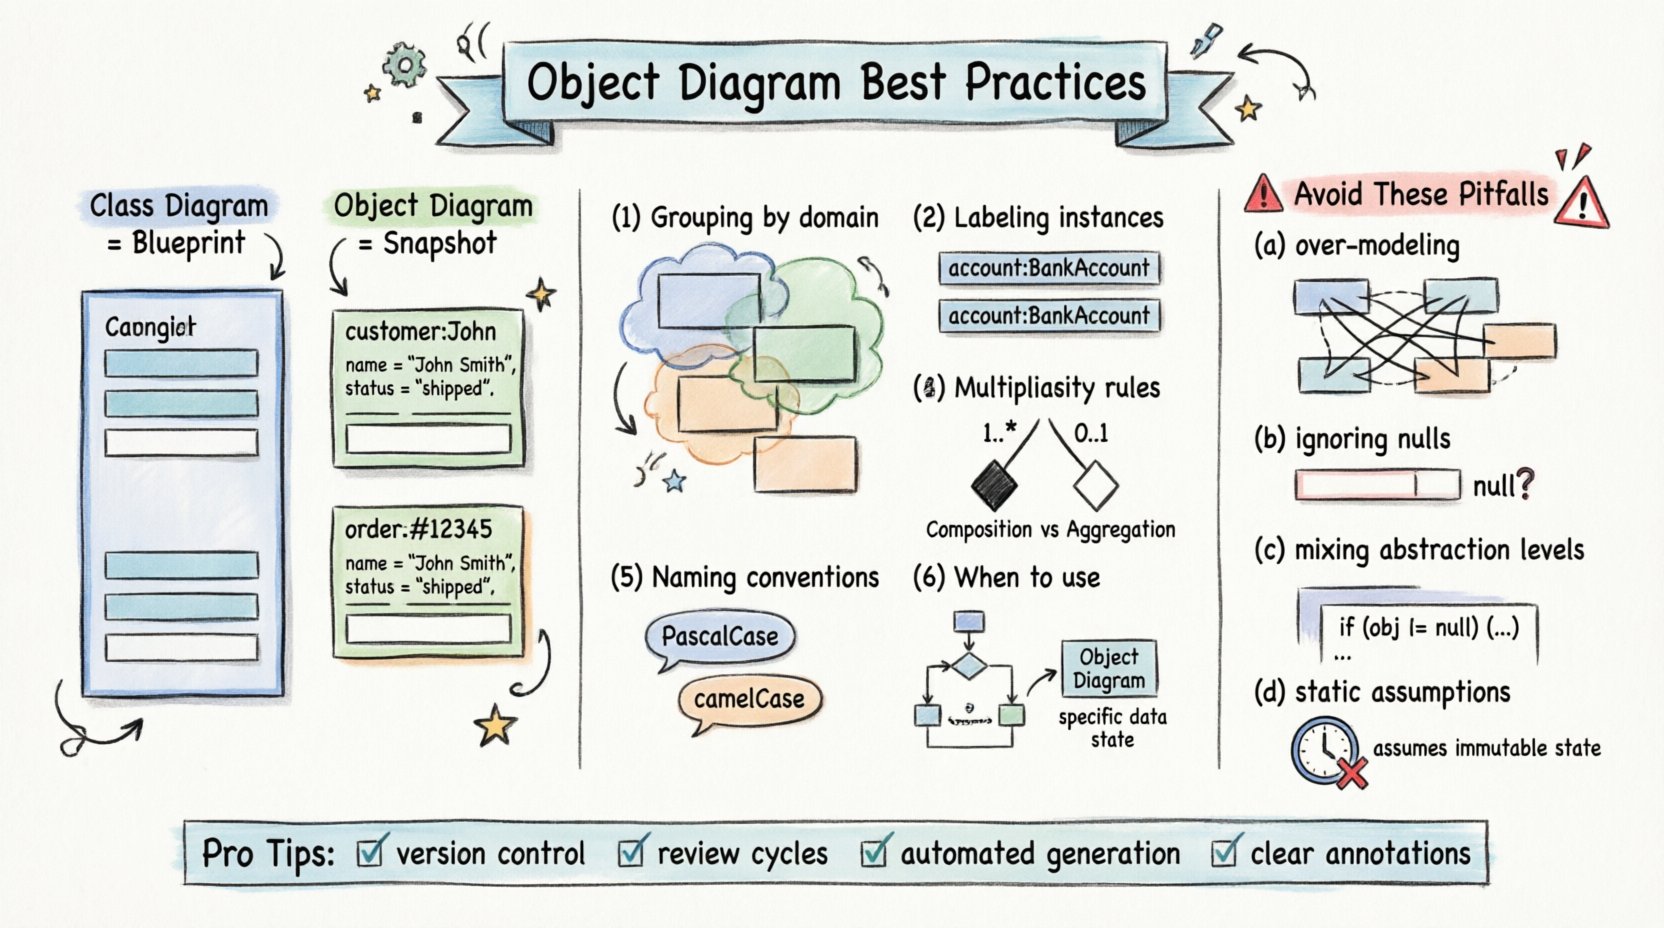
Understanding the Core Distinction Between Objects and Classes ⚖️
Before applying best practices, it is essential to grasp the fundamental concept. A class defines a type, specifying attributes and operations. An object is an instance of that class, holding actual data values. When you create an object diagram, you are not drawing the potential; you are drawing the reality.
- Class Diagrams: Represent the design phase. They show the type of data (e.g.,
Customer,Order). - Object Diagrams: Represent the runtime phase. They show the instance of data (e.g.,
customer: John Doe,order: #12345).
This distinction is the cornerstone of all subsequent best practices. If you confuse the two, your diagram loses its utility. Experts ensure that every box in the diagram represents a specific instance, not a generic category. This clarity helps stakeholders understand exactly what data exists in the system at a given point.
Consider the following scenario: A banking application. A class diagram would show a BankAccount with attributes like balance and accountNumber. An object diagram would show a specific account, perhaps acc: 555-1234 with a balance of 5000. The second representation provides immediate insight into the state of the system, which is crucial for testing and debugging.
Structuring Your Diagram for Clarity and Readability 🧭
Visual hierarchy matters. A cluttered diagram is as useless as a blank one. Experts prioritize layout and grouping to reduce cognitive load. They do not simply scatter boxes across the canvas. Instead, they organize instances into logical clusters that reflect the domain context.
Grouping by Domain or Module
When a system is complex, object diagrams can become overwhelming. To mitigate this, group related instances together. If you are modeling an e-commerce checkout process, keep the Cart, CartItem, and Payment instances visually close to one another. This proximity implies a logical relationship without needing excessive connecting lines.
Labeling Instances Correctly
Standard notation requires the instance name to be underlined or preceded by a colon. Experts follow this rigorously. A label like order: #9999 is far superior to just order. It distinguishes the instance from the class type immediately.
Here is a checklist for layout organization:
- Consistent Spacing: Maintain equal distance between unrelated instances.
- Logical Flow: Arrange diagrams to flow from left to right or top to bottom, mimicking a data process.
- Minimal Crossing: Minimize lines that cross each other. This reduces visual noise.
- Focus Areas: Highlight the specific area of interest. If you are documenting a bug, focus only on the objects involved in that error state.
Mastering Multiplicity and Role Names 🏷️
Relationships are the lifelines of an object diagram. They show how instances connect. However, experts go beyond simple lines. They meticulously define multiplicity and role names to convey precise business rules.
Multiplicity indicates how many instances of one class can relate to another. In a class diagram, this is often defined once. In an object diagram, it must hold true for the specific instances shown. If you draw a relationship line, you must ensure the number of connections matches the multiplicity constraint.
Role names define the context of the relationship. For example, in a relationship between a Manager and a Employee, the role on the Manager side might be supervisor, and the role on the Employee side might be subordinate. Including these names adds semantic meaning that generic association lines lack.
Key Considerations for Relationships
- One-to-One: Ensure there is exactly one link. Do not draw multiple lines to the same target unless it represents a different relationship type.
- One-to-Many: Show the specific number of instances involved. If the constraint is 1..*, show at least two instances if you want to demonstrate the “many” side.
- Zero-to-Many: Explicitly show an instance that has no relationship to demonstrate the “zero” possibility.
- Navigation: Indicate the direction of access. Not all relationships are bidirectional. Use arrows to show where the data flows or where the reference is stored.
Handling Complex Relationships and Associations 🔗
Real-world systems are rarely simple. Experts encounter scenarios where multiple objects interact simultaneously. Aggregations, compositions, and dependencies require careful handling to avoid ambiguity.
Composition vs. Aggregation
These relationships define ownership. Composition implies a strong lifecycle dependency. If the parent object is destroyed, the child object ceases to exist. Aggregation implies a weaker link. The child can exist independently.
In an object diagram, you represent this visually. However, the text description is equally important. Experts annotate complex associations with brief notes explaining the lifecycle rules. This prevents developers from assuming independence where none exists.
Linking Instances Across Boundaries
When modeling distributed systems, objects may reside in different environments. Experts use dashed lines or specific notation to denote links that cross system boundaries. This distinction helps in understanding network latency and data synchronization requirements. It also aids in identifying where data consistency might be an issue.
Consistency in Naming Conventions 📝
Naming is the first step in communication. Inconsistent naming leads to confusion. Experts adhere to strict naming conventions for both classes and instances. This consistency ensures that anyone reading the diagram can map it back to the codebase without hesitation.
Common conventions include:
- Class Names: Use PascalCase (e.g.,
CustomerOrder). - Instance Names: Use camelCase or lowercase with a prefix (e.g.,
cust: Johnororder1). - Attribute Names: Use camelCase for variables (e.g.,
accountBalance). - Method Names: Use camelCase for operations (e.g.,
calculateTotal).
It is also crucial to avoid generic names like obj1 or temp. While these might suffice for a quick sketch, production diagrams require descriptive names. customer: Smith is better than customer: 1. Descriptive names allow the diagram to serve as documentation even without the code present.
When to Create an Object Diagram vs. Other UML Models 🚦
Not every scenario requires an object diagram. Experts know when to deploy this specific tool and when to rely on class or sequence diagrams. Using the wrong model wastes time and dilutes the message.
The following table outlines the decision matrix for diagram selection:
| Goal | Recommended Diagram | Reason |
|---|---|---|
| Define System Structure | Class Diagram | Focuses on types and relationships, not specific data. |
| Show Dynamic Behavior | Sequence Diagram | Illustrates message flow over time. |
| Show Specific Data State | Object Diagram | Depicts exact values and instance connections. |
| Define Lifecycle States | State Machine Diagram | Tracks state transitions of a single object. |
If you need to validate a specific test case, an object diagram is ideal. It shows the inputs (instances) and the expected relationships. If you are designing the architecture, a class diagram is better. Experts switch between these models as the project evolves, ensuring the documentation matches the current phase of development.
Common Pitfalls That Undermine Diagram Quality 🚫
Even experienced modelers can fall into traps. Avoiding these common mistakes is just as important as following best practices. Here are the pitfalls that degrade the value of your diagrams.
1. Over-Modeling
Do not attempt to draw every possible object. An object diagram should represent a specific scenario or state. Including every object in the system creates a tangled web that is impossible to read. Focus on the subset of objects relevant to the discussion at hand.
2. Ignoring Null Values
Attributes that are optional often hold null values. Experts represent this explicitly when it matters. If an attribute is critical to the logic, showing a null value explains why a relationship might not exist. Ignoring this can lead to assumptions about data availability that are incorrect.
3. Mixing Design and Implementation
Do not clutter the diagram with implementation details like database IDs or memory addresses unless they are relevant to the business logic. Keep the diagram at the conceptual level. It should be readable by business analysts, not just database administrators.
4. Static Assumptions
Remember that an object diagram is a snapshot. It is not a sequence. Do not imply time progression with the layout. If time is involved, use a sequence diagram. An object diagram shows a state, not a process.
Maintaining Diagrams Through System Evolution 🔄
Software changes. Requirements shift. Experts understand that diagrams must evolve alongside the code. A static diagram becomes a liability if it no longer reflects the system. To prevent this, integrate diagram updates into the development workflow.
- Version Control: Treat diagrams as code. Store them in the same repository. This ensures that changes to the model are tracked and auditable.
- Review Cycles: Include diagram updates in code review processes. If a class changes, the object diagram should be updated to reflect the new state.
- Automated Generation: Where possible, use tools that can generate diagrams from the codebase. This reduces the manual overhead and keeps the documentation in sync.
- Deprecation: Mark outdated diagrams clearly. Do not leave old diagrams sitting in the documentation folder where they might be mistaken for current artifacts.
Collaboration and Documentation Strategies 🤝
Diagrams are communication tools. Their value lies in how well they convey information to the team. Experts use diagrams as a focal point for meetings and documentation.
Using Diagrams in Meetings
Instead of speaking abstractly about data structures, pull up the object diagram. Point to specific instances and explain their relationships. This visual aid reduces misunderstandings. Stakeholders can see exactly what customer is linked to which order.
Embedding in Documentation
Place object diagrams in the technical specification documents. They serve as a quick reference for developers joining the project. A new developer can look at the diagram to understand the data model without digging through thousands of lines of code.
Standardizing Annotations
Use notes and comments to clarify complex logic. If a relationship has special rules, add a text box explaining it. This prevents the diagram from becoming a mystery. Annotations should be concise and directly related to the visual element they describe.
Final Thoughts on Effective Modeling 🏁
Object diagrams are powerful tools for visualizing the static structure of a system at a specific moment. They bridge the gap between abstract design and concrete implementation. By following the practices outlined in this guide, you can create diagrams that are clear, accurate, and valuable to your entire team.
Remember the core principles: focus on instances, maintain consistency in naming, manage relationships carefully, and update your models as the system evolves. Avoid the temptation to overcomplicate or generalize. Keep the focus on the specific state you are trying to document.
As you refine your skills, you will find that these diagrams become integral to your problem-solving process. They help identify logical errors, clarify requirements, and ensure that the data structure aligns with business needs. Start applying these best practices today to improve the quality of your technical documentation.