


Designing complex software systems requires a shared language that bridges the gap between abstract concepts and concrete implementation. Unified Modeling Language (UML) serves as that standard notation, offering various diagram types to capture different aspects of a system. Two of the most critical yet often confused diagram types are Object Diagrams and Sequence Diagrams. While both are integral to the modeling process, they address fundamentally different questions about your architecture.
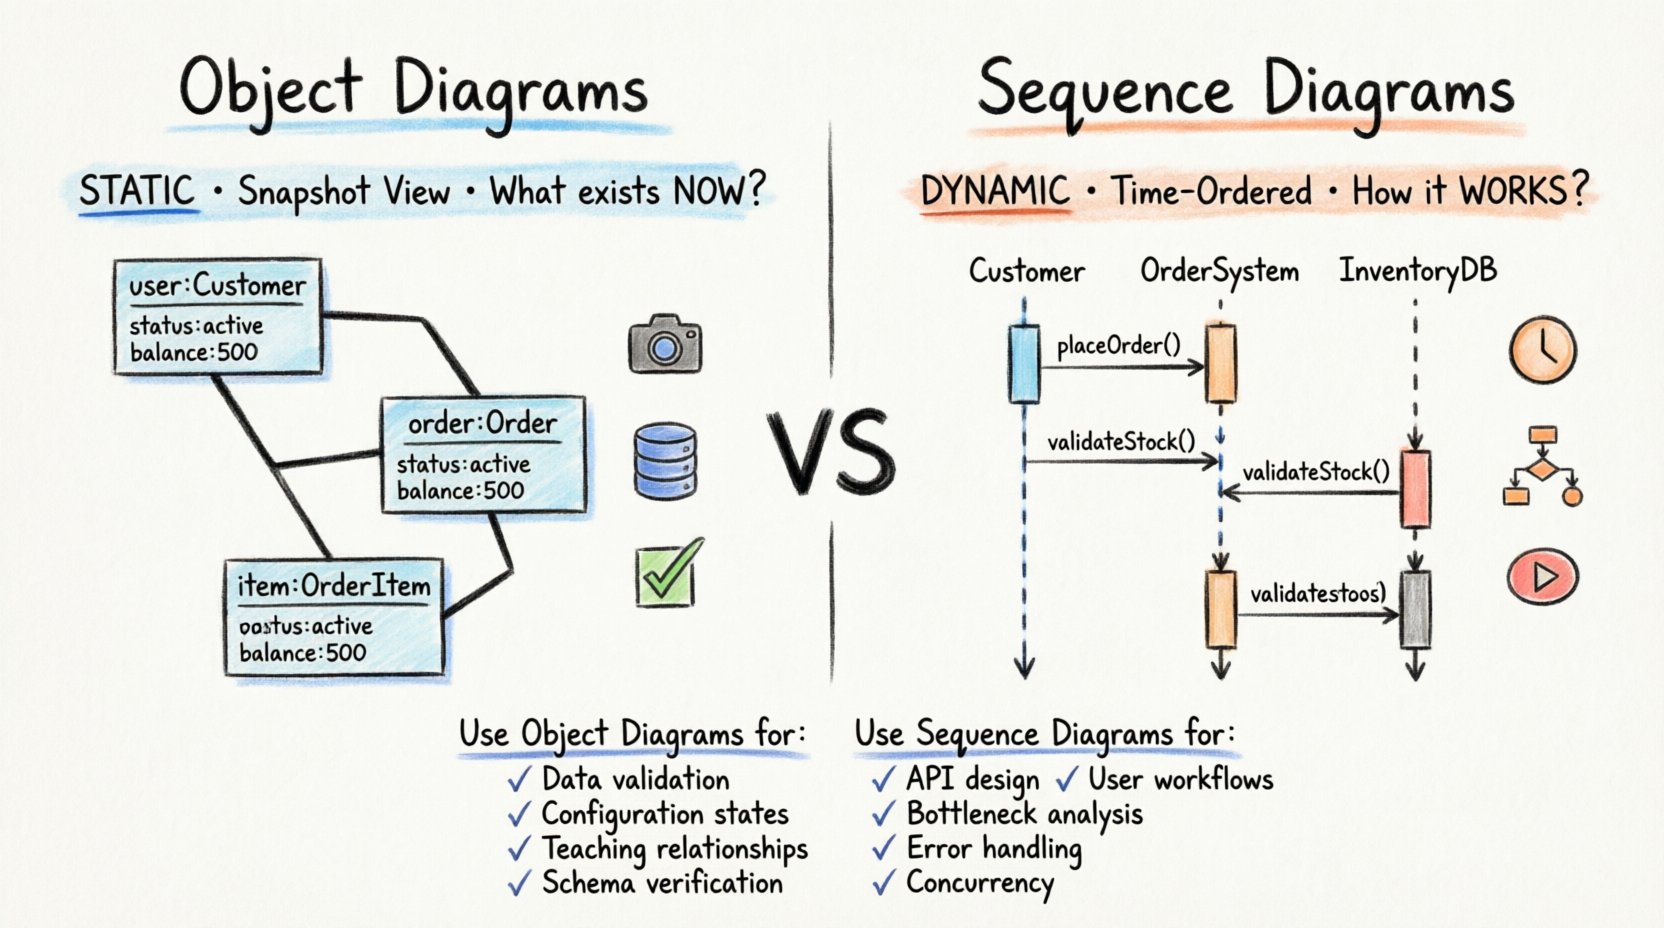
An Object Diagram captures a snapshot of the system’s static structure at a specific moment. It focuses on instances, their attributes, and the links connecting them. In contrast, a Sequence Diagram captures the dynamic behavior over time. It illustrates how objects interact with one another to perform a specific function or workflow. Understanding the distinction between these two is essential for creating clear, maintainable, and effective system documentation.
🔗 Deep Dive: Understanding Object Diagrams
An Object Diagram is a static structural diagram. It represents a specific instance of a Class Diagram. While a Class Diagram defines the blueprint—the types, attributes, and operations available—an Object Diagram shows the actual data existing within the system at a particular point in time.
Core Components of an Object Diagram
- Object Instances: These are named rectangles where the name is underlined to indicate it is an instance, not a class. For example, user:Customer indicates an object of type Customer named user.
- Attributes: Each instance displays its current attribute values. This is crucial for visualizing the state of data. For instance, an object might show status: active or balance: 500.00.
- Links: These represent associations between instances. A line connects two objects, showing that they are related. The line may have a label indicating the role played by the object at that end.
- Multiplicity: Even in object diagrams, multiplicity constraints are visible. They indicate how many instances can be linked, though the diagram itself only shows the actual connections present.
Why Use Object Diagrams?
The primary strength of an Object Diagram lies in its ability to depict concrete examples. It grounds abstract classes in reality. When you are debugging a complex data issue, a Class Diagram might tell you what a relationship should look like, but an Object Diagram tells you what it does look like right now.
Consider a scenario where you are validating data integrity before a migration. You need to verify that every Order instance is linked to exactly one Customer instance, but may have zero or many OrderItem instances. An Object Diagram allows you to visually inspect a set of instances to confirm these links exist correctly. It acts as a verification tool for the structural integrity of your data model.
Key Characteristics
- Snapshot View: It freezes time. It does not show changes over time.
- Focus on State: It highlights the values held by attributes.
- Static Relationships: It shows associations, aggregations, and compositions as they exist in a specific state.
- Low Volume: Because they show instances, they can become cluttered quickly if the system has millions of objects. They are best used for small, representative samples.
⏱️ Deep Dive: Understanding Sequence Diagrams
A Sequence Diagram is a dynamic interaction diagram. It focuses on the flow of control and data between participants over time. It answers the question: “How does this feature work?” rather than “What does this data look like?”
Core Components of a Sequence Diagram
- Lifelines: Vertical dashed lines extending from participants. They represent the existence of an object or actor throughout the interaction.
- Messages: Horizontal arrows indicating communication. Arrows can be solid (synchronous calls) or open (asynchronous calls). The label describes the method being invoked.
- Activation Bars: Rectangles on the lifeline showing when an object is active or performing an action. This helps visualize concurrency and processing time.
- Combined Fragments: Boxes with a frame that define interaction logic, such as alt (alternative paths), opt (optional paths), loop (repetitive actions), or ref (referencing another diagram).
Why Use Sequence Diagrams?
The power of a Sequence Diagram is its ability to model behavior. It is indispensable for defining API contracts, user workflows, and system integrations. When you need to explain a business rule that involves multiple steps, this diagram maps the sequence of events clearly.
For example, consider a payment processing workflow. A user initiates a transaction, the system validates the card, contacts the bank, and confirms the result. A Sequence Diagram lays out this flow step-by-step. It reveals timing issues, potential deadlocks, and error handling paths that a static diagram cannot show.
Key Characteristics
- Time-Ordered: The vertical axis represents the passage of time. Events higher up occur before events lower down.
- Interaction Focused: It emphasizes the messages exchanged between objects.
- Behavioral Logic: It captures conditional logic and loops within the interaction flow.
- Scalability: It can handle complex logic without becoming as visually cluttered as an Object Diagram with many instances.
📊 Comparison: Object vs. Sequence Diagrams
To clarify the distinctions, we can compare the two diagrams across several dimensions. This table highlights the structural and functional differences.
| Feature | Object Diagram | Sequence Diagram |
|---|---|---|
| Category | Structural (Static) | Behavioral (Dynamic) |
| Primary Question | What exists right now? | How does it work over time? |
| Key Elements | Instances, Links, Attribute Values | Lifelines, Messages, Activation Bars |
| Time Aspect | None (Snapshot) | Explicit (Vertical Axis) |
| Use Case | Data validation, Configuration states | API flows, User stories, Logic paths |
| Complexity | High with many instances | High with many interaction steps |
🛠️ When to Use Object Diagrams
Selecting the right diagram depends on your immediate goal. Object Diagrams are specialized tools for specific structural contexts. They are not meant for general communication but for deep technical inspection.
1. Validating Data Structures
When you suspect a bug in how data is linked, an Object Diagram helps isolate the issue. If the system reports that a User cannot find their Order, you can draw the instances to see if the link actually exists. This is particularly useful for complex relational data models where associations are not obvious from class names alone.
2. Documenting Configuration States
Some systems have complex initialization states. For example, a database cluster might have a specific topology of nodes during a failover event. An Object Diagram can document the state of the cluster during that specific window, showing which node is primary, which is secondary, and how they are connected.
3. Teaching Complex Relationships
Abstract class relationships can be hard to grasp for new team members. Showing a concrete example helps. Instead of explaining that a Department has many Employees, you draw one Department object and three Employee objects connected to it. This makes the multiplicity concrete and understandable.
4. Database Schema Verification
Before executing a bulk update or migration, engineers often need to verify the current state of the data. An Object Diagram serves as a visual schema check for a specific dataset, ensuring that foreign keys and constraints are satisfied in the actual data, not just the theoretical model.
🔄 When to Use Sequence Diagrams
Sequence Diagrams are the workhorses of behavioral design. They are used whenever the flow of logic matters more than the static state of data.
1. Designing APIs and Microservices
When building distributed systems, the interaction between services is critical. A Sequence Diagram maps the request and response cycle between a client and a server, or between two microservices. It clarifies who calls whom, what parameters are passed, and what the return values are.
2. Defining User Workflows
Product requirements often describe a user journey. “The user clicks submit, the system checks the form, then saves the data.” A Sequence Diagram translates this narrative into technical steps. It identifies which components are involved in each step, ensuring no part of the backend is overlooked.
3. Identifying Bottlenecks
Because Sequence Diagrams show the order of operations, they help identify performance issues. If you see a long chain of synchronous calls, you might realize the system will be slow. You can use this insight to suggest asynchronous messaging or caching strategies.
4. Error Handling and Edge Cases
Robust systems must handle failures. Sequence Diagrams allow you to model what happens when a service is unavailable. You can draw a dashed arrow for an exception or a message indicating a timeout. This ensures that error paths are documented alongside happy paths.
5. Concurrency and Timing
Some systems require multiple objects to act simultaneously. Activation bars on a Sequence Diagram can overlap to show concurrency. This is vital for understanding thread safety and race conditions in a concurrent environment.
🚧 Common Pitfalls and Best Practices
Using these diagrams incorrectly can lead to confusion rather than clarity. Avoid these common mistakes to maintain high-quality documentation.
Pitfall 1: Mixing Static and Dynamic Concerns
Do not try to force a Sequence Diagram to show all possible data states. Do not try to show the entire lifecycle of the system in an Object Diagram. Keep Object Diagrams for structure and Sequence Diagrams for behavior. Mixing them dilutes their purpose.
Pitfall 2: Overloading Object Diagrams
Creating an Object Diagram with hundreds of instances makes it unreadable. Select a representative sample. If you need to show all data, use a database dump or a script, not a diagram. Keep Object Diagrams to a manageable size.
Pitfall 3: Ignoring Time in Sequence Diagrams
A Sequence Diagram must read from top to bottom. Ensure the vertical spacing reflects the logical flow. If message A must happen before message B, A must be higher. Do not cross lines arbitrarily unless it represents a specific return message.
Pitfall 4: Inconsistent Naming
Ensure object names in the Object Diagram match the variable names used in the Sequence Diagram. Consistency across diagrams reduces cognitive load for the reader. If an object is named orderProcessor in the sequence, do not call it OrderMgr in the object diagram.
Best Practice 1: Use Combined Fragments
In Sequence Diagrams, use alt and opt frames to show branching logic. This keeps the diagram clean compared to drawing separate arrows for every condition. It visually groups alternative paths together.
Best Practice 2: Limit Attribute Detail
In Object Diagrams, do not list every attribute. Only show the attributes relevant to the specific relationship or state you are demonstrating. Too much detail obscures the structural links you are trying to highlight.
Best Practice 3: Version Control Your Diagrams
Just like code, diagrams change. Treat them as living documents. When a feature evolves, update the Sequence Diagram to reflect the new flow. When data structures change, update the Object Diagram. This ensures your documentation remains a source of truth.
Best Practice 4: Focus on the Audience
Consider who will read your diagram. Developers need technical detail in Sequence Diagrams, including method signatures. Stakeholders may prefer a higher-level view that omits internal class details. Tailor the level of abstraction to the reader’s needs.
🔍 Integrating Diagrams in the Design Process
These diagrams are not isolated artifacts; they are part of a cohesive design workflow. They complement each other to provide a 360-degree view of the system.
Start with the Object Diagram to define the data model. Understand the entities and their relationships. Once the structure is solid, use the Sequence Diagram to define how those entities interact. This flow ensures that the behavior you design is supported by the structure you built.
During implementation, developers refer to the Sequence Diagram to write the logic and the Object Diagram to understand the data context. If a bug arises, you can switch between the two. If the logic fails, check the Sequence Diagram. If the data is incorrect, check the Object Diagram.
This dual approach creates a robust documentation ecosystem. It reduces the gap between design and code. It ensures that the system is built correctly according to the plan, and the plan accurately reflects the reality of the system.
🎯 Summary of Key Takeaways
- Object Diagrams are static snapshots. They show instances, attribute values, and links at a specific moment.
- Sequence Diagrams are dynamic flows. They show interactions, messages, and time over a period.
- Use Object Diagrams for data validation, state documentation, and teaching relationships.
- Use Sequence Diagrams for API design, workflow logic, error handling, and performance analysis.
- Keep them separate to maintain clarity. Do not mix structural and behavioral concerns in one view.
- Maintain consistency in naming and versioning to ensure the documentation remains useful.
By mastering the application of these two diagram types, you enhance the clarity of your system design. You provide your team with precise tools to understand both the “what” and the “how” of your software. This precision leads to fewer misunderstandings, faster development cycles, and more reliable systems.
Remember that diagrams are communication tools, not just technical requirements. Their value lies in how well they convey information to humans. Choose the right tool for the message, and your design work will benefit from the added clarity and structure.