


The landscape of software engineering is shifting beneath the feet of every developer and student entering the field. While coding languages evolve rapidly, the fundamental structures that hold these applications together remain critical. Among the most enduring tools for visualizing system architecture are Object Diagrams. As students navigate their academic journeys and prepare for professional careers, understanding the static structure of a system is not just a theoretical exercise—it is a practical necessity. This guide explores the current state of Object Diagrams, their pedagogical value, and how their role is evolving in the context of modern development practices.
🔍 Understanding the Core: What is an Object Diagram?
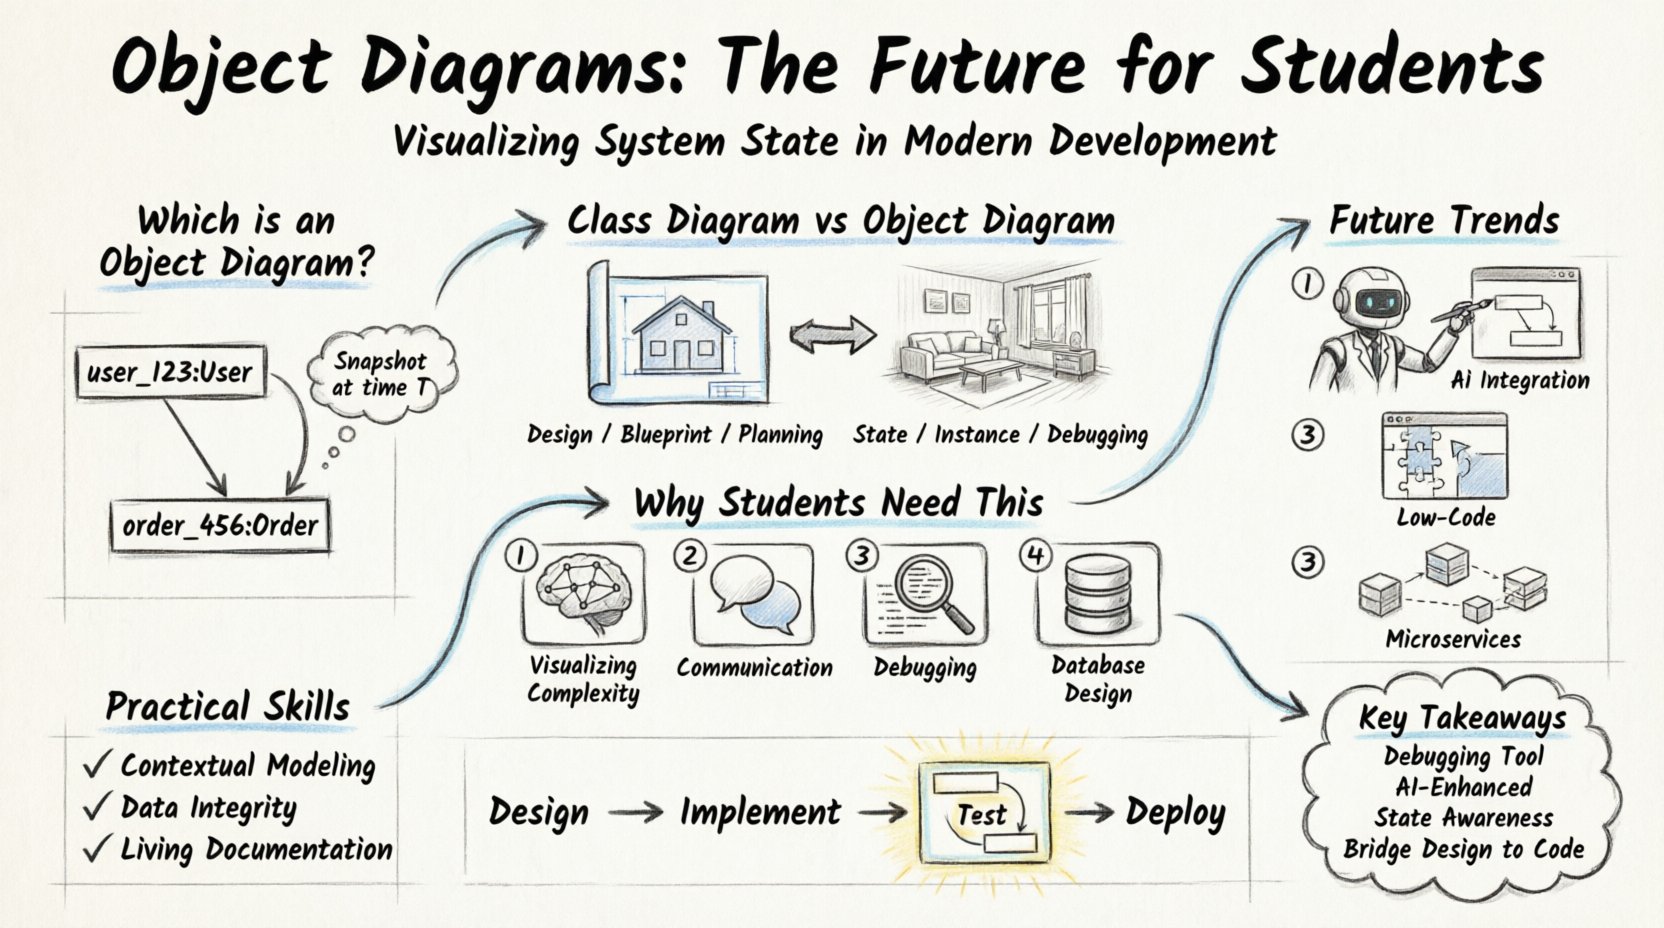
An Object Diagram is a static structure diagram in the Unified Modeling Language (UML). It captures a snapshot of the details of objects in a system at a specific point in time. Unlike a Class Diagram, which defines the blueprint or the template for objects, an Object Diagram shows actual instances. It answers the question: “What does the system look like right now?”
For students, this distinction is vital. When designing a system, you define classes. When debugging or analyzing a specific execution path, you look at objects. The diagram visualizes these instances, their attributes, and the links connecting them. It is a concrete representation of the abstract design.
- Instances: Specific items created from a class (e.g.,
user_123from classUser). - Attributes: The actual data held by the instance at that moment.
- Links: The relationships between instances, mirroring associations defined in class diagrams.
⚖️ Class Diagram vs. Object Diagram: A Comparative View
Confusion often arises between these two fundamental UML artifacts. To clarify their distinct roles in the student workflow, consider the following comparison.
| Feature | Class Diagram | Object Diagram |
|---|---|---|
| Focus | Design, Blueprint, Structure | State, Snapshot, Instances |
| Timeframe | Static (Design Phase) | Dynamic (Runtime Phase) |
| Notation | Class Name (Bold) | Instance Name (Italicized) |
| Use Case | Planning the architecture | Debugging or documentation of a specific scenario |
| Complexity | High (General Rules) | Variable (Specific Data) |
Understanding this table helps students decide when to use which tool. A Class Diagram is for building the house; an Object Diagram is for inspecting the rooms at a specific moment.
🎓 The Educational Value for Students
Why do academic programs insist on teaching Object Diagrams when modern development often relies on code-first approaches? The answer lies in abstraction and communication.
- Visualizing Complexity: Large systems are difficult to track mentally. Visualizing object instances helps students trace data flow and identify memory leaks or broken links conceptually.
- Communication: Stakeholders often cannot read code. A diagram provides a universal language to explain how data interacts during a specific transaction.
- Debugging Logic: When a bug occurs, the state of objects is often the culprit. Drawing the state helps isolate the error.
- Database Design: Object diagrams closely resemble database snapshots, aiding in the transition from object-oriented design to relational storage models.
🔮 The Future: Trends Shaping Object Modeling
The software industry is moving towards automation, cloud-native architectures, and distributed systems. How does this affect the relevance of static modeling diagrams? The role is shifting from manual drawing to automated generation and analysis.
1. Integration with AI and Code Generation
Artificial Intelligence is beginning to assist in documentation. Instead of manually drawing an Object Diagram, modern modeling tools can analyze the source code and generate diagrams automatically. This does not remove the need for students to understand the underlying structure; rather, it shifts the focus from drawing to interpreting.
- Auto-Diagramming: Tools can scan code repositories and visualize instance relationships.
- Validation: AI can check if the current object state violates design constraints defined in the Class Diagram.
2. Low-Code and No-Code Environments
The rise of low-code platforms means that developers are building applications by configuring existing components rather than writing raw code. In this environment, the Object Diagram serves as the configuration state. Students need to understand how these visual configurations translate to backend object instances.
- Visual Logic: The configuration becomes the diagram.
- State Management: Understanding how data persists across sessions is critical in these environments.
3. Microservices and Distributed Systems
As systems break into microservices, the concept of a single “object” becomes distributed. An object diagram now represents a view of data across multiple services. This adds complexity, requiring students to understand how instances in Service A link to instances in Service B via APIs.
- Service Context: Objects are no longer just in memory; they are networked.
- Serialization: Understanding how objects are serialized for transmission is a key skill.
🛠️ Practical Skills for the Modern Student
To remain competitive, students should approach Object Diagrams not as a relic, but as a tool for clarity. Here are the specific skills that add value to a portfolio.
1. Contextual Modeling
Do not try to model the entire system at once. Focus on specific scenarios. For example, model the state of a shopping cart at the moment of checkout. This specificity makes the diagram useful for debugging.
2. Data Integrity Checks
Use diagrams to verify constraints. If a Order object exists, does it have a valid Customer link? Visualizing this relationship prevents logical errors in code.
3. Documentation Standards
Maintain diagrams that match the code. Outdated diagrams are worse than no diagrams. Students should learn to update their models alongside their codebases, treating the diagram as a living document.
🧩 Challenges in Modern Modeling
Despite the benefits, there are hurdles. Students often face resistance when introducing modeling into fast-paced development cycles.
- Time Constraints: Drawing diagrams takes time that could be spent coding. The solution is to use diagrams only for complex logic, not simple scripts.
- Tool Fragmentation: There is no single standard tool for everyone. Students should learn the concepts, not just one software interface.
- Dynamic Nature: Code changes frequently. Static diagrams can become obsolete quickly. The future lies in diagram-as-code or auto-generated views.
📊 Case Study: A Student Project Workflow
Consider a typical capstone project where a student builds a social media platform. How do Object Diagrams fit into this process?
- Phase 1: Design: Create Class Diagrams to define Users, Posts, and Comments.
- Phase 2: Implementation: Write the code. Use Object Diagrams to map out the initial data seeding (e.g., the first user created).
- Phase 3: Testing: When a test fails, draw the Object Diagram of the state at the point of failure. This isolates whether the data is wrong or the logic is wrong.
- Phase 4: Deployment: Document the expected state of the system for the end-user or client.
This workflow demonstrates that the diagram is not just a drawing; it is a debugging instrument.
🚀 Preparing for the Next Decade
The future of software development will likely see a hybrid approach. Pure coding will coexist with visual modeling. Students who understand the intersection of code and static structure will be better equipped to handle legacy systems and complex architectural challenges.
Here are the areas students should prioritize:
- Understanding Persistence: How does a memory object become a database record?
- Memory Management: How does garbage collection affect object states?
- Concurrency: How do multiple threads affect the state of an object diagram?
- Security: How are sensitive object attributes protected in the diagram?
📝 Summary of Key Takeaways
The Object Diagram remains a relevant tool, provided it is used correctly. It bridges the gap between abstract design and concrete reality. For students, mastering the concept means more than learning a notation; it means understanding the state of a system.
- Relevance: It is used for debugging, documentation, and state analysis.
- Evolution: Tools are automating the drawing, focusing the human on the logic.
- Education: It teaches structured thinking about data relationships.
- Future: It integrates with AI and distributed system architectures.
As the industry moves forward, the ability to visualize and reason about object states will remain a core competency. Students who embrace this tool alongside their coding skills will find themselves better prepared for the complexities of modern software engineering.
🌟 Final Thoughts on Development Education
Software development is a discipline of structure. While frameworks come and go, the principles of how data connects and persists remain constant. Object Diagrams offer a window into these principles. By studying them, students gain a deeper appreciation for the architecture they build. This foundation allows them to adapt to new technologies without losing sight of the underlying mechanics.
The journey of a developer is one of continuous learning. Incorporating static modeling into the workflow provides a stable anchor in a sea of changing syntax. Whether through manual drawing or automated generation, the insight gained from visualizing object instances is invaluable.
Keep the diagrams clean. Keep the code clean. The two work together to create robust systems.