Pentingnya Kematangan Arsitektur dalam Desain Basis Data
Diagram Hubungan Entitas (ERD)berfungsi sebagai tulang punggung arsitektur sistem yang efektif. Mereka bukan ilustrasi statis tetapi dikembangkan pada tiga tahap berbeda darikematangan arsitektur. Setiap tahap memiliki tujuan unik dalam lingkupsiklus desain basis data, menyesuaikan dengan audiens tertentu mulai dari pemangku kepentingan hingga administrator basis data. Meskipun ketiga tingkatan ini melibatkan entitas, atribut, dan hubungan, kedalaman detail dan spesifikitas teknis berbeda secara signifikan di antara mereka.
Untuk benar-benar memahami perkembangan model-model ini, sangat membantu menggunakan analogi konstruksi. Bayangkan membangun sebuah rumah: sebuahERD Konseptualadalah sketsa awal arsitek yang menunjukkan lokasi umum ruangan seperti dapur dan ruang tamu. SedangkanERD Logisadalah denah rinci yang menentukan dimensi dan penempatan perabot, meskipun belum menentukan bahan. Akhirnya,ERD Fisikberfungsi sebagai gambar kerja teknik, menentukan instalasi pipa air, kabel listrik, dan merek beton tertentu untuk fondasi.
1. ERD Konseptual: Sudut Pandang Bisnis
TheERD Konseptualmewakili tingkat abstraksi tertinggi. Ini memberikan pandangan strategis terhadap objek bisnis dan hubungan antar mereka, tanpa kekacauan teknis.
Tujuan dan Fokus
Model ini terutama digunakan untukpengumpulan kebutuhandan memvisualisasikan arsitektur sistem secara keseluruhan. Tujuan utamanya adalah memfasilitasi komunikasi antara tim teknis dan pemangku kepentingan non-teknis. Fokusnya adalah pada penentuanentitas apa yang ada—seperti ‘Siswa’, ‘Produk’, atau ‘Pesanan’—daripada bagaimana entitas-entitas ini akan diimplementasikan dalam tabel basis data.
Tingkat Rincian
Model konseptual umumnya tidak memiliki keterbatasan teknis. Sebagai contoh, hubungan banyak-ke-banyak sering digambarkan hanya sebagai hubungan tanpa kompleksitas kardinalitas atau tabel hubungan. Secara unik, tingkat ini dapat menggunakangeneralisasi, seperti mendefinisikan ‘Segitiga’ sebagai sub-tipe dari ‘Bentuk’, sebuah konsep yang disederhanakan dalam implementasi fisik selanjutnya.
2. ERD Logis: Sudut Pandang Rinci
Menuruni skala kematangan, Logical ERD berfungsi sebagai versi yang diperkaya dari model konseptual, menjembatani kesenjangan antara kebutuhan bisnis abstrak dan implementasi teknis yang konkret.
Tujuan dan Fokus
Model logis mengubah kebutuhan tingkat tinggi menjadi entitas operasional dan transaksional. Meskipun mendefinisikan kolom eksplisit untuk setiap entitas, namun tetap secara ketat terlepas dari sistem manajemen basis data tertentu Sistem Manajemen Basis Data (DBMS). Pada tahap ini tidak masalah apakah basis data akhir akan menggunakan Oracle, MySQL, atau SQL Server.
Tingkat Rincian
Berbeda dengan model konseptual, ERD logis mencakup atribut untuk setiap entitas. Namun, ia berhenti sebelum menentukan hal-hal teknis rinci seperti tipe data (misalnya integer vs float) atau panjang bidang tertentu.
3. ERD Fisik: Rancangan Teknis
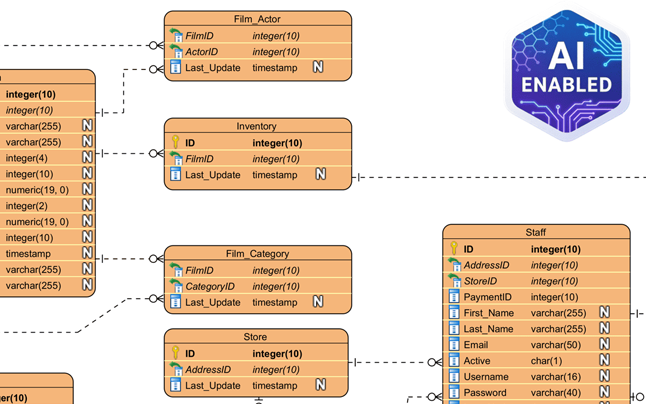
The ERD Fisik mewakili desain teknis akhir yang dapat dijalankan dari basis data relasional. Ini adalah skema yang akan diimplementasikan.
Tujuan dan Fokus
Model ini berfungsi sebagai rancangan dasar untuk membuat skema basis data dalam sistem manajemen basis data tertentu. Ia menguraikan model logis dengan menetapkan tipe data, panjang, dan batasan (seperti varchar(255), int, atau nullable).
Tingkat Rincian
ERD fisik sangat rinci. Ia mendefinisikan Kunci Utama (PK) dan Kunci Asing (FK) untuk secara ketat memaksakan hubungan. Selain itu, harus mempertimbangkan konvensi penamaan khusus, kata-kata yang dilarang, dan keterbatasan dari DBMS target.
Analisis Perbandingan Model ERD
Untuk merangkum perbedaan antara tingkat arsitektur ini, tabel berikut ini menguraikan fitur-fitur yang biasanya didukung di berbagai model:
| Fitur | Konseptual | Logis | Fisik |
|---|---|---|---|
| Nama Entitas | Ya | Ya | Ya |
| Hubungan | Ya | Ya | Ya |
| Kolom/Atribut | Opsional/Tidak | Ya | Ya |
| Tipe Data | Tidak | Opsional | Ya |
| Kunci Utama | Tidak | Ya | Ya |
| Kunci Asing | Tidak | Ya | Ya |
Mempermudah Desain dengan Visual Paradigm dan AI
Membuat model-model ini secara manual dan memastikan konsistensinya bisa memakan waktu. Alat modern seperti Visual Paradigm memanfaatkan otomatisasi dan Kecerdasan Buatan untuk mempermudah transisi antara tingkat kematangan ini.
Transformasi Model dan Pelacakan
Visual Paradigm menawarkan Model Transitor, alat yang dirancang untuk menghasilkan model logis langsung dari model konseptual, dan selanjutnya, model fisik dari model logis. Proses ini mempertahankan pelacakan otomatis, memastikan bahwa perubahan dalam tampilan bisnis tercermin secara akurat dalam gambar teknis.
Generasi Berbasis AI
Fitur canggih mencakup kemampuan AI yang dapat langsung menghasilkan ERD profesional dari deskripsi teks. AI secara otomatis menarik kesimpulan tentang entitas dan batasan kunci asing, secara signifikan mengurangi waktu pengaturan manual.

Sinkronisasi Dua Arah
Pentingnya, platform ini mendukung transformasi dua arah. Ini memastikan bahwa desain visual dan implementasi fisik tetap sinkron, mencegah masalah umum di mana dokumentasi terpisah dari kode aktual.
-
Ulasan Komprehensif DBModeler AI untuk Desain Skema: Analisis mendalam tentang bagaimana DBModeler AI mengubah desain skema basis data melalui otomatisasi dan kecerdasan.
-
DBModeler AI: Alat Pemodelan Basis Data Cerdas: Akses alat berbasis AI untuk pemodelan basis data otomatis dan generasi skema di Visual Paradigm.
-
DBModeler AI: Alat desain basis data berbasis AI dengan alur kerja 7 langkah. Hasilkan model domain, diagram ER, skema yang dinormalisasi, dan laporan desain lengkap. Jalankan lingkungan percobaan basis data langsung di browser untuk menguji query secara instan.
-
Analisis Teks Berbasis AI – Ubah Teks menjadi Model Visual Secara Otomatis: Gunakan AI untuk menganalisis dokumen teks dan secara otomatis menghasilkan diagram seperti UML, BPMN, dan ERD untuk pemodelan dan dokumentasi yang lebih cepat.
-
Alat ERD Visual Paradigm – Buat Diagram Entitas-Relasi Secara Online: Alat ERD berbasis web yang kuat yang memungkinkan pengguna merancang dan memvisualisasikan skema basis data dengan mudah menggunakan fitur seret dan lepas yang intuitif.
-
Desain Basis Data dengan Alat ERD – Panduan Visual Paradigm: Panduan komprehensif tentang penggunaan alat ERD untuk merancang basis data yang kuat dan dapat diskalakan dengan praktik terbaik dalam pemodelan data dan desain skema.
-
Apa itu Diagram Entitas-Relasi (ERD)? – Panduan Visual Paradigm: Penjelasan mendalam tentang ERD, komponen-komponennya, dan pentingnya dalam desain basis data serta pemodelan data.
-
Alat ERD Gratis – Rancang Basis Data Secara Online dengan Visual Paradigm: Akses alat ERD gratis secara online untuk membuat diagram entitas-relasi profesional tanpa instalasi atau langganan.
-
Cara Menggambar Entitas dalam Alat ERD Visual Paradigm: Panduan langkah demi langkah untuk membuat dan menyesuaikan entitas dalam alat ERD Visual Paradigm untuk pemodelan basis data yang akurat.
-
Cara Memodelkan Basis Data Relasional dengan ERD – Tutorial Visual Paradigm: Tutorial praktis yang menunjukkan cara menggunakan ERD untuk memodelkan basis data relasional dari konsep hingga implementasi.