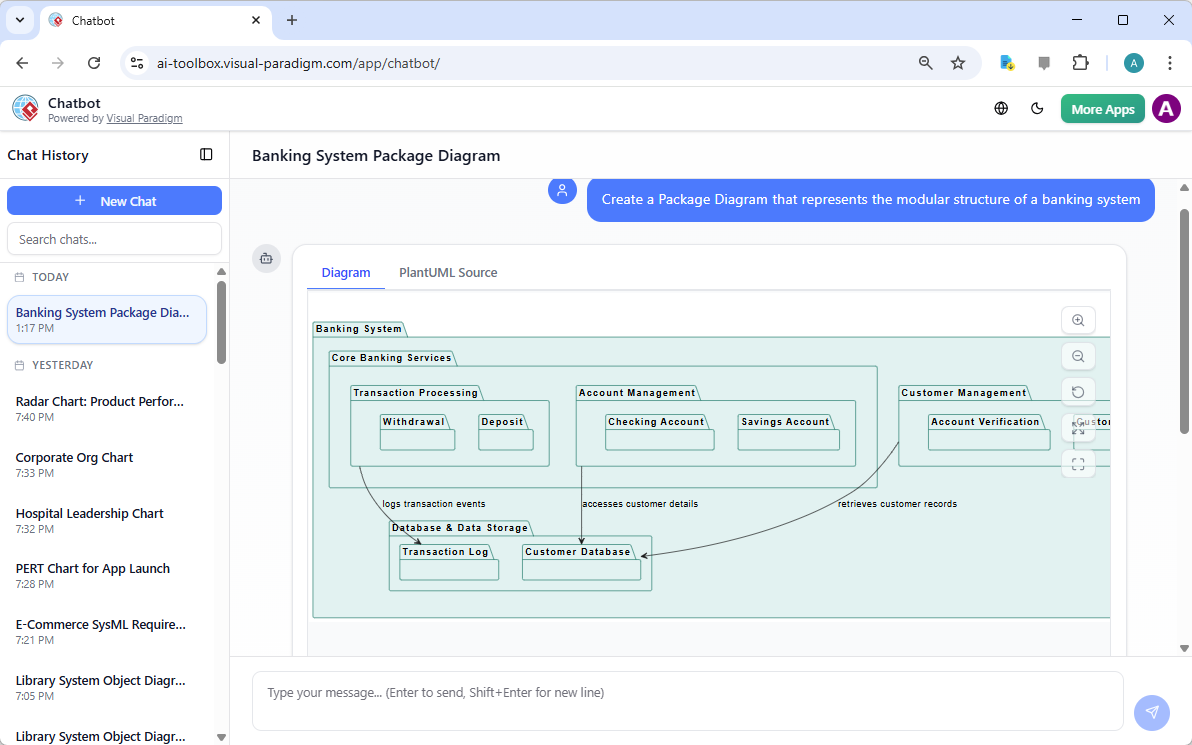
Discover how AI guides your use case journey from problem to report with Visual Paradigm’s intelligent development assistant.
新しいオンラインコースプラットフォームの立ち上げを担当するプロジェクトマネージャーだと想像してください。最初の課題は、問題を明確に表現し、それを機能的なシステムに変換することです。ここがUse Case駆動型開発アシスタントVisual Paradigm社のAI搭載ツールが登場します。単に文書作成を助けるだけでなく、曖昧なアイデアを詳細で実行可能なプロジェクト計画に変換するための完全で構造化されたワークフローをガイドします。このプロセスは非常に直感的で、経験豊富なビジネスアナリストと技術アーキテクトが一緒に働いているかのように感じられます。この詳細な解説では、実際のオンラインコースプラットフォームの事例を用いて、この強力なツールがUse Caseライフサイクル全体をどのように簡素化するかを紹介します。
要約:Use Case駆動型開発アシスタントの主なポイント
-
プロジェクトの核心的な目的を明確にするために、明確な問題文から始めましょう。
-
AIを活用して、候補となるUse Caseとアクターのリストを自動生成します。
-
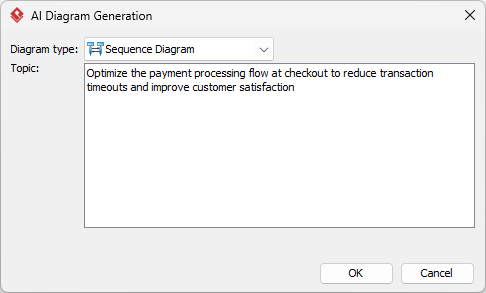
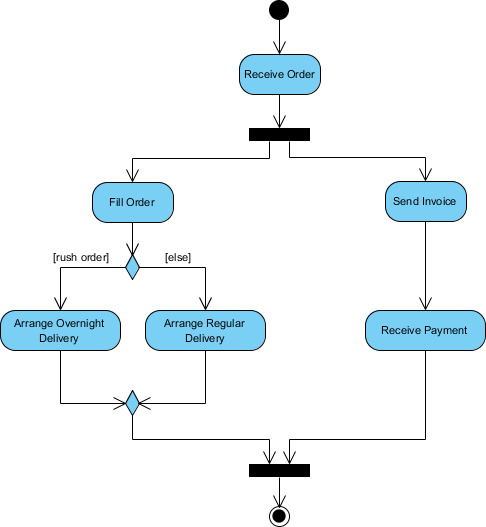
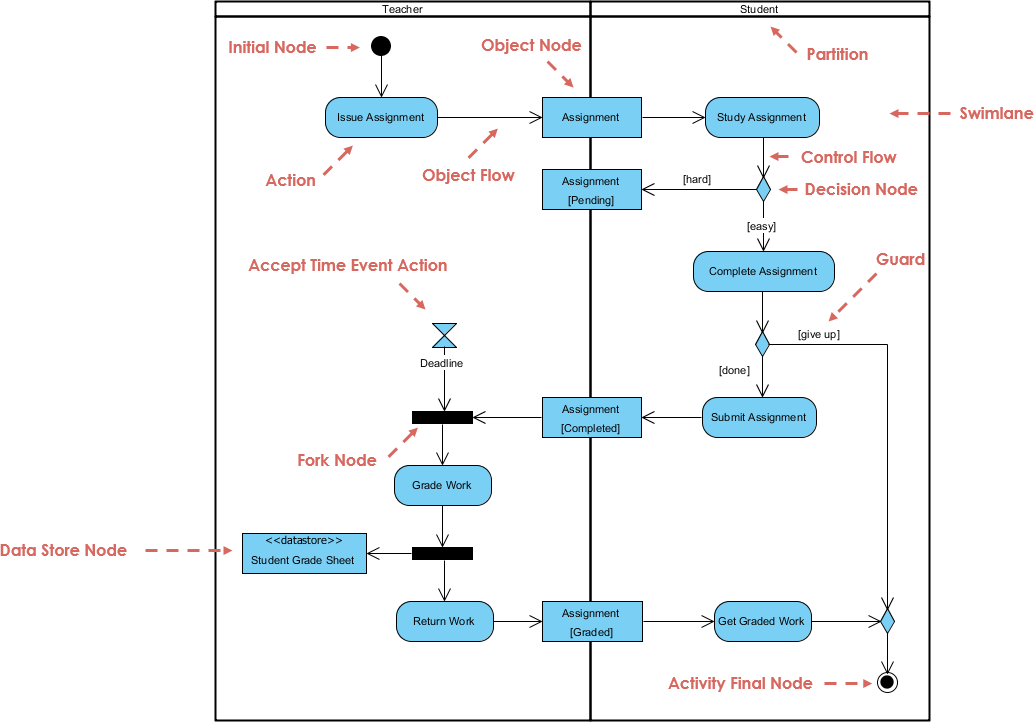
AI生成のUse Caseとアクティビティ図.
-
構造化されたMoSCoW法を用いて機能を優先順位付けし、高価値の作業に集中します。
-
詳細なUse Caseの記述と実行可能なGherkinテストシナリオを生成します。
-
プロジェクトの範囲と計画を伝えるための包括的なレポートを作成します。
-
中央ダッシュボードを活用して進捗を追跡し、単一の真実の源を維持します。
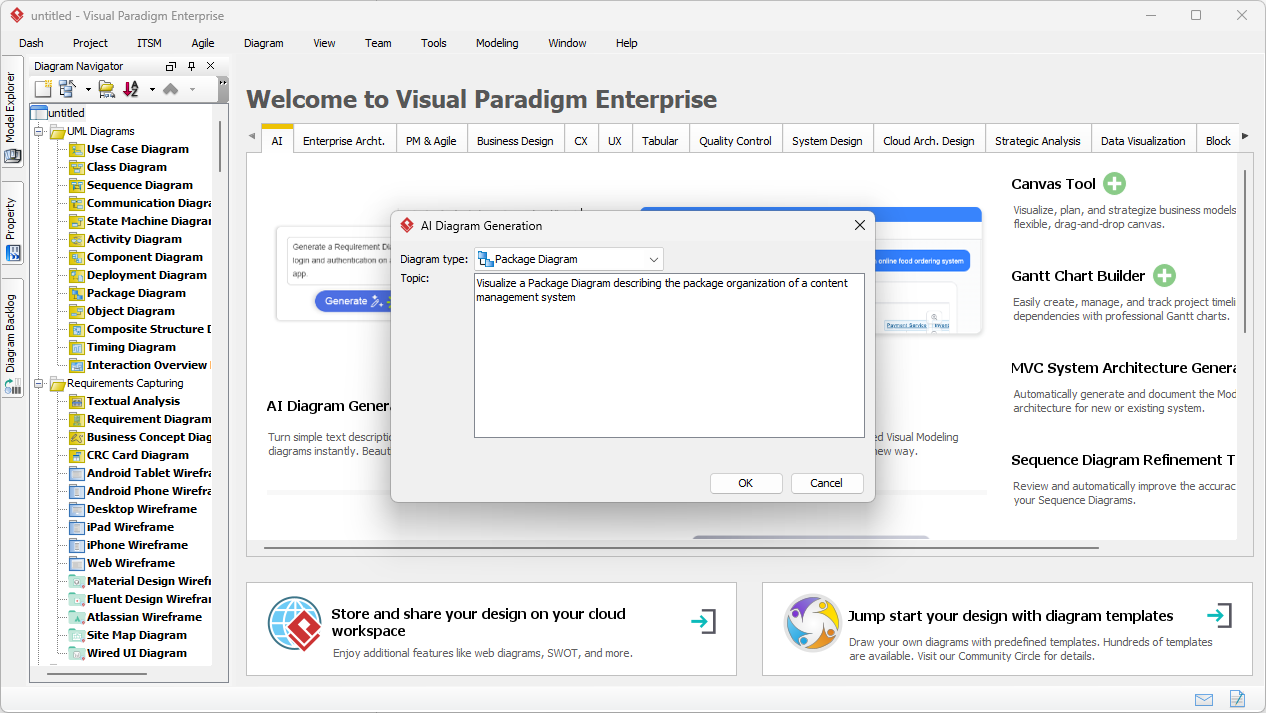
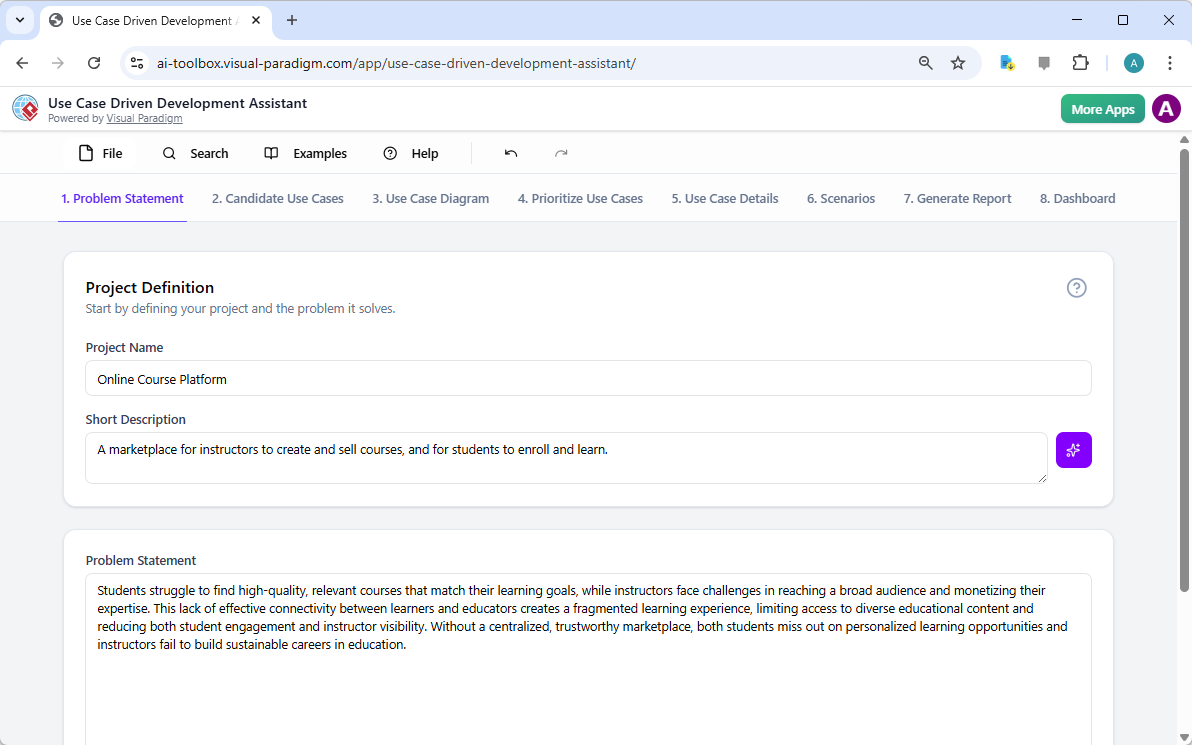
ステップ1:AIを活用した問題の定義
すべての成功するプロジェクトは、解決しようとしている問題を明確に理解することから始まります。Use Case駆動型開発アシスタントとの旅は「問題文」タブから始まります。ここではプロジェクト名と簡単な説明を入力します。AIはこの情報をもとに包括的な問題文を生成します。図1このツールはプロジェクト名「オンラインコースプラットフォーム」と簡単な説明「インストラクターがコースを作成・販売し、学生が登録して学べるマーケットプレイス」をもとに詳細な物語を生成しました。この物語は核心的な課題を明らかにしています:学生は関連するコースを見つけるのが困難であり、インストラクターは広範なオーディエンスに届くことや専門知識を収益化することに課題を抱えています。このAI生成の問題文はプロジェクトの基盤となり、チーム全員が最初から統一した理解を持つことを保証します。
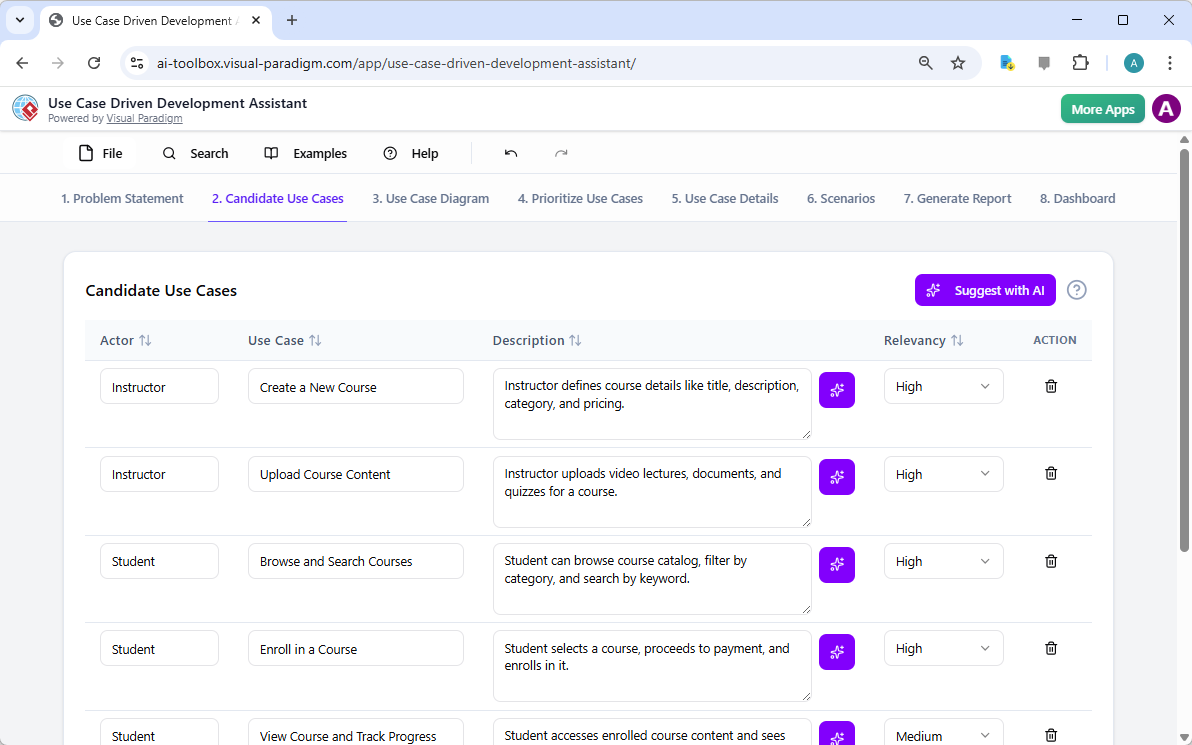
ステップ2:AIアシスタントを活用したUse Caseの特定
問題が定義されると、次に自然なステップとして、システムが提供すべき主要な機能を特定することです。アシスタントの「候補Use Case」タブ(図2)はこのプロセスを自動化します。問題文を分析した後、AIは各アクター(インストラクター、学生、管理者など)に関連付けられたUse Caseのリストを提案します。今回のオンラインコースプラットフォームの場合、AIは「新しいコースを作成する」「コースコンテンツをアップロードする」「コースを閲覧・検索する」「コースに登録する」などのUse Caseを提案しています。このリストはしっかりとした出発点となり、ブレインストーミング会議に費やす時間と労力を大幅に節約します。その後、これらの提案を精査し、新しいものを追加したり、不要なものを削除したりして、システム機能の包括的なリストを作成できます。
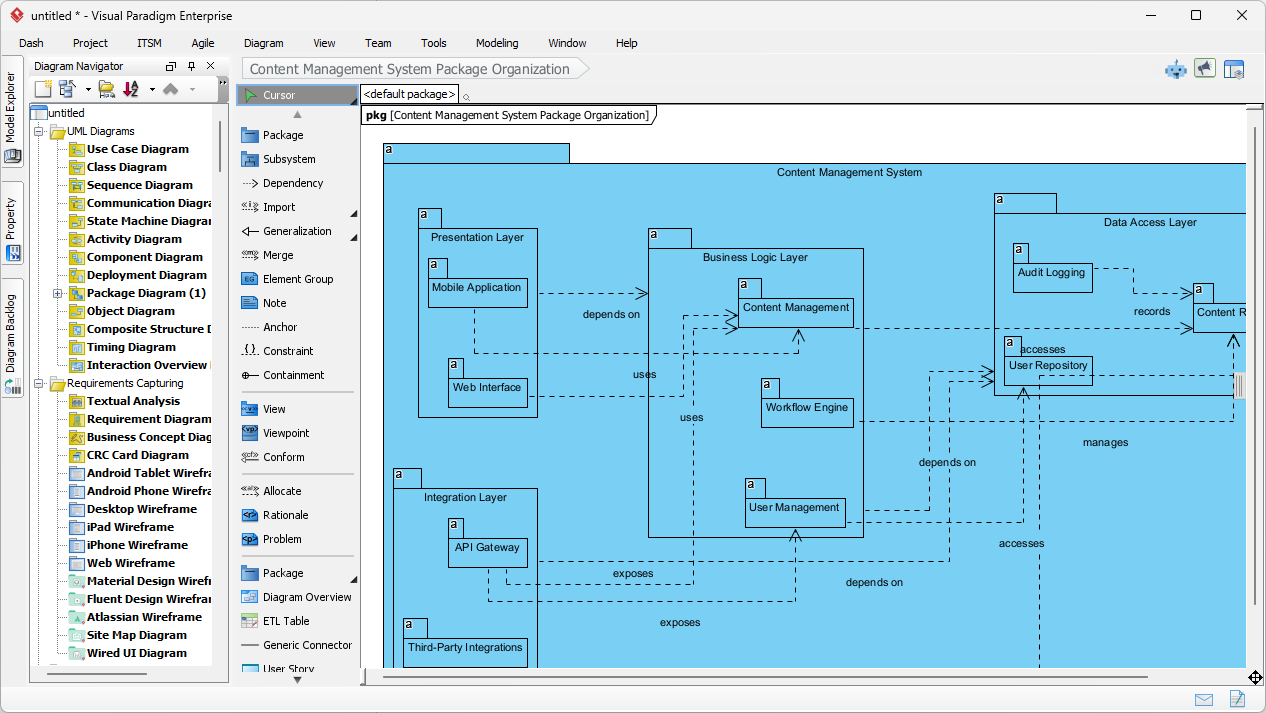
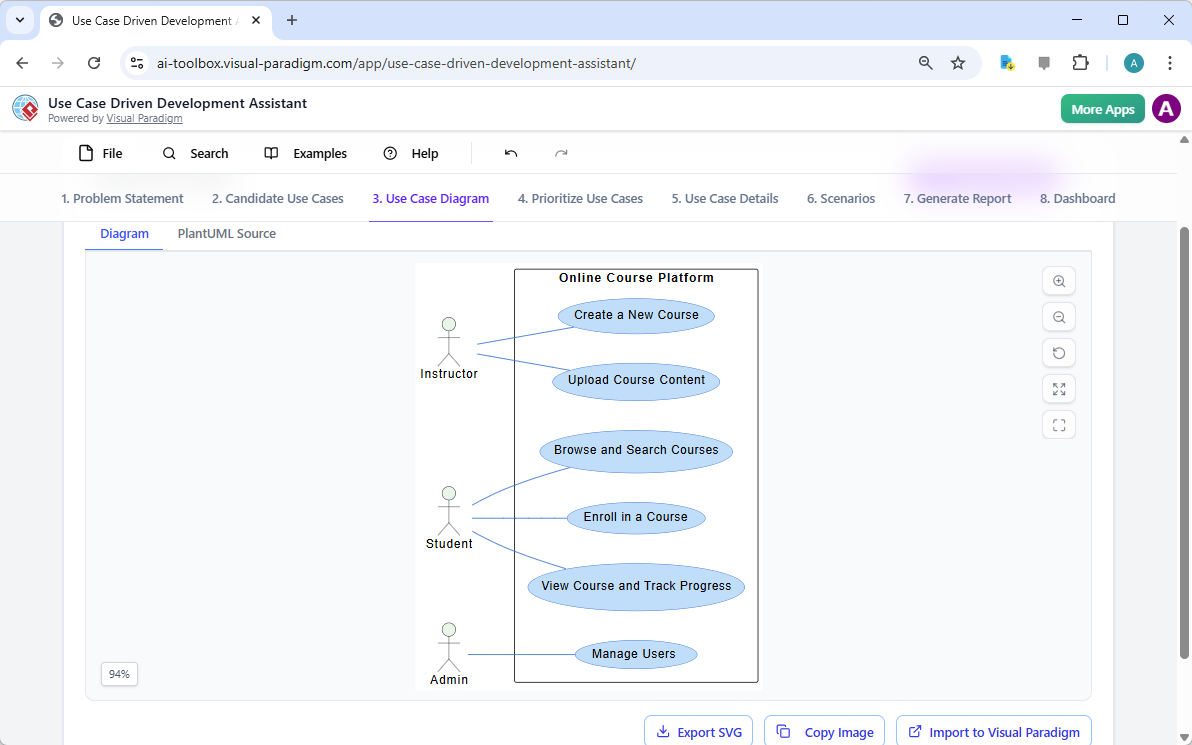
ステップ3:Use Case図を用いたシステムの可視化
Use Caseを特定した後は、それらがシステムのアクターとどのように相互作用するかを可視化することが重要です。「Use Case図」タブは、図3)に示されるように、Use Caseとアクターのリストをもとに、明確でグラフィカルな表現を自動生成します。この図は、アクター(インストラクター、学生、管理者)とシステムの機能(新しいコースを作成するなど)の関係を示しています。AIによる生成により、図は正確でプロフェッショナルなフォーマットになっています。この視覚的補助は、ステークホルダー、開発者、デザイナーがテキスト中心の文書を読まなくても、システムの範囲や機能を迅速に理解できるため、非常に価値があります。
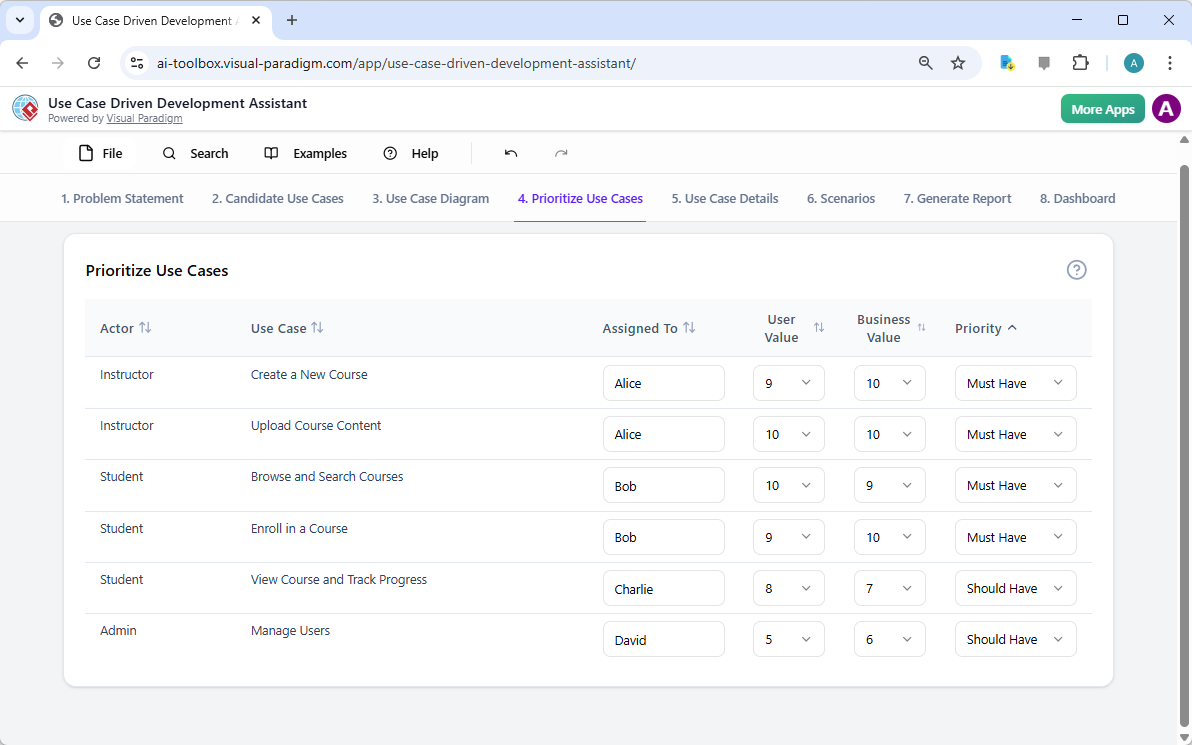
ステップ4:最大の影響をもたらす機能の優先順位付け
すべてのUse Caseが同等というわけではありません。プロジェクトの成功は、最も重要な機能を最初に注力することにかかっていることが多いです。「Use Caseの優先順位付け」タブ(画像4、これは強力なフレームワークを提供します。各ユースケースに対してユーザー価値とビジネス価値(0〜10のスケール)を割り当て、その後MoSCoW優先順位付け法(必須、重要、望ましい、保留)を適用できます。例として、AIは「新しいコースを作成する」および「コースコンテンツをアップロードする」が、プラットフォームのコア機能にとって不可欠であるため、「必須」機能であることを明らかにしました。この構造的な優先順位付けにより、開発チームはユーザーおよびビジネスに最大の価値を提供することに集中でき、低優先度の機能に無駄な努力を費やすことを防ぎます。
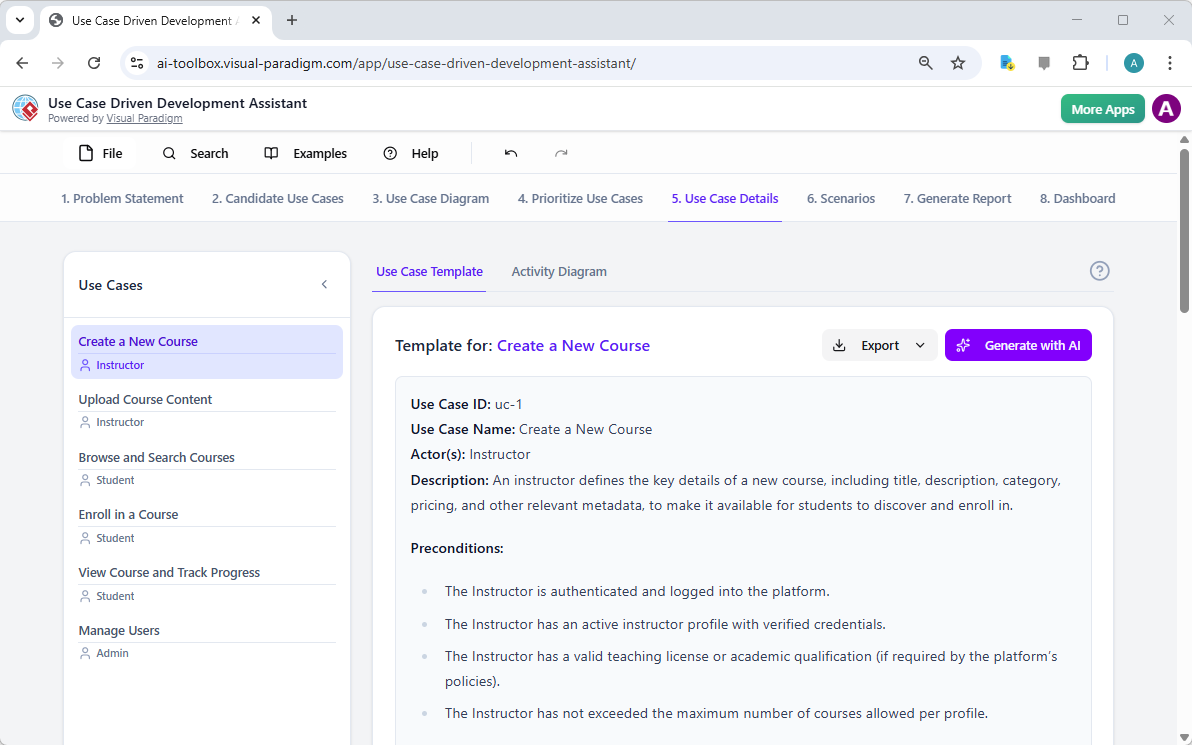
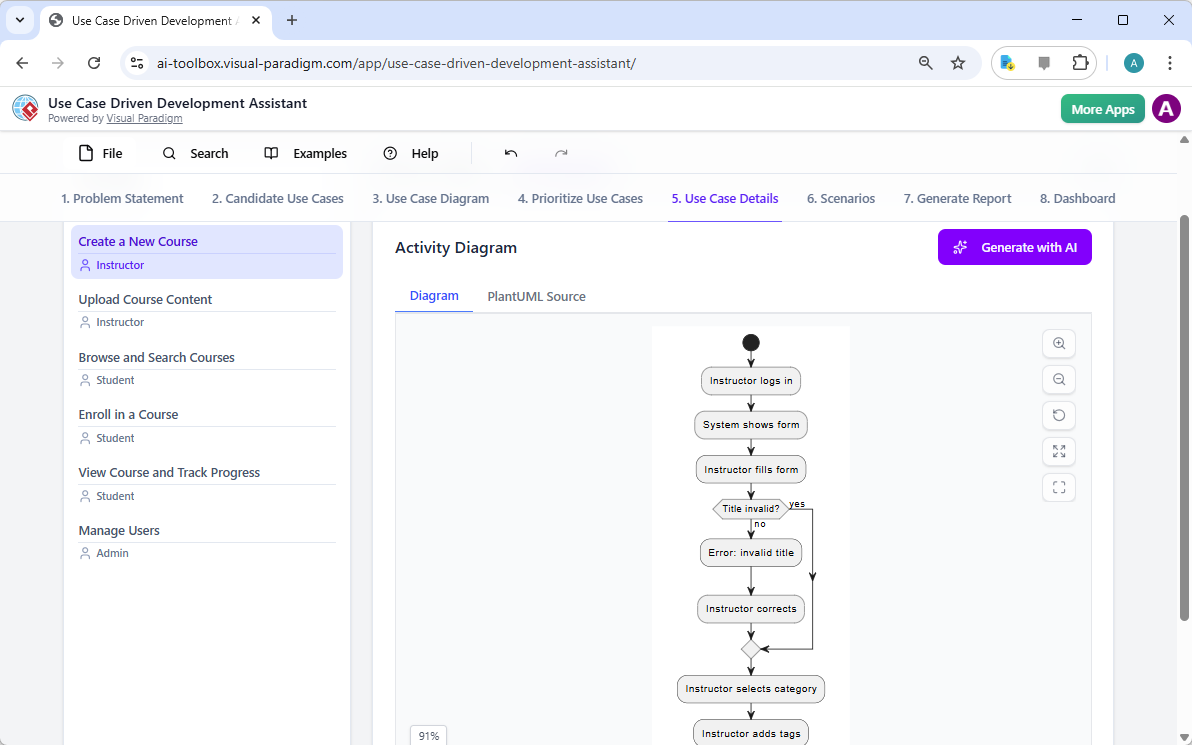
ステップ5:ユースケースの詳細化とアクティビティ図の生成
高レベルのビューを確立した後、次のステップは各ユースケースの詳細に深く入り込むことです。「ユースケース詳細」タブは、画像5、選択されたユースケース用の包括的なテンプレートを作成できます。AIは事前条件、主な流れ、代替フローを含む詳細な記述を生成できます。たとえば「新しいコースを作成する」ユースケースの場合、AIは必要な手順を明確に示す構造化されたテンプレートを提供します。理解をさらに深めるために、アシスタントは同じユースケース用に「アクティビティ図」を生成でき、画像6のように表示されます。この図は、インストラクターがログインしてからコースが保存されるまでのステップバイステップのワークフローを視覚的に示しています。このような詳細は、開発者およびQAチームにとって不可欠です。
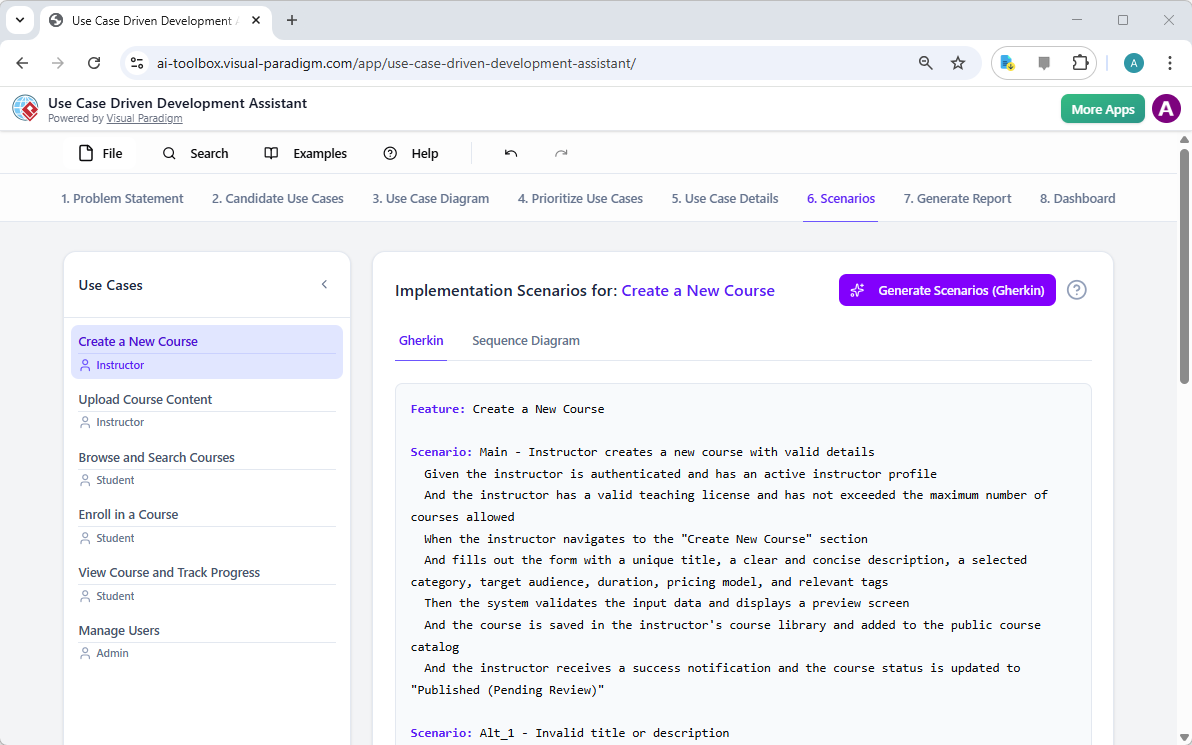
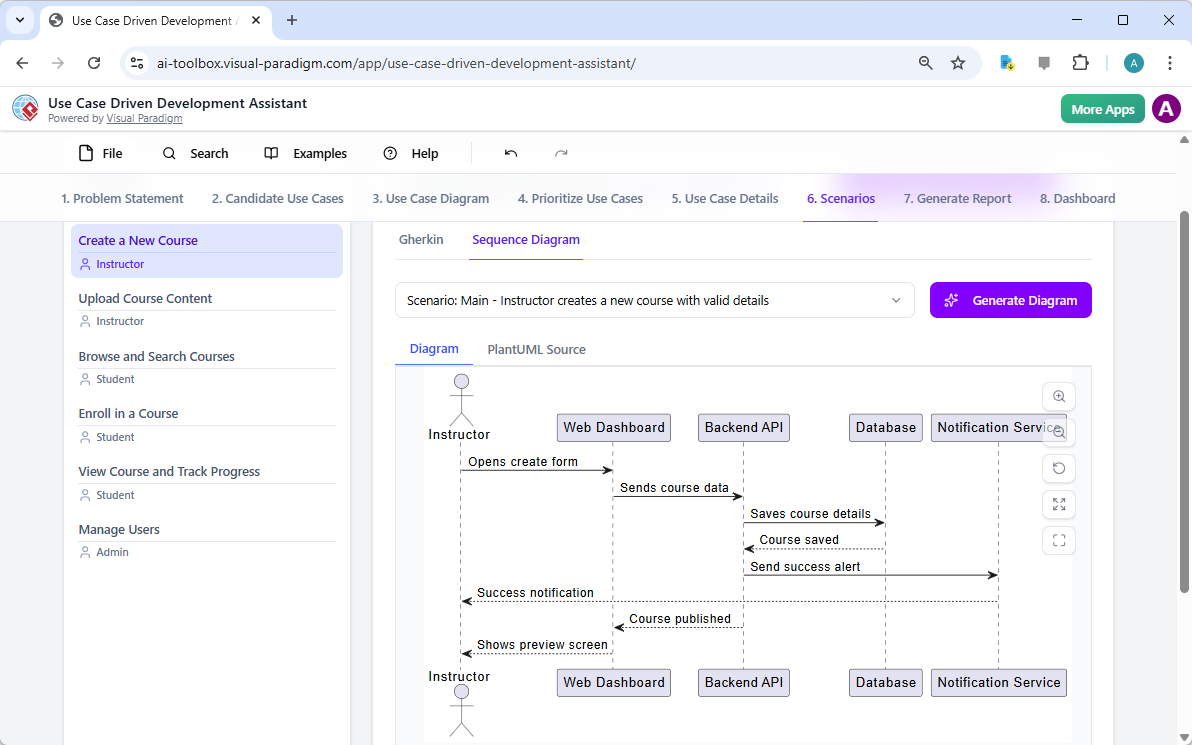
ステップ6:テストシナリオとシーケンス図の生成
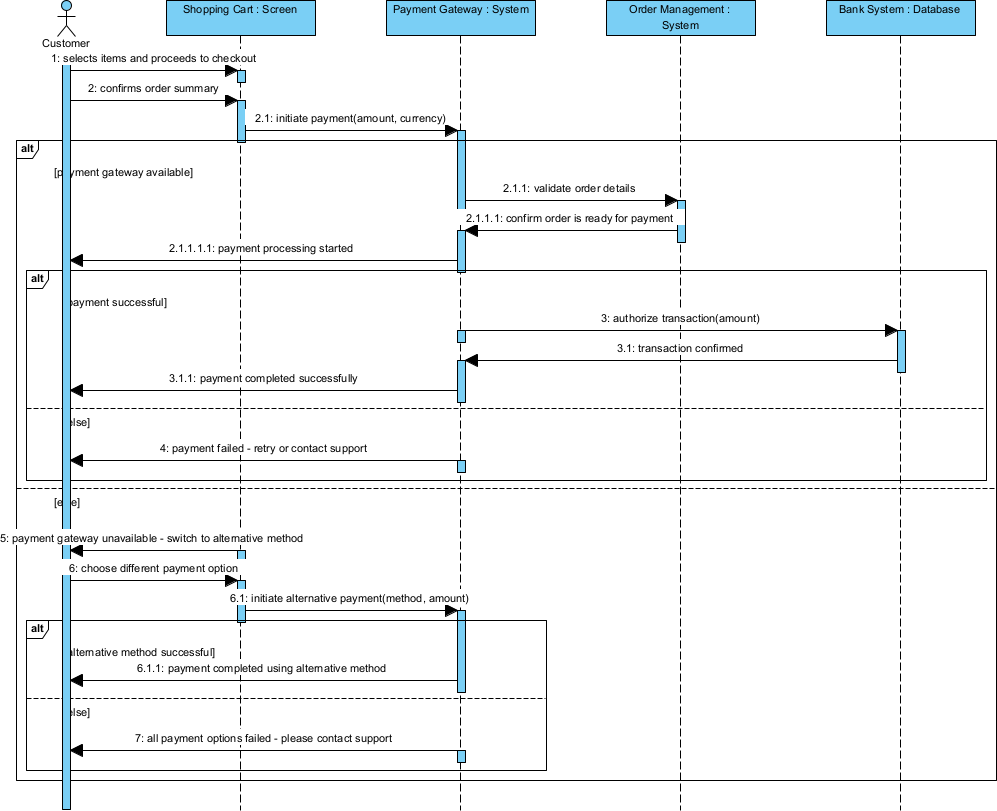
開発チームにとって、次の重要なステップはテスト可能なシナリオを作成することです。「シナリオ」タブは、画像7、ユースケースの記述から直接実行可能なGherkinシナリオを生成できます。これらのシナリオは、平易な言語(与えられた条件・実行する操作・期待される結果)で記述されており、自動テストに最適です。AIは主なシナリオと、無効なタイトルの場合の代替シナリオなどを生成できます。システムの内部動作をさらに明確にするために、アシスタントは「シーケンス図」を生成でき、画像8のように表示されます。この図は、インストラクター、Webダッシュボード、バックエンドAPI、データベース、通知サービスの間の相互作用を示しており、システムのアーキテクチャとデータフローを明確に描いています。
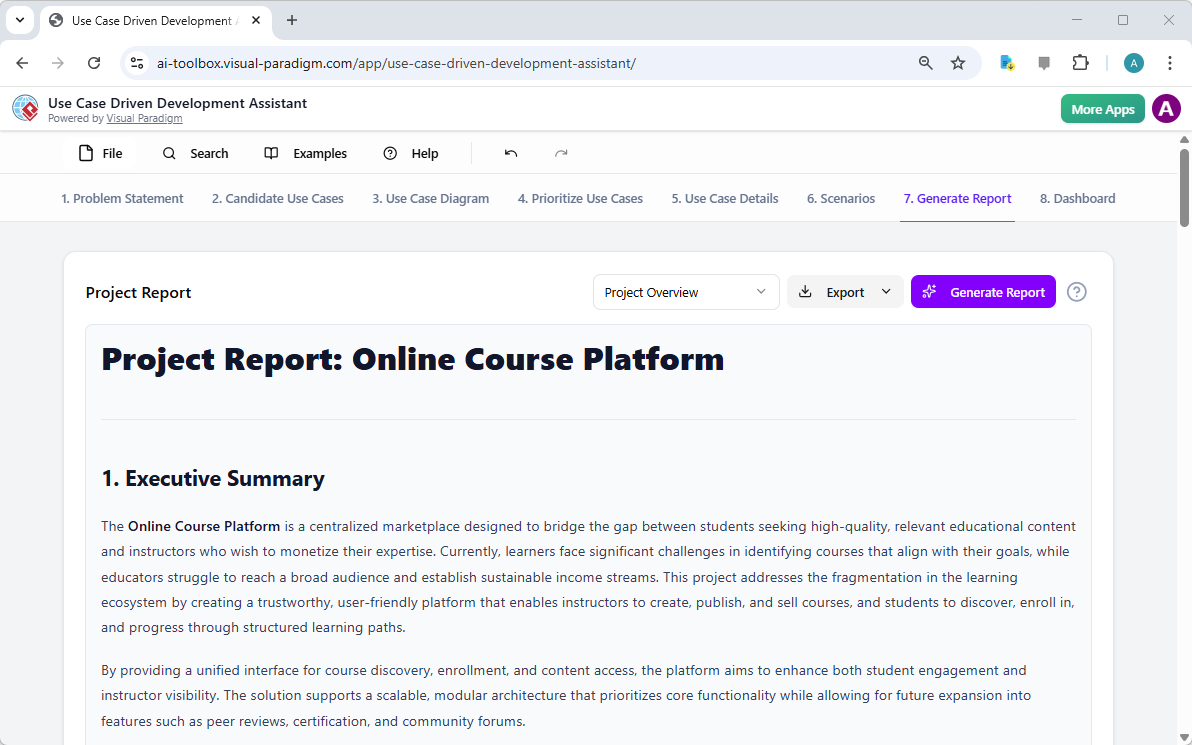
ステップ7:包括的なプロジェクトレポートの作成
開発プロセス全体を通じて、さまざまなステークホルダーにプロジェクトの状況と計画を伝えることが不可欠です。「レポートの生成」タブは、画像9のように表示され、これを容易にします。プロジェクト概要、実装計画、QAテスト計画、開発者タスクリストなど、さまざまなレポートを生成できます。これらのレポートはAIの支援を受けて作成されるため、一貫性と包括性が保証されます。たとえば、「プロジェクト概要」レポートは、経営層向け要約、主要機能、優先順位付けの根拠などを含むプロジェクト全体を要約しています。この単一の信頼できる情報源により、すべての関係者が一致した理解を持ち、情報が共有されます。
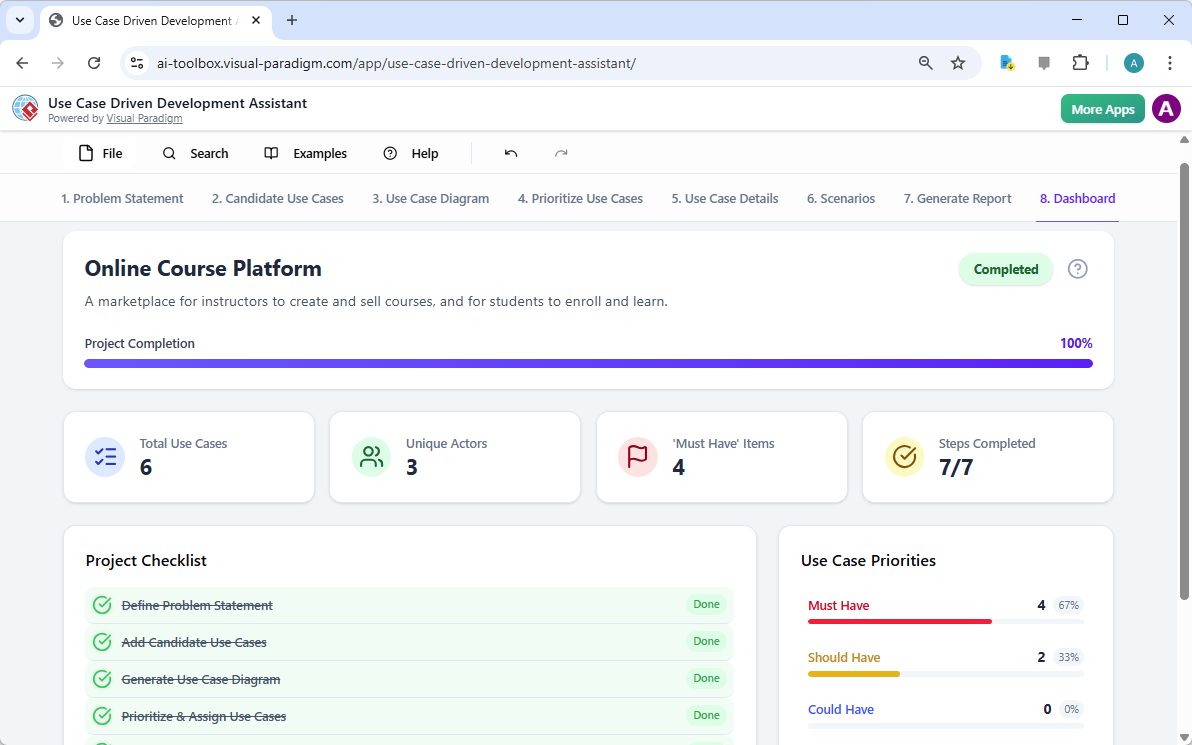
ステップ8:ダッシュボードによる進捗の追跡
最後に、このプロセスは「ダッシュボード」で完結します。画像10。この中央ハブは、プロジェクトの状況を高レベルで把握できるようにします。プロジェクトの完了率、ユースケースの総数、および「必須」項目の数を表示します。プロジェクトチェックリストにより、各ステップが完了すると「完了」にマークされ、進捗を追跡できます。プロジェクトの健全性に関するリアルタイムの可視化は、プロジェクトマネージャーやチームリーダーにとって非常に貴重であり、ボトルネックを特定し、プロジェクトが計画通りに進むように保証できます。
ユースケース駆動型開発アシスタントは単なるツール以上の存在です。ソフトウェア開発プロセスに明確さと効率をもたらす包括的なワークフローです。問題定義からレポート生成まで、AIを各段階で活用することで、チームが要件から実装へと迅速かつ正確に移行できるように支援します。その結果、ビジネス目標とユーザーのニーズに合致した、構造的で詳細に文書化されたプロジェクトが生まれます。ユースケース開発プロセスを効率化したいのであれば、このAI駆動のツールは強力な解決策です。
どうすれば次のプロジェクトを変革できるか、実際に見てみませんか?ユースケース駆動型開発アシスタントが次のプロジェクトをどのように変革できるか?今すぐ試してみましょう.
関連リンク
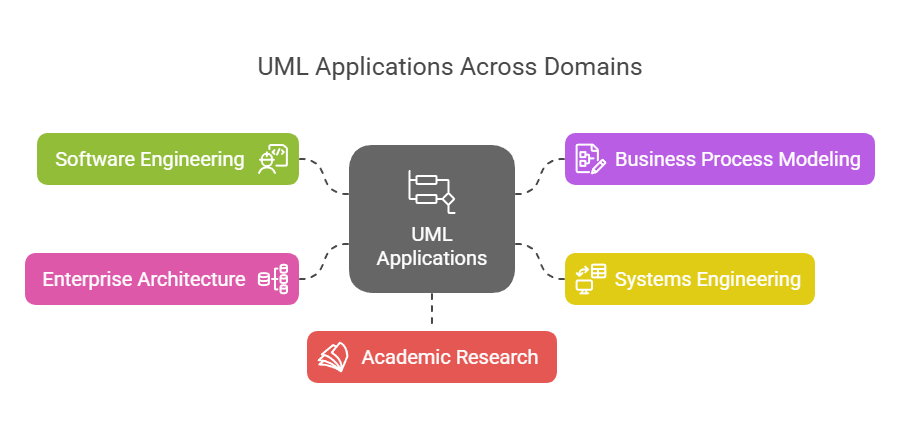
ユースケースモデリングは、機能要件を把握するために使用される基本的なソフトウェア工学技術です機能要件外部のアクターとシステムの内部機能の相互作用を可視化することで。現代のプラットフォームは現在、AI駆動の自動化図の最適化、包括的なユースケース記述を作成し、モデルをテストケースやアクティビティ図に変換して、設計の一貫性とトレーサビリティを維持する。高度なツールとして、イベントフロー編集ツールとシナリオアナライザー開発チームが構造化されたイベントシーケンスを検証および文書化し、全体的なシステムの明確性を向上させることを可能にする。
-
ユースケース図とは何か? – UMLモデリングの完全ガイド:基本的なコンポーネント、目的、およびベストプラクティス要件モデリングのためのもの。
-
ステップバイステップのユースケース図チュートリアル – 初心者からプロまで:ユーザーを基礎から応用技術まで効果的なユースケース図を作成するためのもの。
-
ユースケースモデリングについて知っておくべきすべて:ユースケースモデリングの原則と応用システム設計におけるユースケースモデリングのもの。
-
Visual Paradigm – ユースケース記述機能: 専門的なツールの詳細。ユーザーのインタラクションを正確に記録するために使用される。ユーザーのインタラクションを正確に記録する そして構造化されたシステムの挙動。
-
Visual ParadigmによるAI駆動型ユースケース図の習得: AIを活用して作成するためのチュートリアル。インテリジェントでダイナミックな図 現代のソフトウェアシステム向け。
-
Visual Paradigmのイベントフロー編集ツールの使い方ガイド: ドキュメント化のためのステップバイステップの説明。構造化されたイベントの順序 ユースケースシナリオ内での。
-
ユースケースシナリオアナライザーによるシナリオの解明: アナライザーを使用して検査および。インタラクションフローを最適化する システムの明確さを高めるために。
-
ユースケースをアクティビティ図に変換する – AI駆動の変換: その説明を提供するリソース。自動変換 ユースケースを詳細なシステムワークフローに変換する。
-
AIを用いたユースケース図からシナリオとテストケースの生成: AIツールが作成を自動化する方法についての探求。要件駆動型のテスト手順.
-
ユースケース図ギャラリー – テンプレートと例: 選りすぐりのコレクション。実際の例 インスピレーション、学習、および迅速なプロトタイピングのために。