Comprehensive Guide to Entity Relationship Diagrams (ERDs) and AI-Powered Design

In the complex world of software engineering and data management, the Entity Relationship Diagram (ERD) stands as a critical structural tool. Much like a blueprint is essential for architects to construct a safe building, an ERD allows database architects to plan, visualize, and maintain intricate data systems. This guide explores the fundamental concepts of ERDs, the stages of their development, and how modern Generative AI tools like Visual Paradigm are revolutionizing the design process.

Entity relationship diagram

1. Key Concepts of Entity Relationship Diagrams

To effectively design a database, one must first understand the core building blocks of an ERD. These diagrams map out the “nouns” of a system and the logical connections between them.

  • Entities: These represent the definable objects or concepts within a system—typically the nouns. Examples include a Student, a Product, or a Transaction. In standard visualizations, entities are depicted as rectangles.
  • Attributes (Columns): These are the specific properties that describe an entity. For a student, attributes might include names or ID numbers; for items, they could include price or SKU. These attributes are assigned specific data types, such as varchar for strings or int for integers.
  • Relationships: A crucial component that signifies how entities interact. For instance, a relationship exists when a “Student” enrolls in a “Course.”
  • Cardinality: This defines the numerical nature of the relationship between entities. Common cardinalities include one-to-one (1:1), one-to-many (1:N), and many-to-many (M:N).
  • Primary Key (PK) & Foreign Key (FK): A Primary Key is a unique identifier for a record, ensuring no duplicates exist. A Foreign Key is a reference used to link one table to the Primary Key of another, establishing the relationship.
  • Notations: Standardized visual languages are used to draw these diagrams. Chen Notation, for example, uses rectangles for entities, ovals for attributes, and diamonds for relationships.

2. Levels of Abstraction in Database Design

Creating a database is rarely a one-step process. ERDs are typically developed through three stages of “architectural maturity,” moving from abstract ideas to technical specifics.

Sync. between ER models

Conceptual ERD

This is the highest-level view, focusing on business objects and their relationships without getting bogged down in technical details. It is primarily used for requirements gathering and communication with non-technical stakeholders.

Logical ERD

At this stage, the design becomes more detailed. Attributes are explicitly defined, and keys are established. However, the model remains independent of any specific database technology (e.g., it doesn’t matter yet if you use MySQL or Oracle).

Physical ERD

This is the final technical blueprint tailored for a specific Database Management System (DBMS). It defines exact data types, column lengths, constraints, and indexing strategies required for implementation.

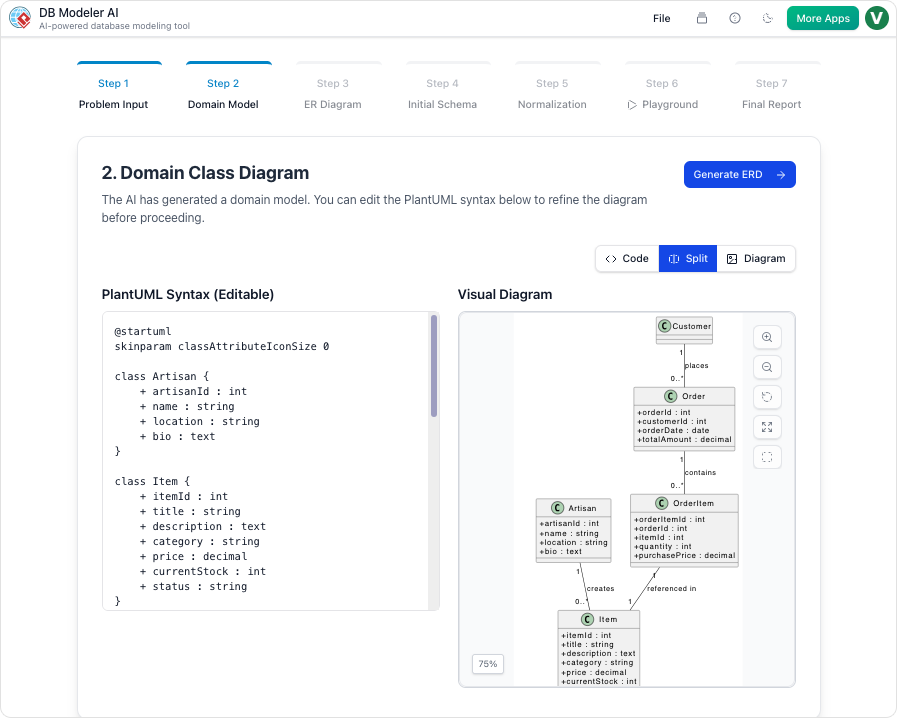
3. Accelerating Design with Visual Paradigm AI

Traditional database design can be manual and error-prone. The Visual Paradigm AI ERD tool integrates generative AI to automate complex parts of the lifecycle, transforming how engineers approach data modeling.

  • Instant Text-to-ERD: Users can describe requirements in plain English, and the AI instantly generates a structurally sound ERD complete with entities and relationships.
  • Conversational Editing: Through an AI Chatbot, designers can refine diagrams verbally. Commands like “Add payment gateway” or “Rename Customer to Buyer” are executed immediately without manual drawing.
  • Intelligent Normalization: One of the most difficult tasks in design is normalization. The tool automates optimization from 1NF to 3NF, providing educational rationales for the structural changes it makes.
  • Live Validation & Playground: The tool generates SQL DDL statements and creates an in-browser “Playground.” It seeds this environment with realistic sample data, allowing developers to test their design via queries immediately.
  • Multi-Language Support: To support global teams, the AI can generate diagrams and documentation in over 40 languages.

4. Specialized AI vs. General LLMs

While general Large Language Models (LLMs) can write text about databases, specialized tools like Visual Paradigm AI offer an engineering-grade environment.

Feature Visual Paradigm AI General AI LLM
Model Traceability Automatically keeps Conceptual, Logical, and Physical models in sync. Provides static text/code; no link between different abstraction levels.
Standards Compliance Ensures “textbook-perfect” notation (e.g., Chen or Crow’s Foot). May generate inconsistent or non-standard visual descriptions.
Engineering Integration Directly generates DDL/SQL scripts and patches existing databases. Limited to generating text-based SQL; requires manual implementation.
Live Testing Features an Interactive SQL Playground with AI-seeded data. Cannot host a “live” database environment for immediate query testing.
Visual Refinement Uses “Smart Layout” and conversational commands to arrange shapes. Cannot interact with or “clean up” a professional modeling canvas.

Summary: The Architect vs. The Friend

To understand the difference between using a general AI chatbot and a specialized ERD tool, consider this analogy: Using a general LLM for database design is like having a knowledgeable friend describe a house to you. They can tell you where the rooms should go, but they cannot give you a blueprint that the city will approve.

DBModeler AI showing domain class diagram

In contrast, using the Visual Paradigm AI tool is like hiring a certified architect and an automated builder. They draw the legal blueprints, ensure the infrastructure meets code (normalization), and build a small-scale model you can actually walk through (SQL playground) to verify functionality before the real construction begins. By bridging the gap between natural language and production-ready code, specialized AI ensures data integrity and drastically reduces architectural debt.

Visualizing Business Strategy: Creating a CAT Infographic with AI

Visual Paradigm’s AI tool transforms business strategies into engaging CAT infographics, simplifying complex narratives into clear visual stories.

Visual Paradigm’s AI-Powered Infographic Designer is a professional tool for transforming complex business narratives into compelling visual stories. This application enables users to generate content-rich, structured infographics based on a three-part framework, such as CAT (Challenge, Approach, Triumph), in minutes. The process begins with a simple input: a topic and a chosen analysis type. The AI then analyzes this information and populates a visually engaging infographic with relevant content, eliminating the need for manual design. This tool is ideal for professionals seeking to communicate strategic insights, such as overcoming a market competitor, with clarity and impact. Its intuitive interface and powerful AI capabilities make it an essential asset for anyone who needs to present a three-part analysis.

Creating a professional infographic from scratch is often a time-consuming process. It requires not only design skills but also a deep understanding of the subject matter to structure the information effectively. The Three Aspects Infographic Designer addresses these challenges by automating the core content generation. Users can focus on refining the message rather than crafting the visual presentation. The tool’s AI engine generates relevant content for each of the three aspects, providing a strong starting point for any analysis. This approach is particularly beneficial for business strategists, product managers, and marketing professionals who need to convey complex ideas quickly and clearly. By leveraging AI, the designer empowers users to create polished, professional visuals that enhance communication and drive results.

Quick Summary

  • AI-Powered tool for creating 3-part infographics.

  • Generate content for frameworks like CAT (Challenge, Approach, Triumph).

  • Choose from 50+ customizable styles and animations.

  • Save, share, and present your infographics professionally.

How the Three Aspects Infographic Designer Works

The workflow of the Three Aspects Infographic Designer is designed for speed and simplicity. The process begins on the main interface, where users enter a topic and select an analysis type. As shown in:

Visual Paradigm’s AI-Powered Three Aspects Infographic Designer's landing screen, where users begin by entering a brief descr

The user has input the topic “Overcoming a Market Competitor” and selected the “CAT (Challenge, Approach, Triumph)” framework. This initial step is crucial, as it guides the AI to generate relevant content for each of the three distinct aspects. The AI analyzes the topic and the selected framework to produce a comprehensive analysis, populating the infographic with content that is both relevant and structured. This automation significantly reduces the time and effort required to create a professional-quality visual.

Once the AI generates the content, users can customize the infographic to fit their specific needs. The interface provides a range of customization options, including various visual styles and text animations. Users can select from 50+ different layouts to present the three aspects in a way that best suits their audience and presentation style. The animation effects, such as “Fade In” or “Slide Up,” can be adjusted to enhance engagement. This level of control allows users to fine-tune the visual appeal and impact of their infographic. The ability to edit the content directly within the design interface ensures that the final product accurately reflects the user’s insights and data.

Creating a Professional CAT Infographic

The Three Aspects Infographic Designer excels at creating structured, professional visuals for strategic analysis. The CAT (Challenge, Approach, Triumph) framework is a powerful tool for summarizing a business journey. As demonstrated in:

This is the screenshot of Visual Paradigm’s AI-Powered Three Aspects Infographic Designer. In the previous step the user has

The tool generates a clean, well-organized infographic that clearly delineates the three key stages of a business strategy. The “Challenge” section highlights the problem, the “Approach” section details the solution, and the “Triumph” section showcases the results. This structure makes it easy for stakeholders to understand the narrative and the impact of the strategy. The AI-generated content provides a solid foundation, which users can then refine to add specific data, insights, or company-specific details.

Customization is a key feature of the designer. Users can adjust the layout, choose different color schemes, and apply various text animations to make the infographic more engaging. The ability to preview different styles allows users to find the best visual representation for their content. For example, a more formal presentation might use a clean, minimalist layout, while a creative pitch could benefit from a more dynamic and colorful design. The tool also allows users to save their projects to the cloud, ensuring that their work is secure and accessible from any device. This cloud-based project management is essential for collaboration and ensures that users can work on their infographics from anywhere.

Sharing and Presenting Your Insights

Once an infographic is complete, sharing it with others is a simple process. The Three Aspects Infographic Designer includes a dedicated “Share” function, as shown in:

This is the screenshot of Visual Paradigm’s AI-Powered Three Aspects Infographic Designer. It shows the share screen - user c

Users can generate a unique URL to share their infographic with colleagues, clients, or stakeholders. This link opens the infographic in a read-only “viewer mode,” which ensures that the recipient can view the content without the ability to edit it. This is particularly useful for presentations, as it provides a clean, professional interface for sharing insights. The shared link can be easily copied and sent via email or messaging platforms, making it simple to distribute the infographic to a wide audience.

Sharing an infographic is more than just sending a link; it’s about enabling effective communication. The visual nature of the infographic makes complex information more digestible and memorable. By presenting a three-part analysis in a clear, structured format, the designer helps users communicate their strategic thinking more effectively. This can lead to better decision-making, improved collaboration, and stronger business outcomes. The ability to share a professional, animated infographic with a single click makes it easy for users to present their insights in a compelling way.

Conclusion

Visual Paradigm’s AI-Powered Three Aspects Infographic Designer is a powerful tool for anyone who needs to communicate a three-part analysis. By automating the content generation process, it allows users to focus on refining their message and creating a visually appealing presentation. The tool’s intuitive interface, extensive customization options, and seamless sharing capabilities make it an essential asset for business strategists, product managers, and marketing professionals. Whether you are analyzing a new product launch, presenting a quarterly business review, or outlining a strategic plan, this tool can help you create a professional infographic that effectively communicates your insights.

Related Links

Ready to transform your complex ideas into clear, visual stories? Try the Three Aspects Infographic Designer today and see how it can revolutionize your communication.

  • AI 5- Aspects Infographic Designer & Generator: AI -Powered 5- Aspects Infographic Designer .The 5- Aspects Infographic Designer guides you through creating comprehensive, animated five-part visuals suitable for complex strategies, models, or transformation roadmaps.

  • AI -Powered 6- Aspects Infographic Designer: AI -Powered 6- Aspects Infographic Designer . Transform Complex Strategies into Stunning Visuals Instantly.The 6- Aspects Infographic Designer leads you through a methodical process for designing compelling six-part infographics tailored to complex strategic communication.

  • 8-Aspects Infographic Designer | AI-Powered Strategic …: 8- Aspects Infographic Designer Effortlessly turn 8-factor frameworks into clear, compelling infographics . Powered by AI , this tool supports models like 8P, 8C, and custom 8- aspect analyses, giving you complete control to edit every layout and detail.

  • Create McKinsey 7S Infographics with AI | Visual Paradigm: The Seven Aspects Infographic Designer from Visual Paradigm is the ultimate tool for anyone who needs to visualize complex information. Whether you’re analyzing organizational change, developing a product strategy, or conducting academic research, this AI -powered software makes it fast, easy, and professional.

Creating a Food Safety Strategy: An AI-Powered OKRs Framework Tool Guide

Use an AI-powered OKRs framework tool to create a strategic food safety plan with measurable goals, responsibilities, and progress tracking for food processing businesses.

Use the AI-Powered OKRs Framework Tool to define and track ambitious goals for food safety, supply chain efficiency, and sustainability. This professional, step-by-step application guides you through a 5-step wizard to set clear Objectives, establish measurable Key Results, assign responsibilities, and monitor progress. With Visual Paradigm‘s powerful AI assistance, you can generate a complete OKR plan based on your business context, significantly accelerating your goal-setting and alignment processes. The final output is a professional report that consolidates your entire OKR plan for review and execution. This tool is ideal for business leaders, team managers, and strategic planners in the food processing and packaging industry.

Key takeaways

  • Use an AI-powered OKRs Framework Tool to generate a complete goal-setting plan in minutes.

  • Follow a structured 5-step workflow: Define Objectives, Establish Key Results, Assign Responsibilities, Monitor & Review, and Final Report.

  • Save and print your OKR plan as a professional report for team review and communication.

  • Keep your strategic data private by saving your plan locally to your computer.

Defining Objectives with AI Guidance

Begin your goal-setting journey with the AI-Powered OKRs Framework Tool. The first step is to provide essential context about your organization. In this example, the user enters “GreenHarvest Foods” as the business name, “Food Processing & Packaging” as the industry, and a detailed business description. This information serves as crucial context for the AI, ensuring its suggestions are relevant to your specific project. The tool then uses this data to generate a comprehensive OKR framework. The AI suggests ambitious, qualitative objectives that align with the company’s strategic focus areas. The tool provides a dynamic table where you can easily add, edit, or delete objectives. The interface is intuitive, similar to a well-designed spreadsheet, allowing for quick and efficient data input. Use the AI to generate a first draft of your OKR plan in minutes.

This is the screenshot of Visual Paradigm's AI-Powered OKRs Framework Tool. It is now at AI generation screen, where the userThis is the screenshot of Visual Paradigm's AI-Powered OKRs Framework Tool. The initial data is generated by AI and it is now

Establishing Measurable Key Results

After defining your objectives, the next phase is to establish measurable Key Results (KRs) for each one. The AI-generated objectives are now populated in a structured table. The tool guides you through this process, prompting you to define specific, quantifiable outcomes. For instance, the objective “Elevate Food Safety Standards” is paired with a KR to “Achieve 100% compliance with HACCP and ISO 22000 audits.” The tool also helps define target metrics, timeframes, and responsible parties. This ensures your goals are not just ambitious but also measurable and actionable. The dynamic table allows you to easily add, edit, or delete rows, making it simple to refine your plan. The AI provides plausible examples based on your business context, which you can then validate and refine with your team’s insights. Key Results are measurable outcomes that define how you will achieve an Objective.

This is the screenshot of Visual Paradigm's AI-Powered OKRs Framework Tool. It is now at step 2 - Professional online diagram

Assigning Responsibilities and Timelines

With objectives and key results defined, the next step is to assign responsibilities and set timelines. This phase ensures accountability and clarity across your organization. The AI-generated data is now used to populate a table where you can assign specific tasks to responsible teams and individuals. For example, the task “Implement quarterly internal audit schedule” is assigned to the Quality Assurance Team with a deadline at the end of Month 3. The tool provides a clear, organized view of all assigned responsibilities, making it easy to track who is accountable for what. This structured approach fosters a culture of ownership and ensures everyone is working towards the same strategic priorities. The dynamic table allows you to easily add, edit, or delete rows to reflect your team’s structure and project needs. Assigning responsibilities improves transparency and accountability.

This is the screenshot of Visual Paradigm's AI-Powered OKRs Framework Tool. It is now at step 3 - Professional online diagram

Monitoring and Reviewing Progress

Effective goal management requires continuous monitoring and review. The tool guides you through this phase, helping you define how progress will be tracked. You can specify monitoring methods, such as reviewing audit logs or analyzing supplier performance dashboards. The tool also prompts you to define review frequencies, like monthly audit review meetings or bi-weekly supplier scorecard reviews. Additionally, it allows you to create adjustment plans for when targets are not met, such as increasing training sessions if non-conformities exceed a certain threshold. This ensures your OKR plan remains dynamic and adaptable. The structured approach provides a clear roadmap for tracking progress and making necessary adjustments. Data-driven progress tracking enables objective evaluation of your OKR plan.

This is the screenshot of Visual Paradigm's AI-Powered OKRs Framework Tool. It is now at step 4 - Professional online diagram

Generating a Professional Final Report

The final step in the process is to generate a consolidated, professional report. This report brings all your OKR data together in a single, easy-to-read document. It includes an executive summary, a detailed overview of your defined objectives, established key results, assigned responsibilities, and monitoring strategies. The report is designed to drive goal-oriented action and accountability. You can use your browser’s print function to print a hard copy or save the report as a PDF for easy sharing with your team and stakeholders. This final report serves as a comprehensive overview of your entire OKR framework, perfect for strategic reviews and communication. Generate a professional report to share your OKR plan with your team and for strategic reviews.

This is the screenshot of Visual Paradigm's AI-Powered OKRs Framework Tool. It is now at step 5. A report is produced to summ

Accelerate Your OKR Planning with AI

The AI-Powered OKRs Framework Tool is designed to help individuals, teams, and organizations achieve ambitious goals. By providing a structured 5-step workflow, the tool ensures a logical and thorough approach to OKR planning. The AI-powered generation feature allows you to create a comprehensive first draft of your entire OKR plan in minutes, allowing you to focus on refinement and execution. The tool’s dynamic tables and interactive editing features make it easy to input and manage your plan data. All your strategic data is saved locally to your computer, ensuring your sensitive business strategies remain confidential. The final report presents your OKR plan in a professional, easy-to-understand format, perfect for strategic reviews and communication. Accelerate your OKR planning with AI to achieve ambitious goals and enhance focus and alignment.

Ready to define your strategic goals? Try the AI-Powered OKRs Framework Tool today and see how it can transform your goal-setting process. Try Now.

Related Links

Crafting a Crystal-Clear Problem Statement for Software Development

Use Visual Paradigm’s AI-powered tool to craft clear, structured problem statements for software projects with templates and real-time feedback.

Struggling to articulate the core challenge your software project aims to solve? The Problem Description Generator from Visual Paradigm is the ultimate AI-powered tool to transform your project’s initial chaos into a clear, focused, and compelling narrative. This innovative solution empowers project managers, business analysts, and product owners to define the “why” behind their work with unprecedented speed and precision. By leveraging a library of structured templates and real-time AI feedback, this tool ensures your problem statement is not just written, but optimized for maximum impact from day one. It’s the secret weapon for launching projects with laser focus and setting the stage for success.

Key Takeaways:

  • Use a template-driven approach to ensure your problem statement is comprehensive and structured.

  • Fill in specific variables to customize the description for your unique project.

  • Get instant AI feedback to refine your problem statement for clarity and effectiveness.

  • Start any project with a solid, well-articulated understanding of the core issue.

Step 1: Choose Your Template – The Foundation of a Strong Problem Statement

Every great project begins with a solid foundation, and for a problem statement, that foundation is the right template. The first step in using the AI-Powered Problem Description Generator is to select a template that perfectly aligns with your project’s nature. As shown in

This is a screenshot of Visual Paradigm's AI Powered Problem Description Generator. It shows the first step, which involves c

, the interface presents a clean, intuitive dashboard with a variety of templates for different business needs. Whether you’re tackling a software development initiative, optimizing a business process, or conducting a strategic analysis like a SWOT or PEST analysis, you can find a dedicated template. The “Software System Development” template, for instance, is specifically designed to help you create comprehensive software system requirements and specifications. By selecting the correct template, you immediately establish a professional structure that guides you to cover all critical aspects of the problem, ensuring no vital detail is overlooked. This step is crucial because it sets the tone and framework for the entire problem description, making the subsequent steps much more efficient and effective.

Step 2: Fill in the Variables – Customize Your Narrative

Once you’ve chosen your template, the magic happens in the “Edit Parameters” section.

This is a screenshot of Visual Paradigm's AI Powered Problem Description Generator. It shows the second step, which involves

vividly illustrates this second step. On the left, you’re presented with a form filled with specific fields, such as “Organization Name,” “Current Problem/Inefficiency,” and “Type of Software System.” This is where you inject your project’s unique DNA. As you type in the details, the tool’s real-time preview on the right side dynamically updates, showing you exactly how your filled-in variables will look in the final problem description. This live preview is incredibly powerful. It allows you to see the narrative form your inputs are creating, spot any awkward phrasing, and make adjustments on the fly. The variables are highlighted in green, making it easy to see exactly what content is being inserted into the template. This process is not just about filling blanks; it’s about shaping a coherent story that clearly explains the problem, its impact, and the desired outcome. The ability to see your description evolve in real-time is a game-changer for clarity and confidence.

Step 3: Review with AI – Your Instant Expert Editor

The final, and arguably most powerful, step is the AI review. After you’ve filled in all the variables and are satisfied with the live preview, you can click the “Review with AI” button.

This is a screenshot of Visual Paradigm's AI Powered Problem Description Generator. Once the details are filled in, you can c

captures this moment perfectly. A modal window appears, presenting a detailed analysis of your generated problem statement. The AI doesn’t just check for grammar; it evaluates the statement for clarity, completeness, logical flow, and the use of appropriate business terminology. It provides a clear “Status” (like “OK”) and a detailed “AI Analysis” that highlights strengths and suggests improvements. For example, the AI might confirm that your statement is clear and professionally written, or it might suggest a more impactful way to phrase a key objective. This instant, objective feedback acts as a virtual expert editor, helping you refine your problem statement to ensure it is not only correct but also highly effective in communicating the project’s purpose. This final step ensures that your problem statement is ready to be shared with stakeholders, developers, or clients with confidence.

Unlock Your Project’s Potential

Defining a problem is often the hardest part of any initiative. A vague or poorly articulated problem statement can lead to wasted effort, misaligned solutions, and ultimately, project failure. The Problem Description Generator from Visual Paradigm solves this fundamental challenge. It combines the power of structured templates with the intelligence of AI to create a workflow that is both efficient and effective. By following the three simple steps—choose a template, fill in the variables, and review with AI—you can transform your initial project idea into a clear, compelling, and professional problem statement in minutes. This tool is not just a convenience; it’s a strategic advantage that ensures your project starts on the right foot. Stop guessing and start defining with confidence. Try the AI-Powered Problem Description Generator now and experience the difference it makes.

Related Links

Dominate Your Market with Visual Paradigm’s AI Porter’s Five Forces Analyzer

Dominate your market with Visual Paradigm’s AI Porter’s Five Forces Analyzer. Generate fast, professional industry reports with actionable strategic insights.

Unlock the secrets of your industry and outmaneuver the competition with the AI-powered Porter’s Five Forces Analyzer from Visual Paradigm! In today’s fast-paced business environment, understanding the structural forces that shape your profitability isn’t just an advantage—it’s a necessity for survival. Whether you are a startup founder or a seasoned strategist, this professional industry analysis tool provides the clarity you need to make winning decisions. The landing screen invites you into a seamless experience where you simply describe your business to ignite a high-level strategic engine that works for you!

As seen in the initial setup, users can input specific details like business name and industry context—such as a cutting-edge medical diagnostics firm—to receive a tailored analysis. This intelligent interface acts as your personal consultant, bridging the gap between raw data and actionable intelligence.

Visual Paradigm’s AI-Powered Porter's Five Forces Analysis Tool landing screen, where users begin by entering a brief busines

Why Every Business Needs an AI-Powered Strategic Edge

Conducting a manual industry study can take days of grueling research. However, with Visual Paradigm’s easy-to-use strategic planning software, you can generate a comprehensive draft in seconds! This tool doesn’t just list facts; it interprets the competitive intensity of your specific market niche, allowing you to focus on high-level validation rather than tedious data entry. It is the ultimate best industry analysis tool for those who value both speed and precision.

Quick Summary of Key Benefits

  • Lightning-Fast Analysis: Generate a full Five Forces report in minutes using advanced AI assistance.

  • Structured 7-Step Logic: Follow a proven, professional workflow that leaves no stone unturned.

  • Total Privacy: Save your sensitive strategic data locally as .json files—no cloud storage required!

  • Actionable Intelligence: Move beyond theory with specific strategic recommendations tailored to your business.

  • Professional Output: Produce high-quality reports perfect for stakeholder presentations and board meetings.

Step 1: Confronting the Threat of New Entrants

The first step in any robust analysis is evaluating how easy it is for new players to enter your territory. Using the AI-powered Porter’s Five Forces Analyzer, you can identify critical barriers to entry such as regulatory requirements, capital costs, and the need for specialized domain expertise. In the example of an AI medical firm, the tool highlights how FDA clearances and deep medical knowledge act as powerful shields for established players.

By rating these factors as Low, Medium, or High, you gain an immediate visual representation of your market’s defensibility. This online strategic tool ensures that you are never blindsided by a new competitor appearing overnight!

The screenshot of Step 1 of Visual Paradigm AI-Powered Porter's Five Forces Analysis Tool. - Professional online diagram make

Step 2: Evaluating the Bargaining Power of Suppliers

Are your suppliers squeezing your margins? Step 2 of the workflow focuses on the Bargaining Power of Suppliers. This section helps you identify if your business is overly dependent on a few key providers, such as specialized AI talent or unique data providers. Identifying these bottlenecks early allows you to develop diversification strategies before they become critical issues.

The interactive dynamic tables allow you to add custom rows and refine AI-generated suggestions, ensuring the analysis reflects the “on-the-ground” reality of your supply chain. It’s strategic management made simple and effective!

The screenshot of Step 2 of the Visual Paradigm  AI-Powered Porter's Five Forces Analysis Tool. - Professional online diagram

Step 3: Mastering the Bargaining Power of Buyers

Your customers are your lifeblood, but their power to drive down prices can be a major threat. In Step 3, the best AI-powered Porter’s Five Forces Analyzer examines the Bargaining Power of Buyers. For a medical tech company, this might involve analyzing the negotiating leverage of large healthcare institutions or the low switching costs that might reduce brand loyalty.

Understanding these dynamics is crucial for your pricing strategy. By recognizing when buyer power is high, you can shift your focus toward differentiation and value-added services that make your product indispensable.

The screenshot of Step 3 of the Visual Paradigm  AI-Powered Porter's Five Forces Analysis Tool. - Professional online diagram

Step 4: Identifying the Threat of Substitute Products

Competition doesn’t always come from direct rivals; sometimes, it comes from entirely different ways of solving the same problem. Step 4 guides you through identifying the Threat of Substitutes. Whether it’s traditional human expertise competing against AI or a completely new technology, this tool ensures you are looking at the big picture.

Rating the intensity of these substitutes helps you prioritize which threats need the most attention in your marketing and R&D efforts. With this professional-grade analysis software, you’ll always stay one step ahead of market shifts!

The screenshot of Step 4 of the Visual Paradigm  AI-Powered Porter's Five Forces Analysis Tool. - Professional online diagram

Step 5: Navigating Rivalry Among Existing Competitors

The final force in the framework is the Rivalry Among Existing Competitors. This is often where the most intense pressure is felt, characterized by price wars, aggressive advertising, and rapid innovation. The tool prompts you to assess the number of competitors and the rate of industry growth to determine the overall heat of the market.

In a crowded field like AI healthcare, understanding the “innovation race” is vital. This step helps you visualize the competitive landscape so you can find “Blue Ocean” opportunities where rivalry is less intense.

The screenshot of Step 5 of the Visual Paradigm  AI-Powered Porter's Five Forces Analysis Tool. - Professional online diagram

Step 6: Developing Winning Strategic Recommendations

An analysis is only as good as the actions it inspires! Step 6 of the AI-powered Porter’s Five Forces Analyzer is where the magic happens. Based on the data gathered in the previous steps, the AI suggests powerful strategic recommendations. These might include pursuing specific certifications, forming strategic partnerships, or creating tiered pricing models to capture more market share.

This is where you transform insights into a roadmap for success. You can edit these recommendations to align perfectly with your company’s unique vision and resource capabilities.

The screenshot of Step 6 of the Visual Paradigm  AI-Powered Porter's Five Forces Analysis Tool - Professional online diagram

Step 7: Generating Your Professional Final Report

The culmination of your hard work is a consolidated final report. Step 7 gathers every factor, impact rating, and recommendation into a professional, easy-to-read format. This is the document that wins over investors and aligns your team. It includes an executive summary and a detailed breakdown of each force, providing a complete 360-degree view of your industry’s attractiveness.

You can print this report directly or save it as a PDF, making it incredibly easy to share with stakeholders or include in your formal business plan. It’s the ultimate deliverable for any serious business professional!

The screenshot of Step 7 of the Visual Paradigm  AI-Powered Porter's Five Forces Analysis Tool, displaying the automatically

Master Your Strategy Today!

There has never been a better time to take control of your competitive destiny. Visual Paradigm’s AI-powered Porter’s Five Forces Analyzer is designed to empower you with the insights needed to thrive in any industry. From identifying hidden threats to capitalizing on untapped opportunities, this tool is your gateway to strategic excellence. Don’t leave your success to chance—base your decisions on the gold standard of industry analysis!

Ready to see where your business stands in the competitive landscape? Use this easy-to-use strategic planning tool to transform your industry knowledge into a defensible competitive advantage right now!

Experience the power of AI-driven strategy:

Try the Porter’s Five Forces Analyzer Now!

Learn more about our innovative strategic tools.

Related Links

Animate Your Perfect Beach Vacation Story with the AniFuzion Online Animation Maker

Bring your beach vacation stories to life with AniFuzion’s online animation maker. Create professional 3D videos easily in your browser.

Have you ever dreamed of whisking your audience away to a tropical paradise without ever leaving your desk? Capturing the warmth of the sun and the rhythmic, soothing sound of the ocean waves is now easier than ever! With a professional and easy-to-use online animation maker like AniFuzion by Visual Paradigm, you can transform a simple summer memory into a vibrant, moving masterpiece that speaks directly to your viewers’ hearts. Whether you are a teacher looking to brighten a lesson or a marketer wanting to add some sunshine to your brand, the power of animation is now right at your fingertips!

Imagine a scene where friends gather on a golden shore, the palm trees sway gently in the breeze, and a colorful umbrella provides the perfect spot for a conversation. In our featured example, we see a group of 3D characters enjoying a beautiful day at the beach. One character is even sharing her excitement through a speech bubble, inviting her friends for a refreshing swim. This isn’t just a static picture; it is a snapshot of a living world created entirely within a browser, proving that you don’t need a Hollywood studio to tell a compelling story.

This is a snapshot of an animation developed with Visual Paradigm's animation maker (aka. AniFuzion). The animation is about

The Challenge of Creating Engaging Visuals

We have all been there—you have a fantastic idea for a story or a presentation, but you feel held back because you aren’t a professional graphic designer or a computer programmer. Traditional animation software often feels like trying to fly a spaceship; there are too many buttons, the learning curve is steep, and the cost can be overwhelming. Many creators settle for static images or boring slideshows, but these rarely capture the full attention of an audience in our fast-paced digital world.

This is exactly where an AI-powered online animation maker steps in to save the day! The problem isn’t your lack of creativity; it’s simply that the tools of the past weren’t built for everyone. By using a platform that prioritizes a drag-and-drop interface, you can stop worrying about technical “how-tos” and start focusing on the “what-ifs.” You deserve a tool that works as fast as your imagination, turning the complex process of 3D modeling and motion into a fun, rewarding experience.

Quick Summary: Why You’ll Love AniFuzion

  • Zero Experience Required: Perfect for beginners, hobbyists, and professionals alike.

  • Extensive 3D Library: Access thousands of customizable characters and props to fit any scene.

  • AI Magic: Use AI text-to-speech and automatic lipsync to give your characters a voice in seconds.

  • Instant Sharing: Export your creations as high-quality MP4 videos or interactive flipbooks.

  • Browser-Based Brilliance: No heavy software installations; work from anywhere at any time!

Unlocking Your Creativity with Advanced Features

One of the most exciting parts of using a best-in-class online animation maker is seeing how quickly a scene comes together. In the beachside animation shown above, the creator utilized the 3D character library to select diverse figures that represent a relatable group of friends. You aren’t stuck with just one look; you can customize everything from their outfits to their hair colors, making sure every character fits your specific vision perfectly. It is like having a digital toy box where every piece is ready to play!

Bringing Characters to Life with Motion

Movement is what truly separates animation from a simple drawing. With over 2,000 pre-built actions, you can make your characters wave, walk, dance, or even jump for joy with a single click. This technology uses something called motion retargeting, which is just a fancy way of saying that a “walking” motion will look natural whether your character is tall, short, or wearing a sun hat! You don’t have to draw every single frame; the software handles the hard work so you can enjoy the results.

The Power of Voice and Sound

Did you notice the speech bubble in our beach scene? While text is great, imagine if that character actually spoke! With AI Text-to-Speech (TTS), you can type out your dialogue and choose from a variety of voices and accents. To make it even more realistic, the automatic lipsync feature ensures the character’s mouth moves in perfect harmony with the words. It creates an immersive experience that makes your audience feel like they are right there on the sand with your characters.

Step-by-Step: How to Build Your Own Animated Scene

Are you ready to dive in? Building your first project is a journey of discovery. Here is how you can recreate the magic of a seaside getaway or any other story you want to tell:

1. Set the Stage

Every great animation starts with a Canvas. This is your main workspace. You can browse the library of ready-to-use scenes to find the perfect background—like a beach, an office, or even a futuristic city. Once your background is set, you have the foundation for your story.

2. Introduce Your Stars

Drag your favorite 3D characters onto the canvas. Use the properties panel to tweak their appearance. In our beach example, giving characters swimwear and accessories like hats helps establish the “vacation” vibe immediately. This process of rigging (setting up the digital skeleton) is already done for you, so your characters are always ready to move!

3. Add Action and Dialogue

Use the Timeline at the bottom of the screen to decide when things happen. Maybe one character waves first, and then the speech bubble appears. By layering these elements, you create a natural flow. Don’t forget to add some shape effects like a gentle fade-in for your text to make it look professional.

4. Preview and Export

Before you show the world, use the Preview Mode to watch your animation in real-time. If the timing feels a bit off, simply slide the elements on your timeline. Once you are happy, export your work as an MP4. You can even create an animated flipbook, which is an interactive digital book that your friends or clients can “flip” through online!

Common Questions About Online Animation

Do I need a powerful computer to use AniFuzion?
Not at all! Because this is a browser-based online animation maker, the heavy lifting is done in the cloud. As long as you have a modern browser like Chrome or Firefox and a steady internet connection, you are good to go.

Can I use these animations for my business?
Absolutely! Animation is a fantastic way to boost audience engagement. Whether you are making a product demo, an HR onboarding video, or a social media clip, these professional-looking visuals will help you stand out from the competition.

What are “Props” in animation?
Props are the extra items you add to a scene to make it feel real. In our beach image, the umbrella and the palm trees are props. They add context and variety to your world, making the environment much more interesting to look at.

Conclusion: Your Animation Journey Starts Today!

The world of 3D animation is no longer a “members-only” club for technical experts. With the right professional online animation maker, anyone with a story to tell can become a creator. From the sunny shores of a digital beach to the complex world of business presentations, AniFuzion provides the tools, the assets, and the AI-powered ease to bring your ideas to life. Remember, every great animator started with their very first character and a simple “hello.”

So, why wait? The sun is shining on your creative potential! Whether you want to recreate the beachside fun we’ve explored today or venture into entirely new worlds, the only limit is your imagination. Grab your digital surfboard and catch the wave of modern content creation. You will be amazed at what you can build when you have the best online animation maker by your side!

Ready to bring your stories to life? Explore our library of stunning designs and start your project today!

Try Now: Visual Paradigm Online Animation Templates

Related Links

Model Canvas Review: Revolutionizing Strategic Planning with AI

Introduction to Modern Strategic Planning

In the complex landscape of modern business, the ability to formulate, visualize, and communicate strategy is paramount. Whether you are a startup founder sketching a disruption or a corporate planner analyzing market risks, the frameworks you use matter. Enter Model Canvas, a versatile, Visual Paradigm AI-powered model canvas studio designed to transform how we approach strategic documentation. Unlike static templates or disjointed whiteboard apps, Model Canvas integrates a sophisticated multi-layered AI assistant directly into the workflow, promising to turn a single idea into a comprehensive business plan in seconds.

Layouts of blank Business Model Canvas

What is Model Canvas Tool?

At its core, Visual Paradigm Model Canvas Tool is a comprehensive suite of strategic templates. It acts as a digital studio where users can create, analyze, and manage a wide variety of business canvases. While it anchors on the popular Business Model Canvas, its library extends to Lean Canvas, SWOT Analysis, PESTLE, and dozens of other frameworks used by product managers and agile coaches.

The tool distinguishes itself through its “hybrid” approach to content creation. Users can brainstorm manually—using the interface like a structured digital whiteboard—or they can leverage the built-in AI to handle the heavy lifting. This flexibility makes it suitable for both educational purposes, where students learn the frameworks, and professional environments, where speed and depth are critical.

The Engine: Three Tiers of AI Assistance

The standout feature of Model Canvas is its integration of Artificial Intelligence, which functions not just as a text generator, but as a strategic partner. The application breaks down AI assistance into three distinct tiers, catering to different stages of the planning process.

Tier 1: Full Canvas Generation

This feature is designed for the “Zero to One” phase. Users provide a high-level topic or a simple business idea—for example, “A subscription box service for rare, indoor plants.” The AI then generates a completely filled-in canvas. It populates every section with relevant sticky notes, effectively creating a detailed first draft in seconds. This functionality eliminates the intimidation of a blank page and provides immediate material for refinement.

Tier 2: Context-Aware Suggestions

Strategic planning often hits roadblocks. You might have a clear Value Proposition but struggle to define Key Partnerships. With Tier 2 assistance, users can request targeted suggestions for specific sections. The AI analyzes the context of the entire canvas to ensure consistency and offers a list of new ideas specifically for that block. It feels akin to asking a smart colleague, “What am I missing here?”

Tier 3: In-Depth Strategic Analysis

Perhaps the most valuable feature for high-level decision-making is the specialized “AI Analysis” tab. Once a canvas is populated, the AI can perform deep-dive operations, transforming static data into dynamic insights. Capabilities include:

  • Elevator Pitch Generation: Summarizing the entire business model into a compelling narrative.
  • SWOT Extraction: Identifying strengths and weaknesses implicit in the model.
  • Risk Assessment: Highlighting potential points of failure.
  • Marketing Strategy: Suggesting go-to-market approaches based on customer segments.

User Experience and Core Features

Beyond the AI, the application is built with a focus on usability and professional management.

Multi-Canvas Switcher

The application avoids the “one-size-fits-all” trap by including a Multi-Canvas Switcher. This library allows users to toggle between different frameworks depending on the task at hand. A product manager might start with a Product Canvas for development and switch to a Lean Canvas for market validation, all within the same ecosystem.

Dual Viewing Modes

To support both holistic thinking and deep focus, Model Canvas offers two primary viewing modes. Canvas View displays the entire grid, allowing users to see connections and the “big picture.” Conversely, Focus Mode isolates a single section, removing distractions. This is particularly useful during brainstorming sessions where the goal is to exhaustively list items for a specific category, such as “Customer Segments.”

Project Management and Sharing

Model Canvas creates a bridge between cloud convenience and local control. Projects can be saved to the cloud for access across devices or exported as local files for privacy. Sharing is handled through read-only links, allowing stakeholders, investors, or advisors to view the strategy without the risk of accidental edits. This makes it an excellent tool for sending a polished “viability check” to a potential investor.

Target Audience

The versatility of Model Canvas makes it an asset for a broad spectrum of professionals:

  • Entrepreneurs: For rapid prototyping of startups and pivoting business models.
  • Product Managers: For mapping customer journeys and competitive analysis.
  • Agile Coaches: For facilitating team alignment via frameworks like the Team Canvas.
  • Business Students: As an educational sandbox to learn strategic frameworks.

Limitations and Considerations

While Model Canvas is a robust tool, potential users should be aware of certain constraints to ensure it fits their workflow:

  • Single-User Focus: The tool is designed for individual use. It does not currently support real-time collaborative editing (like Google Docs), meaning teams cannot work on the same canvas simultaneously.
  • Internet Dependency: An active internet connection is required to access all AI features and cloud storage capabilities.
  • Fixed Layouts: The canvas templates are pre-defined. Users cannot create custom canvas layouts or modify the structure of existing templates.

Conclusion

Model Canvas represents a significant step forward in digital strategic planning. By combining a vast library of proven business frameworks with a multi-layered AI assistant, it solves the two biggest problems in strategy: getting started and going deep. Whether you are generating a pitch for a new venture or conducting a SWOT analysis for an established corporation, Model Canvas provides the structure and intelligence to make the process faster, sharper, and more professional.

Mastering Sprint Preparation: A Comprehensive Review of the Agile Backlog Refiner

In the fast-paced world of software development, the gap between a high-level project goal and a development-ready backlog is often where teams struggle the most. Backlog refinement—formerly known as grooming—is essential, yet it can be time-consuming and chaotic without the right structure. The Agile Backlog Refiner aims to solve this problem by combining a structured 7-step wizard with intelligent AI automation. In this review, we explore how this tool facilitates the translation of business requirements into actionable epics, user stories, and sprint plans.

Ai Powered Backlog Refinement Tool

What is the Agile Backlog Refiner?

The Agile Backlog Refiner is a specialized web application designed to guide Product Owners, Scrum Masters, and development teams through the entire lifecycle of backlog refinement. Unlike generic project management boards that assume you already have your tasks defined, this tool focuses on the creation and definition phase. It functions as an intelligent assistant that helps transform a single project goal into a comprehensive report containing prioritized user stories, risk assessments, and a draft sprint plan.

The tool operates on two main modalities: a manual mode for granular control and an AI-assisted mode that generates a complete refinement plan from a simple description. The output is a consolidated report that serves as a single source of truth for stakeholders and developers alike.

Key Features and Capabilities

1. AI-Powered Backlog Generation

The standout feature of this tool is its ability to utilize Artificial Intelligence to perform the heavy lifting of backlog creation. By simply entering a high-level project description (e.g., “Create a user profile page with order history”), the AI engine populates data across the entire workflow. It drafts epics, decomposes them into specific user stories, writes acceptance criteria, and even suggests priorities. This feature massively accelerates preparation time, allowing Product Owners to start with a solid draft rather than a blank page.

2. The 7-Step Guided Wizard

To ensure no critical aspect of agile planning is overlooked, the application enforces a best-practice workflow consisting of seven distinct steps:

  • Preparation: Setting the stage and goals.
  • Decompose Epics: Breaking down large bodies of work.
  • Prioritize PBIs: Using methods like MoSCoW to rank items.
  • Refine Stories: Adding detail and acceptance criteria.
  • Risk Assessment: Identifying potential pitfalls early.
  • Finalize & Plan: Drafting the sprint structure.
  • Final Report: Generating the output document.

A visual stepper at the top of the interface tracks progress, turning green as steps are completed. This gamified element provides a sense of accomplishment and ensures methodical progress.

3. Structured Form-Based Input

The user interface is designed around clear, structured forms. Whether you are manually entering data or editing AI suggestions, the tool provides specific fields for Epics, User Stories, and Risk definitions. This structure acts as a digital worksheet, prompting the user for the right information at the right time, which directly improves the quality and consistency of the backlog.

4. Flexible Data Management

Recognizing the diverse security needs of agile teams, the tool offers dual saving mechanisms. Users can save projects to the cloud for accessibility across different locations or export the entire project state as a local .json file. The latter is particularly useful for teams with strict data privacy requirements or for those who wish to version-control their planning sessions manually.

Target Audience and Use Cases

The Agile Backlog Refiner is tailored for specific roles within the software development lifecycle:

  • Product Owners & Managers: It serves as a preparation deck for backlog refinement sessions, ensuring they enter meetings with a clear, prioritized list of work.
  • Scrum Masters: The tool acts as a facilitation aid, keeping the team focused and ensuring that often-skipped steps, like risk assessment, are covered.
  • Development Teams: Developers benefit from the clarity of well-written user stories and defined acceptance criteria, which reduces ambiguity during execution.

Practical Workflow Scenarios

AI-Assisted Sprint Planning

For teams needing to quickly spin up a backlog for a new feature, the AI workflow is ideal. The team can agree on a one-paragraph description, input it into the “Generate with AI” prompt, and receive a fully structured plan. The session then shifts from writing to reviewing, where the team tweaks priorities and estimates based on their specific context.

Manual Deep-Dive Refinement

For complex features requiring granular human oversight, users can bypass the AI. Starting with a blank project, a Product Owner can manually input an Epic in Step 2, decompose it into Product Backlog Items (PBIs) in Step 3, and meticulously define acceptance criteria in Step 4. This mode is excellent for maintaining strict control over technical requirements.

Limitations and Considerations

While the Agile Backlog Refiner is a powerful planning aid, potential users should be aware of certain limitations to manage expectations:

  • No Direct Integration: The tool creates a refined plan, but it does not automatically sync with Jira, Trello, or Azure DevOps. Users must manually transfer the final stories into their primary issue tracker.
  • Single-User Focus: The application is designed for a facilitator (e.g., the Product Owner) to drive the session. It does not support real-time collaborative editing where multiple team members type simultaneously.
  • AI Memory: The AI treats every generation request as a new session; it does not retain memory of previous projects or long-term organizational context.

Conclusion

The Agile Backlog Refiner helps bridge the gap between abstract ideas and concrete development tasks. By enforcing a structured 7-step process and leveraging AI to eliminate the “blank page syndrome,” it allows teams to run more productive meetings and produce higher-quality documentation. While the lack of direct integration with issue trackers adds a manual step to the workflow, the value gained in clarity, risk assessment, and efficient planning makes it a worthy addition to the Agile toolkit.

Simplifying Software Architecture: A Deep Dive into the AI-Assisted UML Class Diagram Generator

System modeling is a cornerstone of robust software development, yet the barrier to entry for creating accurate Unified Modeling Language (UML) diagrams can often feel high. Whether you are a student grappling with Object-Oriented Design (OOD) concepts or a seasoned architect looking to draft a quick prototype, the complexity of syntax and structure can be daunting. Enter the AI-Assisted UML Class Diagram Generator, an interactive tool designed to demystify this process through a blend of guided learning and artificial intelligence.

In this review, we explore how this educational tool transforms the text-to-diagram workflow, making professional system design accessible to everyone from novices to experts.

What is the AI-Assisted UML Class Diagram Generator?

The AI-Assisted UML Class Diagram Generator is more than just a drawing canvas; it is an interactive wizard designed to guide users through the creation of structured UML class diagrams. Unlike traditional drag-and-drop editors that assume prior knowledge, this tool breaks the modeling process down into a logical 10-step workflow.

Its primary philosophy is “Learn by Doing.” As users navigate through the steps—from defining the scope to analyzing the final design—they are supported by AI-powered assistance. This AI can generate descriptions, identify potential classes, suggest attributes, and even critique the final architecture. The result is a seamless transformation of text-based inputs into professional PlantUML diagrams.

Who Is This Tool Designed For?

The versatility of the generator makes it a valuable asset for a wide range of users in the tech industry and academia:

  • Students: It provides a hands-on method to learn the principles of object-oriented design without getting bogged down by syntax errors.
  • Aspiring Software Developers: It serves as a practice ground for understanding the core components of software architecture.
  • Educators and Tutors: Teachers can use it to demonstrate system modeling concepts and best practices in real-time.
  • Software Engineers & Architects: Professionals can utilize the tool to rapidly create draft diagrams for new ideas or document existing legacy systems.

Core Features That Stand Out

1. The Guided 10-Step Wizard

The heart of the application is its linear wizard. It walks the user through every stage of creation, ensuring no critical component is overlooked. This structured approach provides a “safety net” for beginners, making the complex task of modeling feel manageable. It acts almost like an expert tutor, prompting the user for specific information at the right time.

2. AI-Powered Generation and Analysis

Combating writer’s block is one of the tool’s strongest suits. At key stages, users can click an “AI Generate” button to automatically draft content. The AI can:

3. Real-Time PlantUML Rendering

For those who appreciate the power of text-as-diagram tools, the generator offers real-time visualization. As classes, attributes, and relationships are defined in the wizard, the tool generates the corresponding PlantUML code in the background. This allows users to instantly preview their diagram and access the source code, which is invaluable for technical documentation.

4. Integrated Educational Content

Each step of the wizard is accompanied by dedicated educational text. This ensures that the user understands not just how to use the tool, but why they are performing specific actions. It reinforces key object-oriented principles, turning the design process into a continuous learning experience.

How It Works: A Workflow Overview

The tool structures the design process into a logical sequence. Here is what a typical workflow looks like when creating a new diagram:

  1. Define Purpose and Scope: The user starts by describing the system (e.g., “A Library Management System“). The AI can assist in fleshing out this description.
  2. Identify Classes: Based on the scope, the user lists the main entities. The AI can suggest nouns from the description that should be treated as classes.
  3. Add Details (Attributes & Operations): The user adds specific data fields and methods to the classes.
  4. Define Relationships: The user connects classes using associations, inheritance, or aggregations.
  5. Validation: A built-in checklist helps ensure the diagram is logical and complete.
  6. Generation & Analysis: The final steps involve viewing the rendered diagram and requesting an AI analysis report to review the design quality.

Technical flexibility: Save, Load, and Export

Modern tools require modern data portability. The AI-Assisted UML Class Diagram Generator offers several robust options for managing projects:

  • Cloud Save/Load: Users can save their projects to the cloud and access them from anywhere.
  • JSON Export: The entire project state can be downloaded as a JSON file, allowing for local backups and offline use.
  • PlantUML Export: The final output can be exported as a .puml file. This allows the diagram to be integrated into other documentation systems or edited in any IDE that supports PlantUML.

Important Concepts and Terminology

To fully utilize the tool, it helps to understand the terminology used within the wizard. The application provides context for these terms, but here is a quick reference:

Term Definition
Class A blueprint for creating objects, representing a main entity in the system (e.g., “Customer”).
Attribute A property or data field of a class (e.g., studentId).
Operation A behavior or action a class can perform, often called a method (e.g., calculateTotal()).
Relationship A connection between classes, such as Association or Inheritance.
Visibility Defines access levels: Public (+), Private (-), or Protected (#).
PlantUML The text-based scripting language used by the tool to render the visual diagrams.

Pros and Benefits

Using the AI-Assisted UML Class Diagram Generator offers several distinct advantages over manual diagramming:

  • Accelerated Workflow: The AI features automate the generation of boilerplate text, significantly reducing the time required to draft a diagram.
  • Improved Design Quality: The combination of a validation checklist and an AI analysis report helps users spot logical errors and design flaws that might otherwise go unnoticed.
  • Demystification of UML: By guiding the user step-by-step, the tool removes the intimidation factor associated with complex modeling languages.
  • Standardized Output: Because it generates PlantUML code, the output is standardized, clean, and easily version-controlled.

Conclusion

The AI-Assisted UML Class Diagram Generator bridges the gap between educational theory and practical application. By combining a structured wizard with the generative capabilities of AI, it provides a unique environment where students can learn and professionals can iterate quickly. Whether you are looking to document a new software idea or simply want to better understand object-oriented architecture, this tool offers a comprehensive, user-friendly solution.