你準備好革新你的資料庫設計流程了嗎?建立一個專業的實體關係圖過去需要花費數小時手動拖曳圖形與細心繪製連接線。但現在不再如此!透過整合於由 AI 驅動的實體關係圖製作工具直接整合至Visual Paradigm,你就可以從簡單的文字描述中生成實體關係圖僅需幾秒鐘。無論你正在建立一個複雜的圖書館系統,還是高流量的零售庫存系統,這個易於使用的繪圖工具運用先進的智慧來處理繁重的工作,讓你專注於高階架構設計,而非手動格式設定!
AI 驅動建模的關鍵要點
-
即時模型轉換:將自然語言需求轉化為精確的資料庫結構。
-
符合標準的符號:自動使用正確的烏鴉足符號或 IDEF1X 符號來表示實體與關係。
-
快速探索:僅需調整文字提示,即可測試不同的架構情境。
-
完全可編輯性:每個生成的元素都是原生的 Visual Paradigm 物件,可立即進行手動微調。
核心工作流程:如何使用 AI 生成實體關係圖
完美資料庫模型的旅程,始於 Visual Paradigm 桌面版的強大環境。要啟動這項神奇功能,只需前往主選單並選擇工具 > AI 圖形生成。這將開啟一個專用入口,將你的口語描述轉化為結構藍圖。這對於任何重視效率的軟體工程師或資料架構師而言,都是最理想的起點!
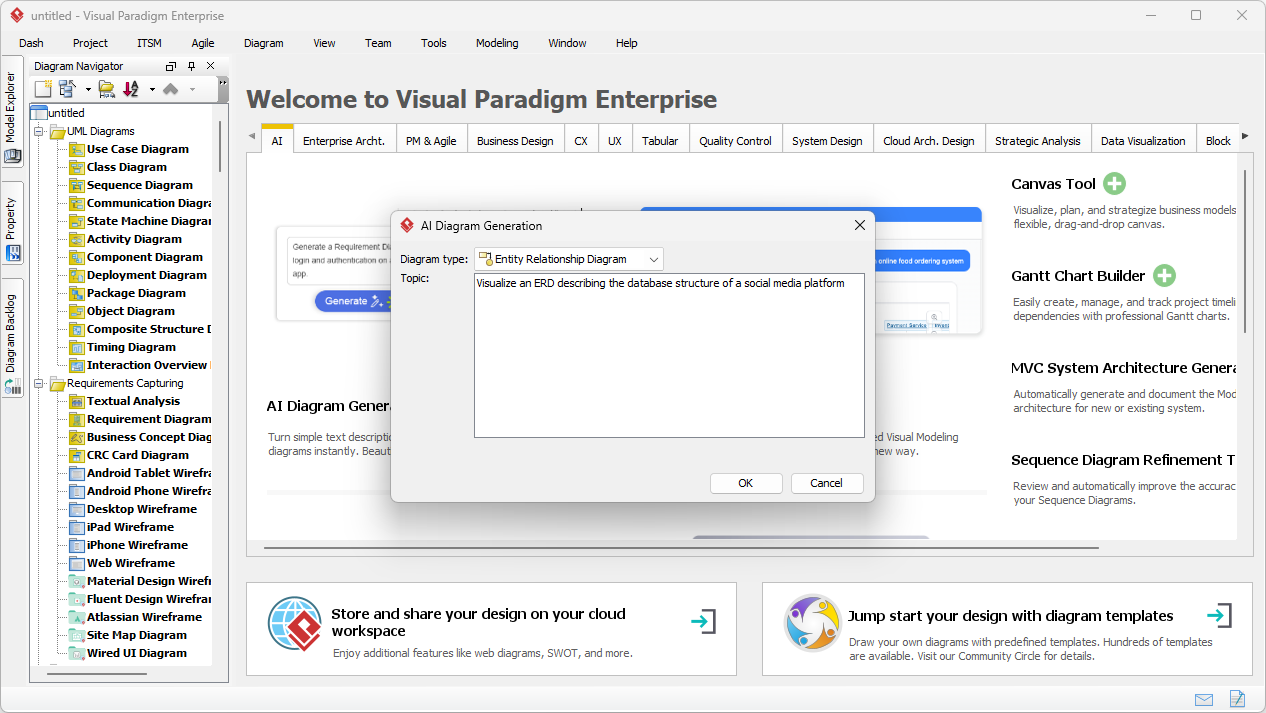
一旦生成視窗出現,你將看到一個專為最大化生產力而設計的簡化介面。首先,請確認已從「圖形類型」下拉選單中選擇實體關係圖。接下來,將你的描述性提示輸入至「主題」欄位。以我們的範例為例,我們提供了非常具體的需求:「一個圖書館管理實體關係圖,用以定義書籍、會員與借閱之間的關係。」 這種清晰度讓專業的人工智慧圖示軟體 在無需進一步指示的情況下推斷出必要的實體,例如 ISBN、到期日和會員類型!
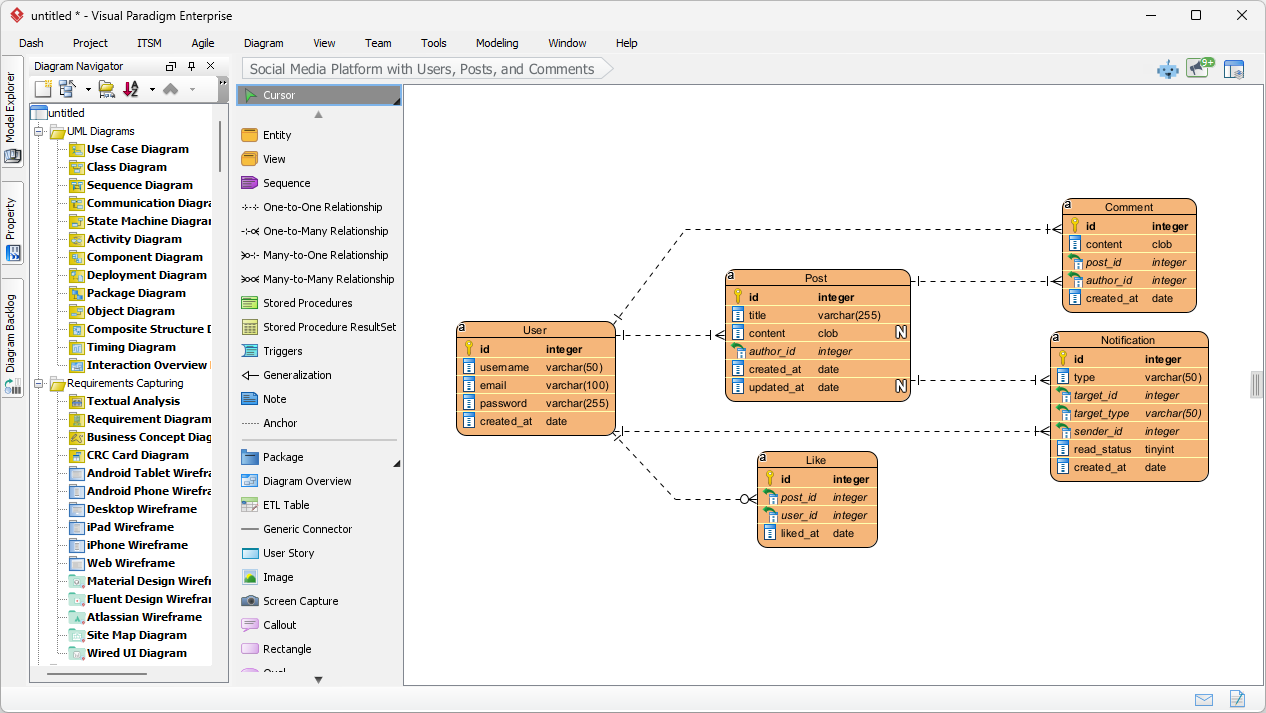
分析智慧輸出
點擊「確定」後,由人工智慧驅動的設計工具對您的文字進行深度分析,並建立一個全面的模型。在我們的圖書館管理情境中,人工智慧成功識別並建立了如目錄項目、書籍、書籍副本、會員和借閱等實體。它甚至智慧地建議了支援表格,例如罰款、付款、員工和逾期記錄以確保完整的系統邏輯。每個主要鍵、外來鍵和基數連接都精確放置,為您的資料庫文件提供堅實的基礎。
此功能最強大的特點之一是,結果並非靜態影像,而是一個完全整合且可編輯的模型。您可以立即進行「微調」,以根據您的專案需求調整圖示。無論您需要重新命名屬性、新增實體,或修改關係類型——例如將連接變更為一對一關係——直覺的介面可透過資源目錄和編輯工具進行無縫的手動調整。
結論:提升您的設計策略
選擇使用產生實體關係圖模型,您不僅節省時間;更確保您的文件從第一個點擊開始就遵循業界最佳實務。這個專業的人工智慧驅動的實體關係圖工具彌合了概念需求與技術執行之間的差距,使其成為最易用的軟體現代開發團隊的最佳選擇。今天就體驗視覺建模的未來,讓您的創意引領方向!
準備好轉變您的工作流程了嗎?
透過下載 Visual Paradigm 的最新版本,釋放您設計流程的全部潛力。點擊下方連結,開始使用全球最先進的人工智慧圖示應用程式.
下載 Visual Paradigm 桌面版: https://www.visual-paradigm.com/download/
相關連結
實體-關係圖 (ERD) 是基礎工具,用於資料庫設計 和資料模型,用於透過定義實體、屬性和它們之間的互動,來視覺化資訊系統的靜態結構實體、屬性和它們之間的互動。Visual Paradigm 提供一套完整的ERD 工具——可在桌面和雲端使用,支援各種標準,包括陳氏符號,以促進精確的資料結構開發。平台的現代化進展現在包含由人工智慧驅動的功能,可立即從自然語言描述或透過反向工程現有的資料庫產生可編輯的 ERD,大幅簡化實作工作流程.
-
什麼是實體-關係圖 (ERD)?——Visual Paradigm 使用指南:一份全面的資源,涵蓋現代資料庫建模中 ERD 的元件、符號與重要性。
-
Visual Paradigm ERD 工具 – 在線建立實體-關係圖:詳細說明一款強大的基於網路的編輯器,專為直覺式的拖放方式設計,用於複雜資料庫結構的規劃。
-
如何使用 ERD 建立關係型資料庫 – Visual Paradigm 教學:一份實用的逐步教學,引導使用者從概念資料模型到最終實作。
-
使用 ERD 工具進行資料庫設計 – Visual Paradigm 使用指南:探討建立可擴展、穩健資料庫的最佳實務,以及在不同開發階段同步模型的方法。
-
AI 圖表生成器新增圖表類型:資料流程圖與 ERD:關於最新人工智慧功能的資訊,可讓使用者從簡單的文字提示自動建立結構化的 ERD。
-
利用 Visual Paradigm 簡化實體-關係建模:深入探討如何有效利用視覺化建模工具,從初始資料概念過渡到實際實作。