學習UML(統一建模語言)一開始可能會讓人感到壓力山大——特別是在沒有明確起點的情況下,試圖理解類別關係、序列流程或狀態轉換時。但有了合適的工具,這個過程會變得直覺、互動,甚至令人愉快。其中一種在開發者、學生和軟體設計師中越來越受歡迎的工具是Visual Paradigm 的AI 聊天機器人,一個對話式助手,能將自然語言轉化為專業的 UML 圖表。
無論你是初學者,試圖理解如何建模一個簡單系統,還是開發者正在優化架構,本指南將一步步引導你有效使用 AI 聊天機器人來學習和應用 UML 概念。
🧠 為什麼要使用 AI 學習 UML?
傳統的 UML 學習通常涉及研究語法、符號規則和教科書範例——有時還缺乏即時反饋。Visual Paradigm 的 AI 聊天機器人改變了這一點,提供了一種實作且即時的建模體驗。你不需要記憶符號,只需用白話英文描述你的系統,AI 就能立即生成視覺化呈現。
這種方法支援主動學習,讓你能夠實驗、觀察並調整——就像在現實世界設計中一樣。對於喜歡視覺化學習的人尤其有幫助,他們能從元件之間的關係中受益。
✅ 專業提示:不僅僅用這個工具來生成圖表,更要測試你的理解程度。請 AI 建模你已經思考過的系統,然後將結果與你的心理模型進行比較。
🔧 支援學習的關鍵功能
📌 即時圖表生成
AI 可以從單一提示產生多種 UML 圖表類型:
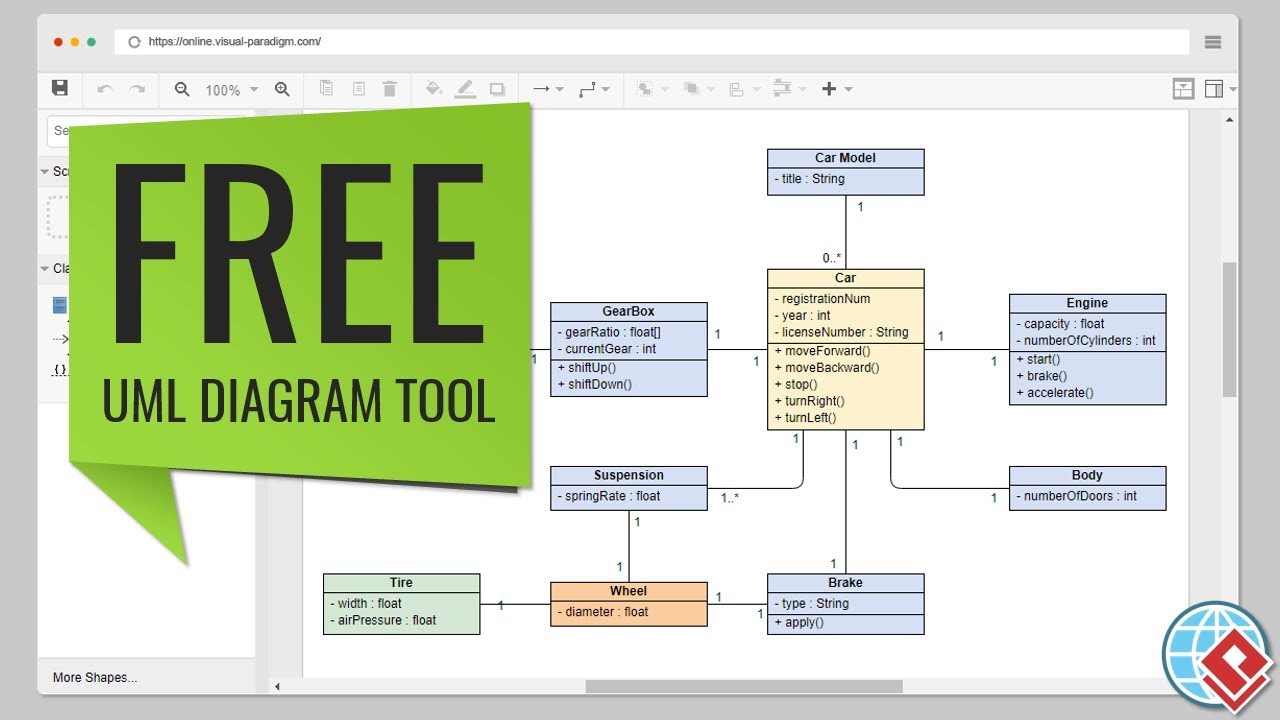
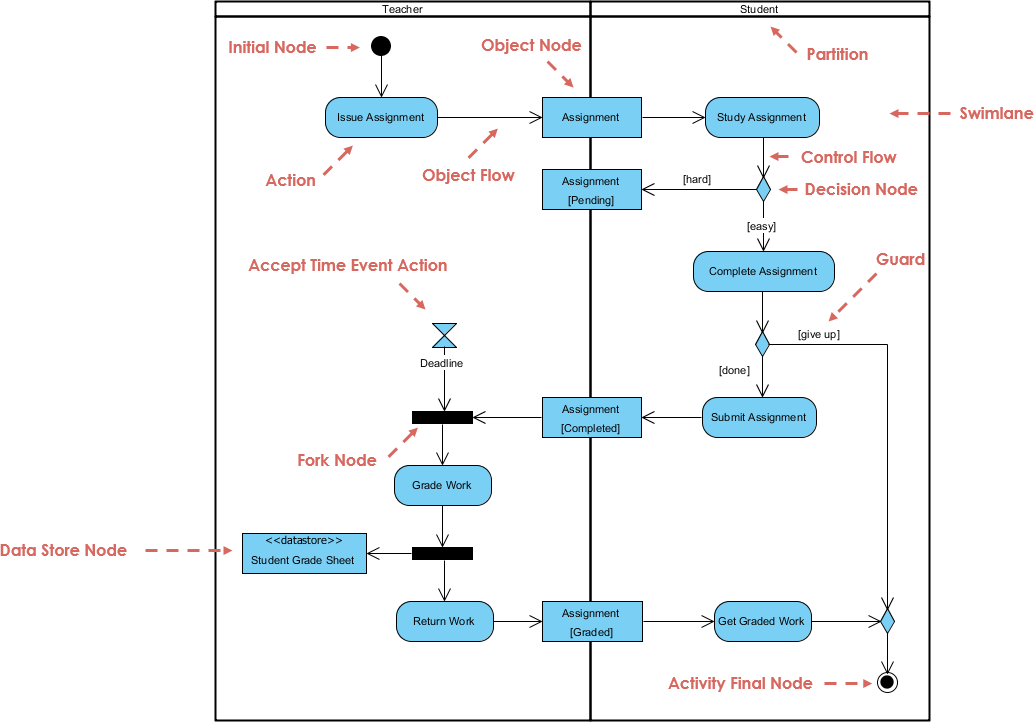
- 類別圖
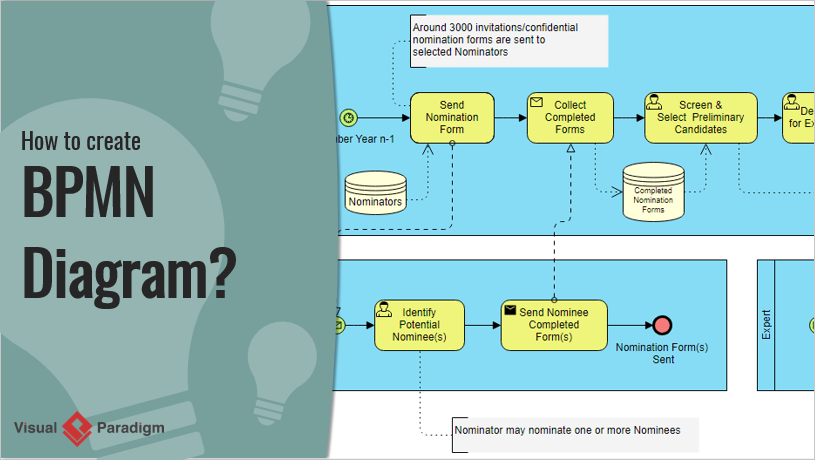
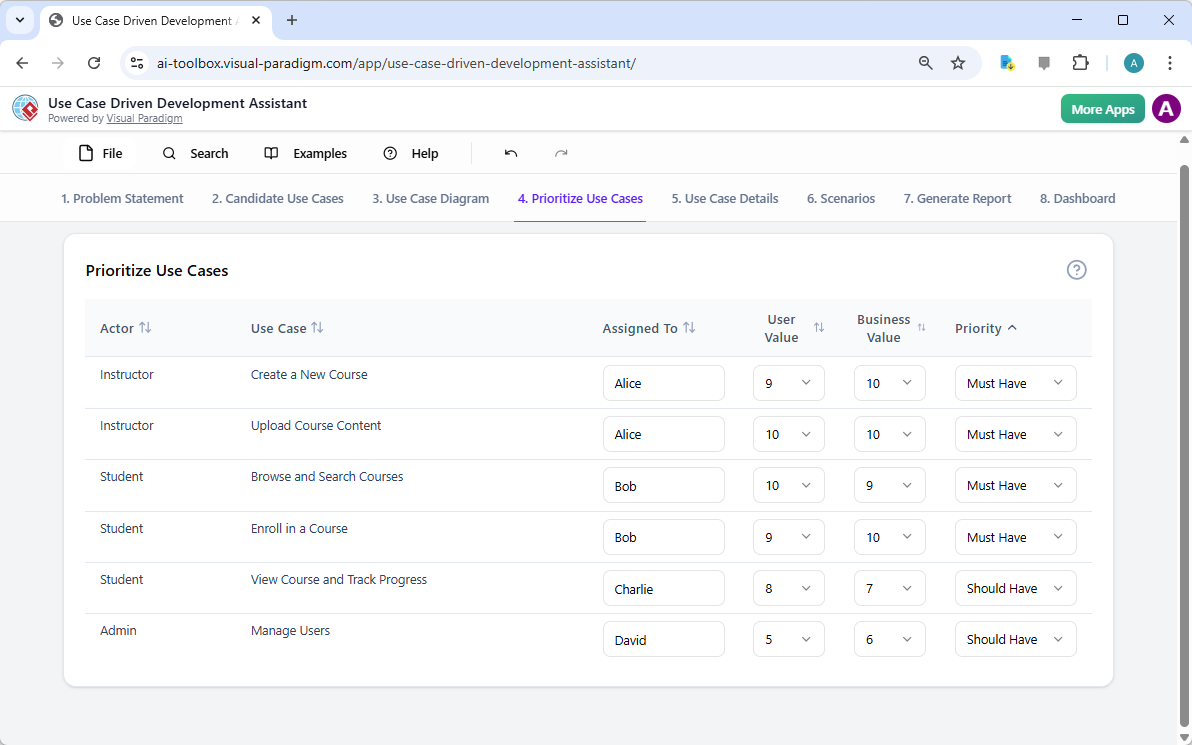
- 用例圖
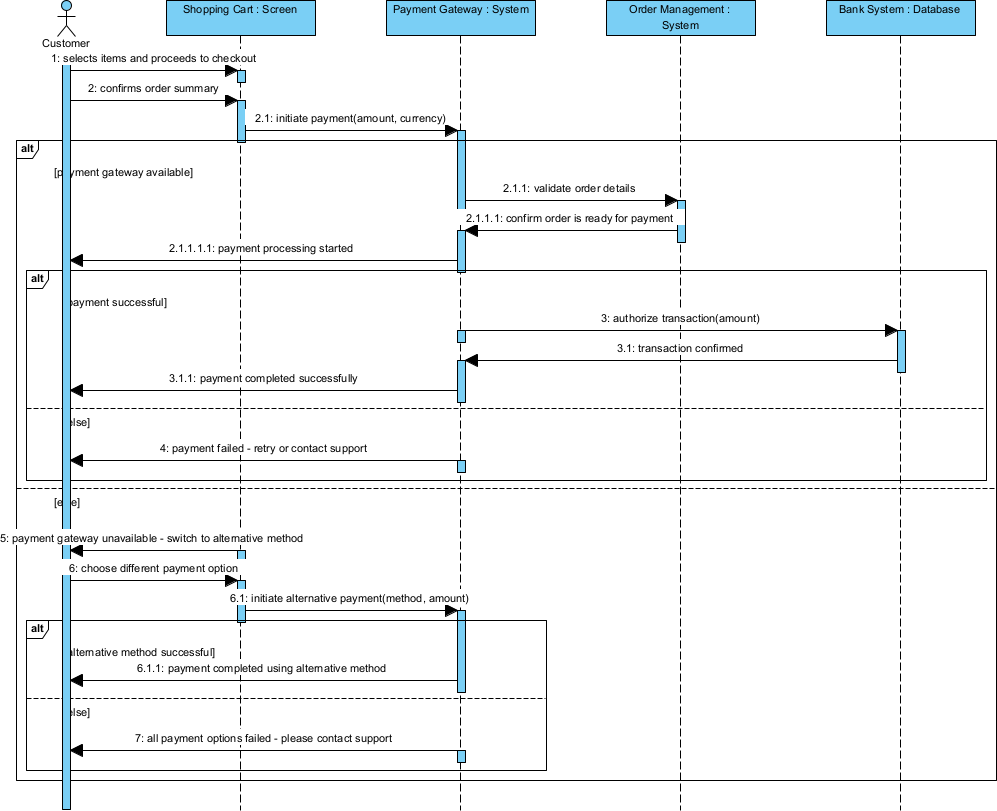
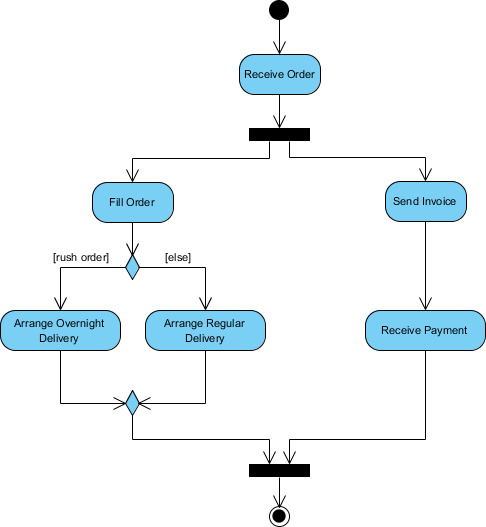
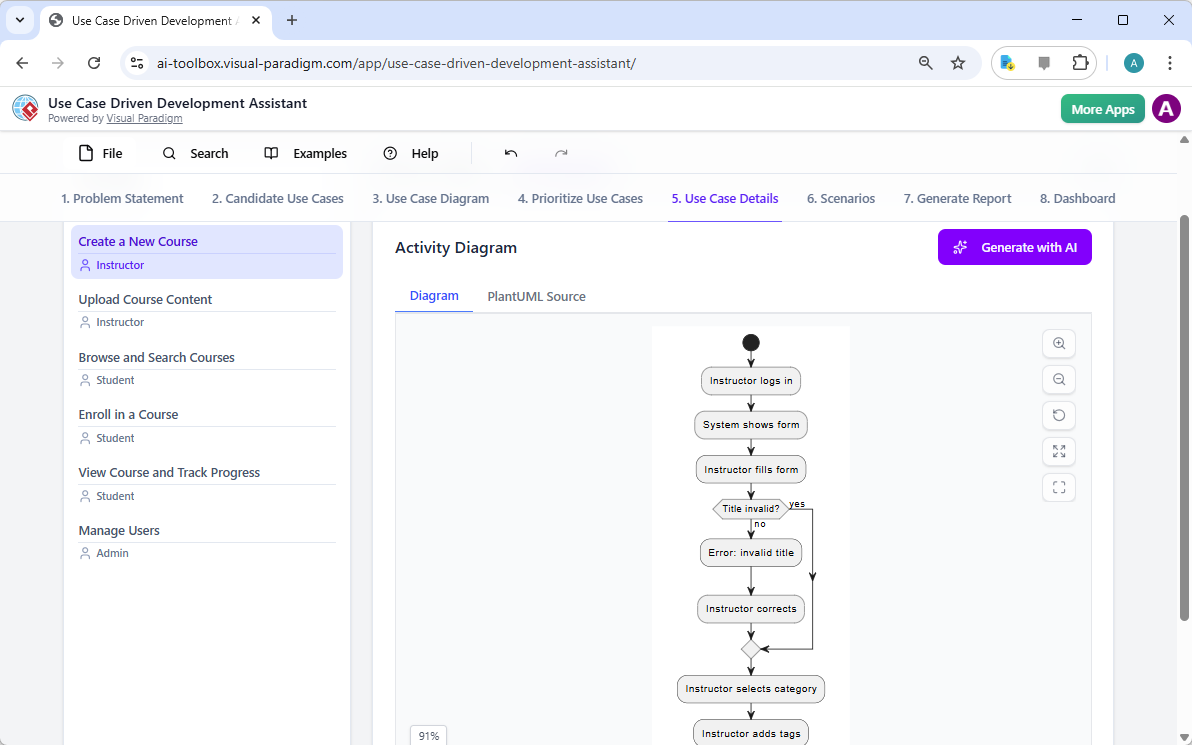
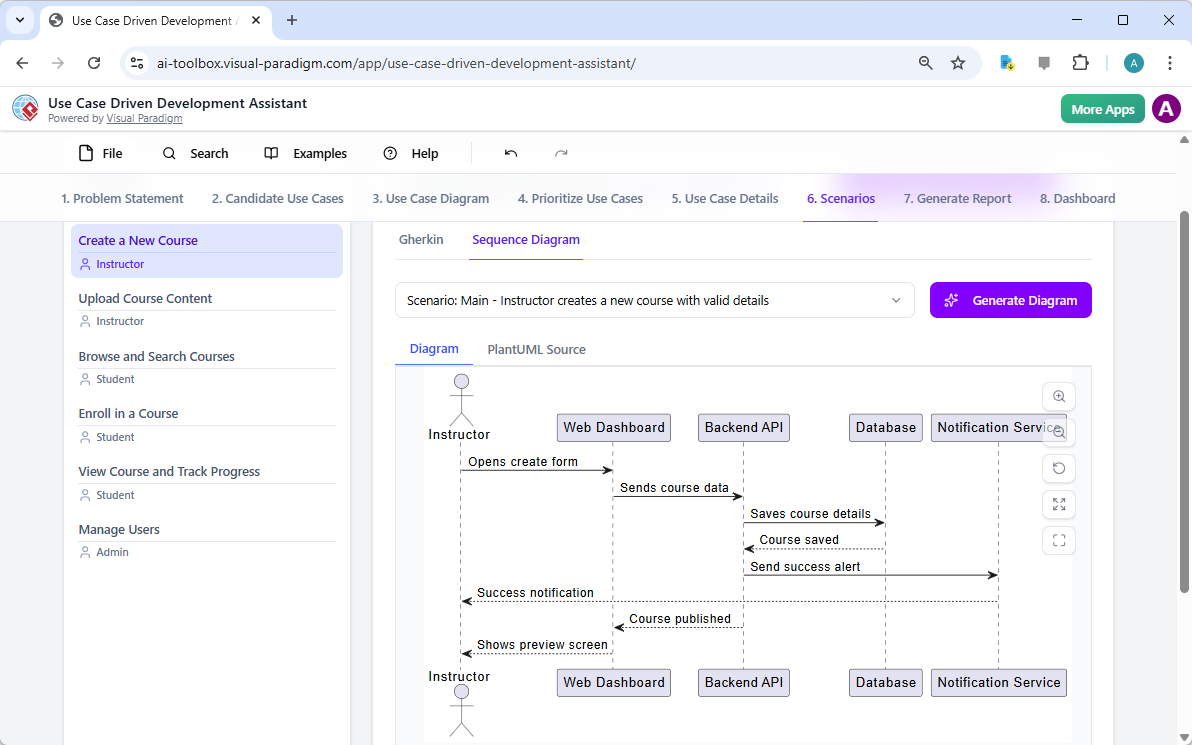
- 序列圖
- 狀態機圖
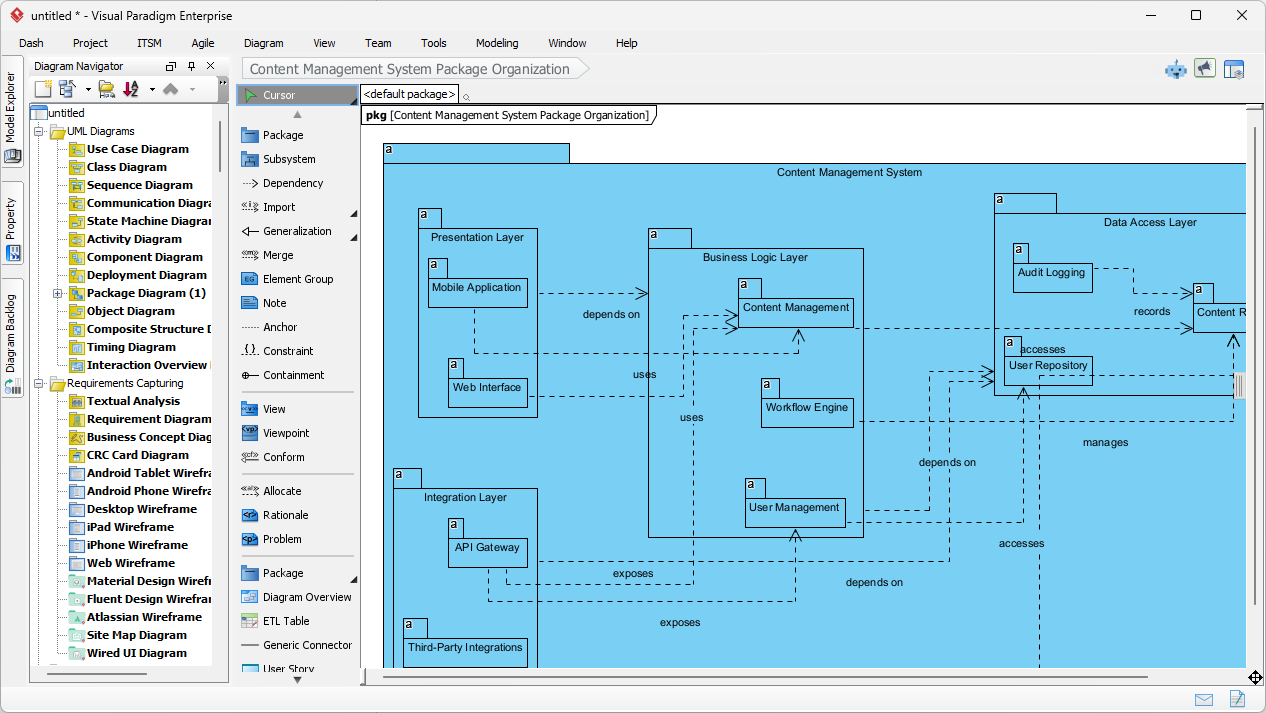
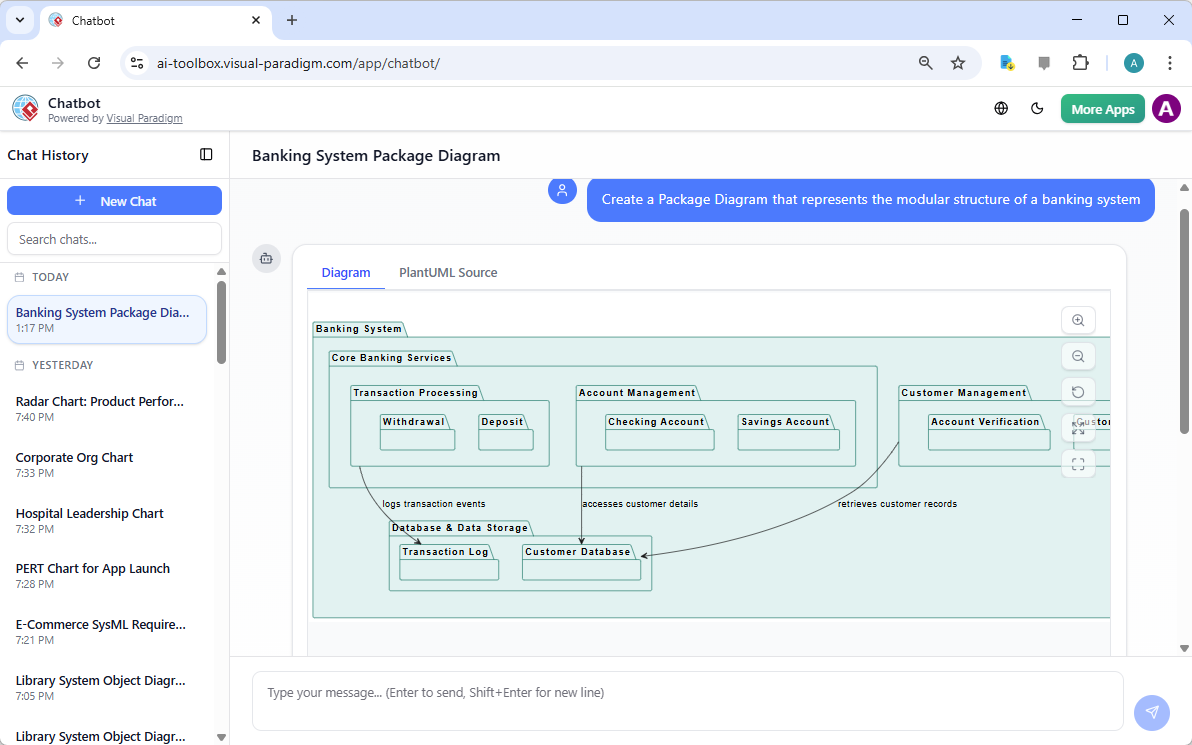
- 套件圖
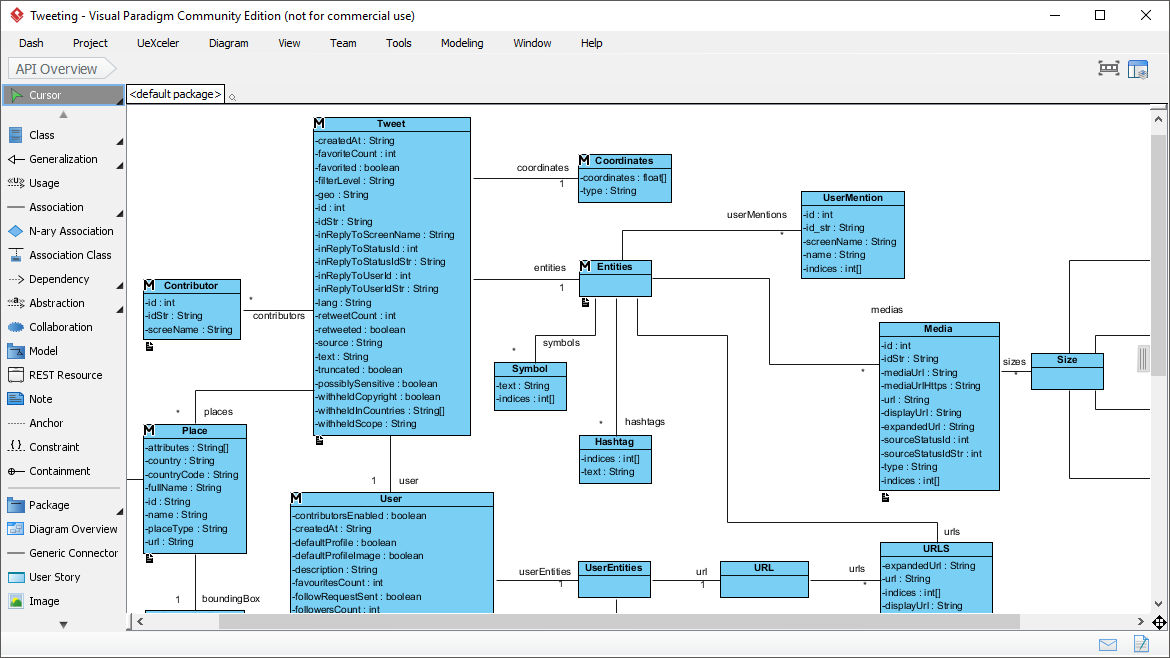
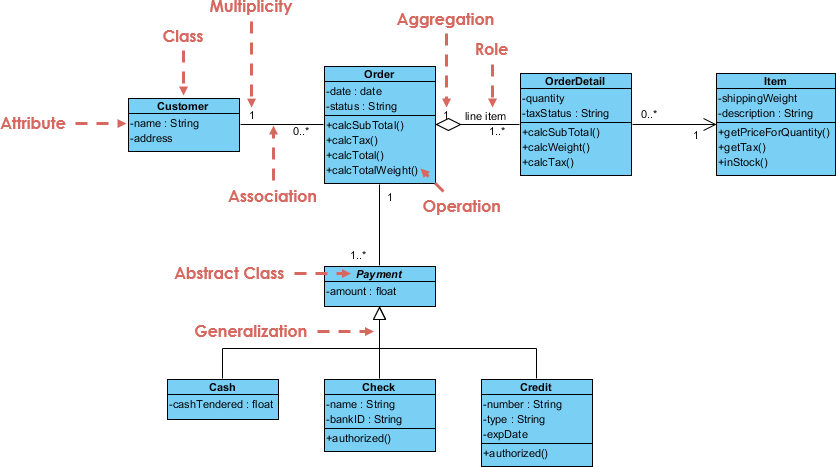
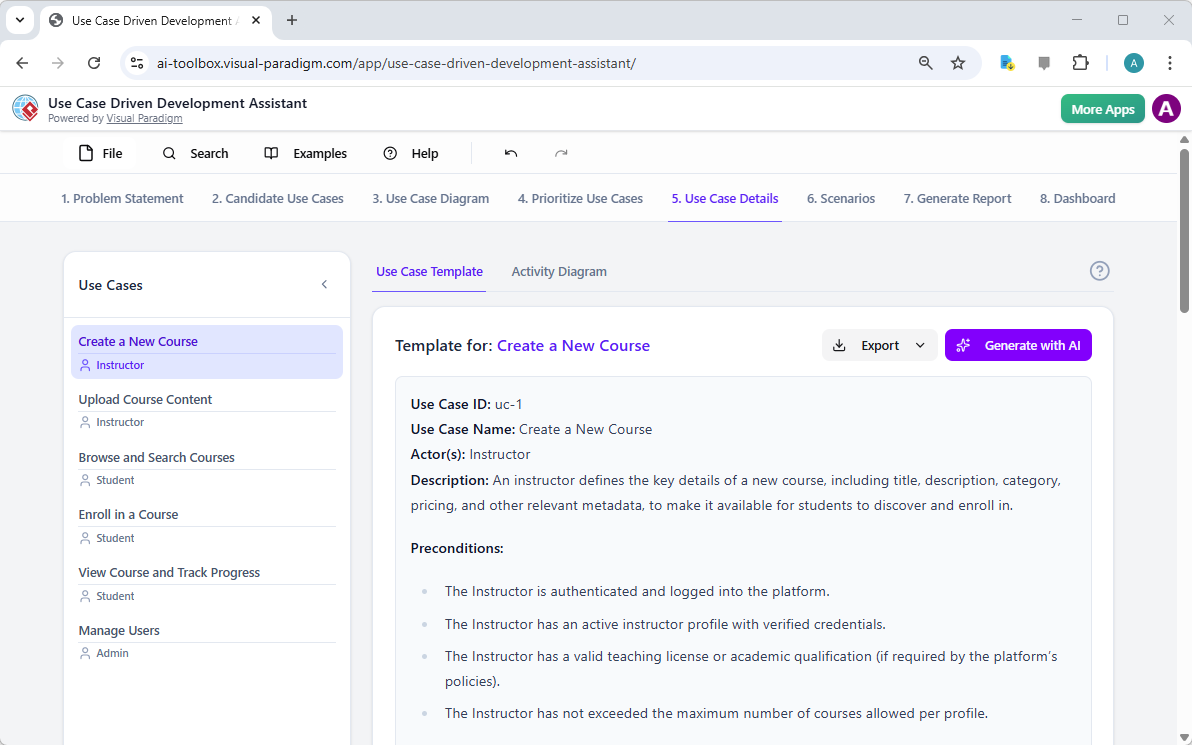
例如,輸入「建模一個包含學生、課程和講師的大學系統」生成包含相關類別、屬性和關係的類圖——並附上正確的符號表示。
💬 聊天式優化
你不需要一次就完美無缺。聊天機器人支援迭代式編輯:
- 「新增一個『成績』類別,與學生和課程相連。」
- 「將『員工』類別重新命名為『教職員』。」
- 「將『註冊』關係設為可選。」
每條指令都會即時更新圖表,幫助你理解變更如何影響模型。
📊 設計反饋與最佳實踐
生成圖表後,使用 分析報告 或 驗證清單 以獲得如下洞察:
- 遺漏的關聯或多重性
- 重複或不清晰的類別名稱
- 基於UML標準的改進建議
此反饋循環強化良好的建模習慣,幫助你避免常見陷阱。
🔄 無縫整合
滿意後,你可以:
- 匯入 將圖表匯入 Visual Paradigm 桌面版或線上版進行更深入的編輯
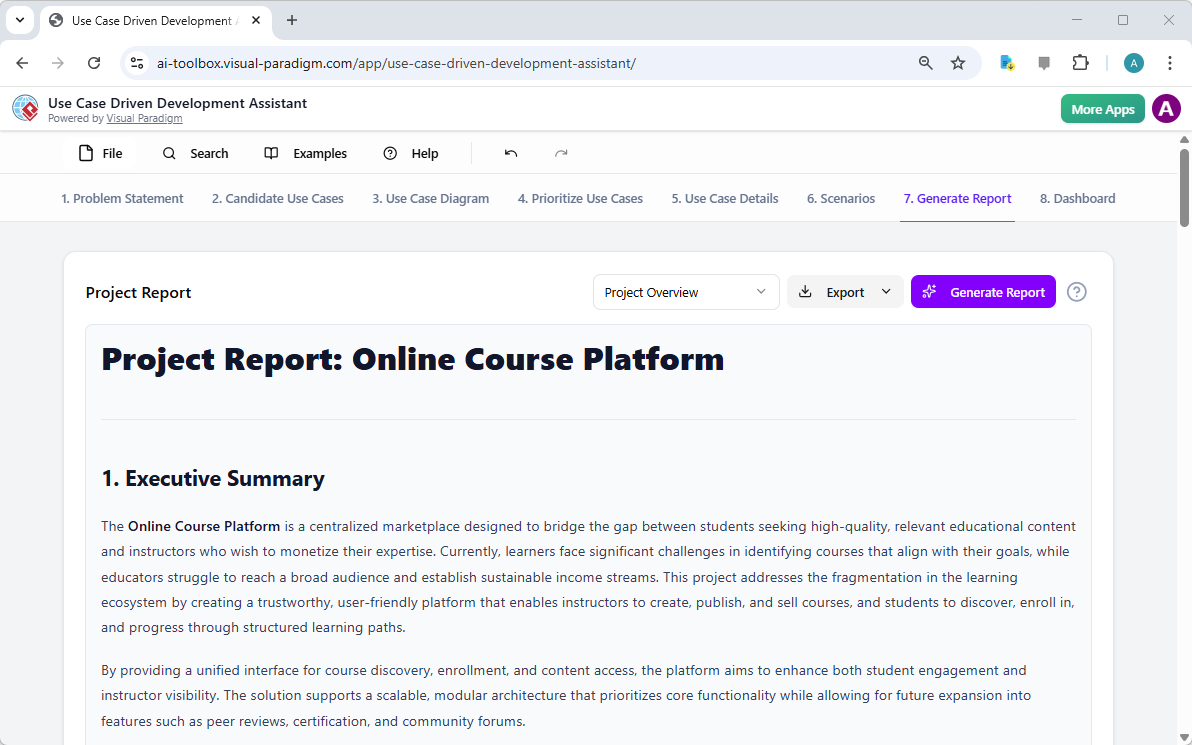
- 匯出 為 SVG、PNG 或 PDF 格式,用於文件編寫或簡報
- 將模型作為程式碼生成的基礎(例如:Java、C#、Python)
此工作流程將學習與實際應用相結合。
🛠️ 分步指南:如何使用 AI 聊天機器人
1. 啟動聊天機器人
你可以透過以下方式存取:
- 網路:前往 chat.visual-paradigm.com直接在您的瀏覽器中。
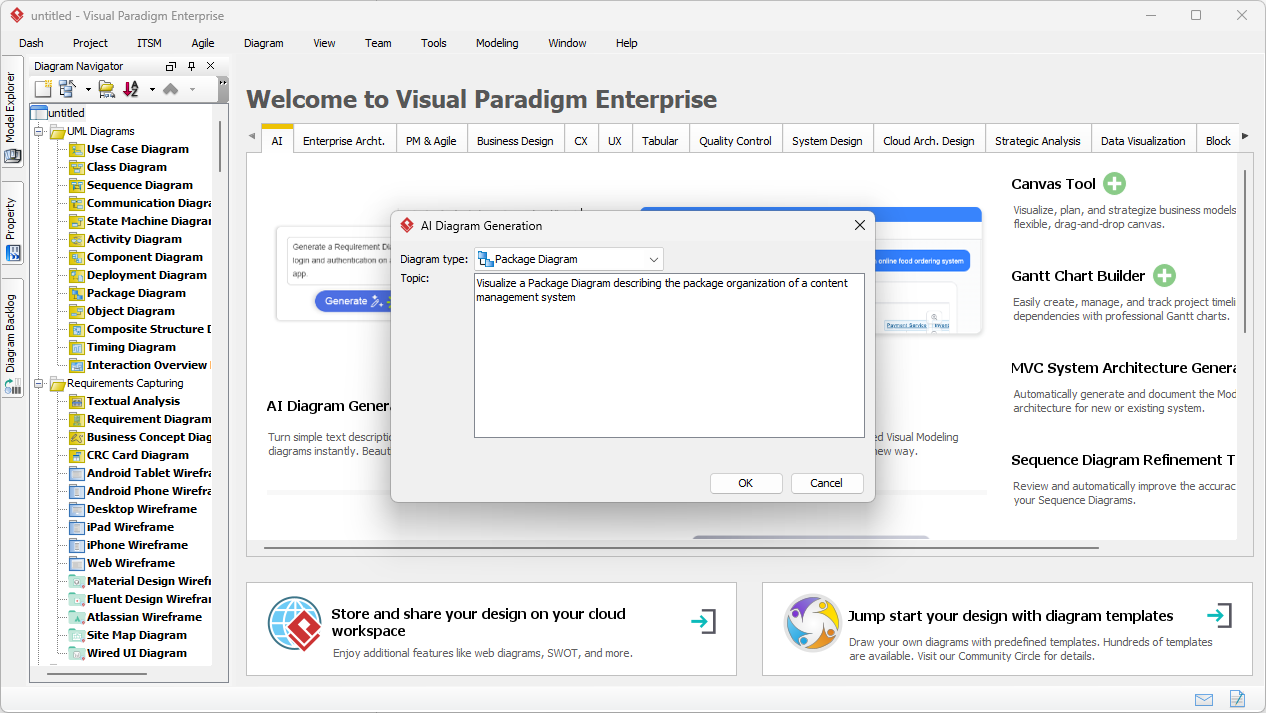
- 桌面應用程式:開啟 Visual Paradigm,前往 工具 > 應用程式 > AI 輔助 UML,並開始建模。
無需安裝或設定——只需開始輸入。
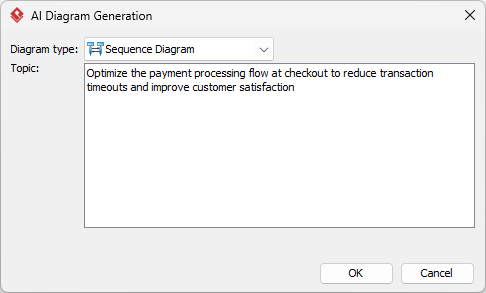
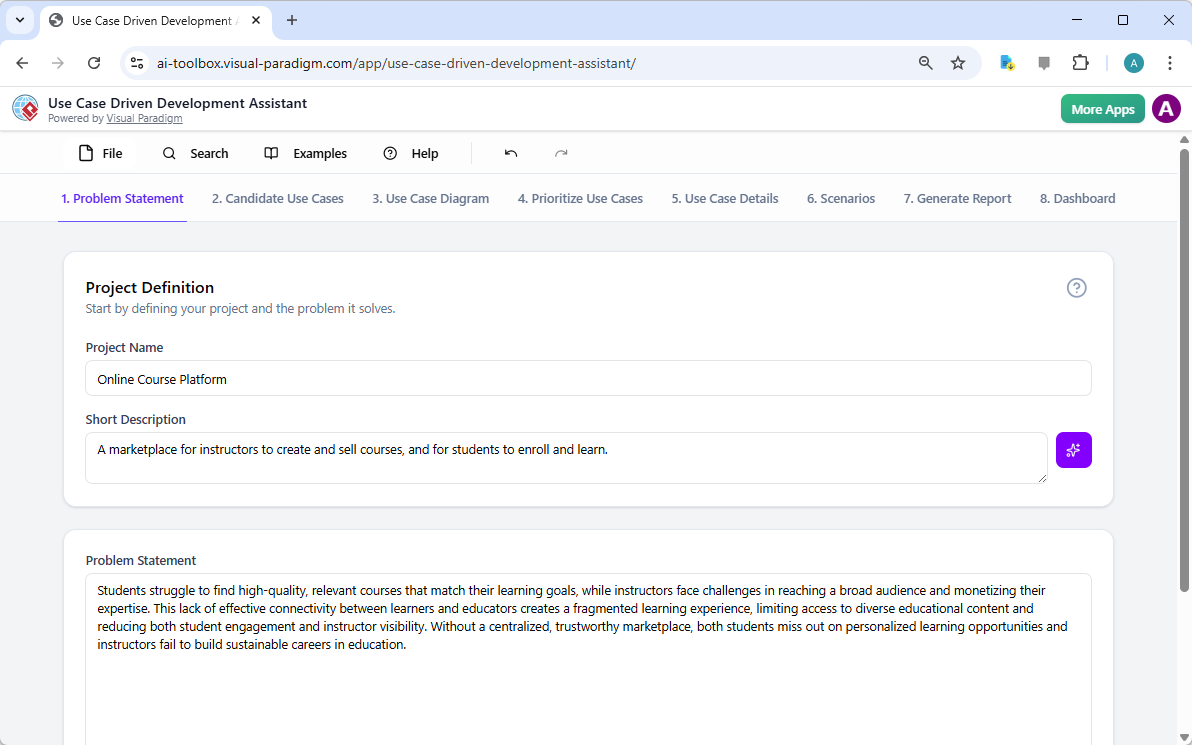
2. 撰寫清晰的提示
請明確描述您的系統。提供的細節越多,輸出結果越好。
範例提示:
- 「為圖書館管理系統建立一個類別圖,包含 Book、Member 和 Loan 類別。」
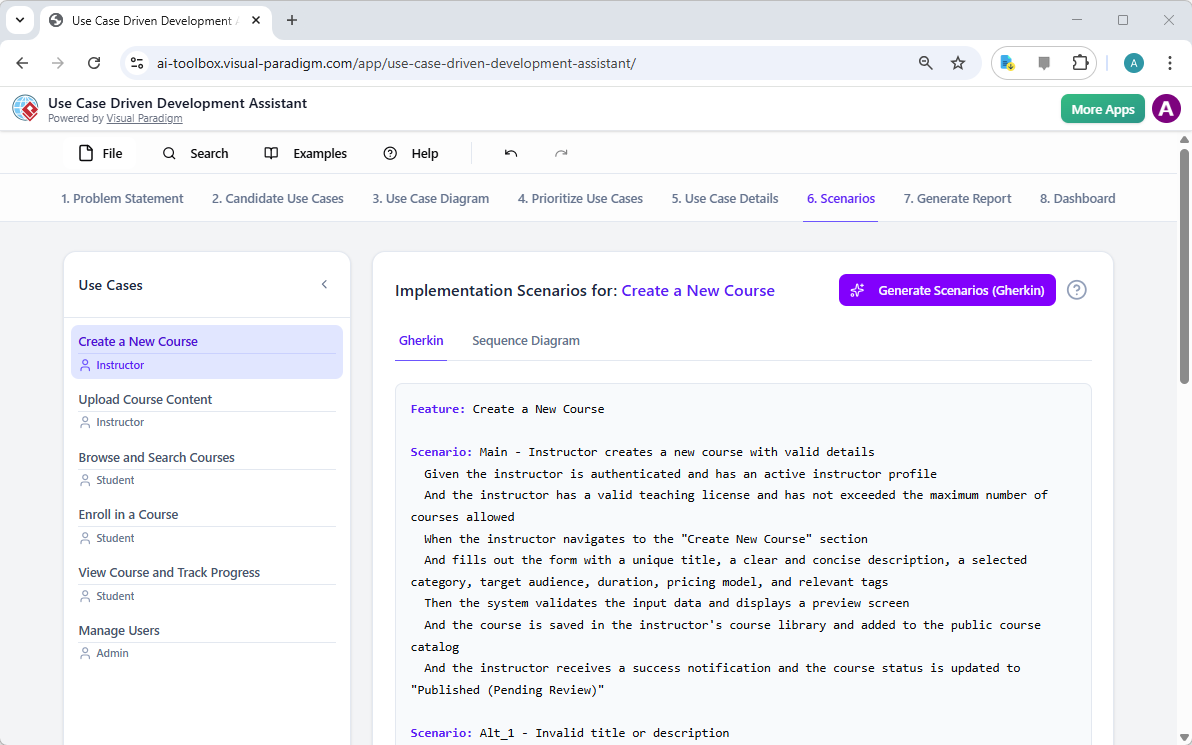
- 「產生一個順序圖,顯示使用者如何登入線上銀行應用程式。」
- 「為電子商務結帳流程建立用例圖,包含 Customer、Payment 和 Order 類別。」
💡 提示: 包含關鍵實體、它們之間的關係,以及任何限制(例如:「一位會員最多可借閱 5 本書」)。
3. 使用自然語言指令進行修正
圖表出現後,像合作夥伴一樣與其互動:
- 「在 Loan 類別中新增一個『歸還』操作。」
- 「將 Book 與 Loan 之間的多重性變更為 1…“
- 「顯示 Payment 對 SecurityCheck 的依賴關係。」
每一次互動都能讓您了解 UML 符號如何反映現實世界的邏輯。
4. 檢查與驗證
按一下 「分析報告」 以查看:
- 結構正確性
- 命名一致性
- 潛在的設計問題
利用這些洞察來深化您對UML原則的理解。
5. 匯出或繼續
- 匯出以圖片或PDF格式匯出,用於筆記或報告。
- 匯入匯入您的完整IDE環境,以繼續工作或產生程式碼。
這使得聊天機器人非常適合用於學習和專案工作。
🎯 實例練習:建立一個簡單的電子商務系統
讓我們走一遍一個實際範例,以示範學習過程。
提示:
「為一個電子商務網站建立一個類別圖,包含 Product、Customer、Order 和 Payment 類別。一位 Customer 可以下多個 Order,每個 Order 包含多個 Product。Payment 與 Order 相關聯。」
結果:
AI 生成了一個包含以下內容的圖表:
Customer(1) — (0…*)OrderOrder(1) — (1…*)ProductOrder(1) — (1)Payment
優化:
「為 Order 類別新增一個『discount』屬性,預設值為 0.0。」
現在您已新增一個屬性,並了解了UML中屬性的表示方式。
驗證:
執行驗證檢查清單。AI 可能建議:
- 「考慮為 Order 新增一個『status』欄位,以追蹤履行狀態。」
- 「請確保產品上的多重性正確——應該是 0…* 嗎?」
這些建議強化了最佳實踐,並幫助您批判性地思考設計。
📚 智慧學習 UML
使用 AI 聊天機器人並不是為了跳過學習——而是為了 加速學習。透過專注於:
- 以自然語言描述系統
- 觀察模型如何演變
- 接收即時反饋
您將比僅靠靜態教程獲得更深入、更直覺的 UML 理解。
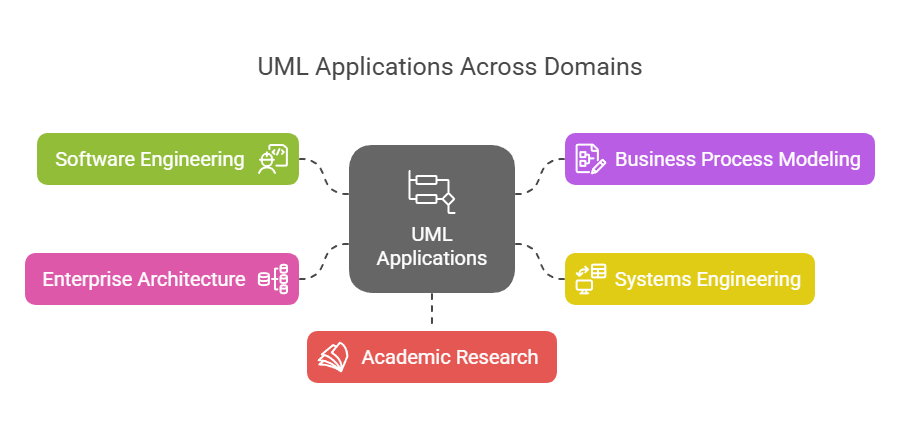
非常適合:
- 學習軟體設計的學生
- 初級開發者練習系統建模
- 團隊在編碼前進行概念原型設計
- 教育工作者在課堂上展示概念
✅ 成功的最終建議
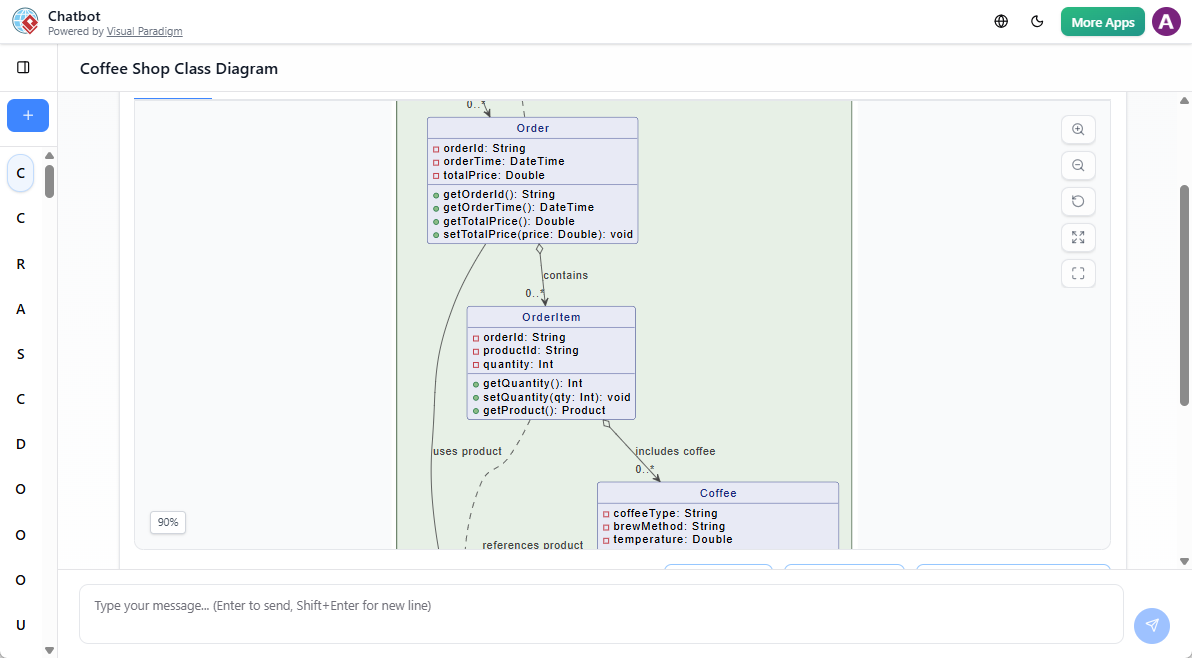
- 從簡單開始:模擬日常系統(例如咖啡店、待辦事項應用程式)。
- 實驗:嘗試以不同限制條件模擬同一系統。
- 比較:以多種方式生成同一張圖表,觀察 AI 如何解讀您的用詞。
- 使用 匯出 功能來記錄您的學習歷程。
AI 聊天機器人並非理解 UML 的替代品——它是一種 副駕駛 ,協助您以設計師思維思考。
📌 準備好嘗試了嗎?
前往 chat.visual-paradigm.com 並輸入您的第一個提示。無論您是在模擬健身追蹤器、醫院系統,還是社交媒體資訊流,AI 都會協助您快速、清晰且正確地以 UML 進行視覺化。
從小處著手。透過實踐學習。並看著您的建模技能逐步提升——一次對話一次。
📝 注意:Visual Paradigm 的 AI 聊天機器人是更廣泛生態系統的一部分,支援 UML 建模、程式碼產生和協作。它旨在隨著您的需求擴展——從學習到專業發展。