Biến ý tưởng của bạn thành những cuốn flipbook kỹ thuật số đẹp mắt—từng bước một
🗺️ Hành trình sáng tạo flipbook của bạn
Chào mừng bạn đến với hướng dẫn toàn diện để tạo ra những cuốn flipbook được hỗ trợ bởi trí tuệ nhân tạo ấn tượng. Hành trình trải nghiệm người dùng này sẽ dẫn bạn qua từng giai đoạn—từ ý tưởng ban đầu cho đến việc chia sẻ cuốn sách kỹ thuật số hoàn chỉnh của bạn với thế giới.
🌟 Giai đoạn 1: Khám phá và cảm hứng
Trước khi bắt đầu
Bạn có một ý tưởng, thông điệp hoặc kiến thức muốn chia sẻ—nhưng việc biến nó thành một cuốn sách kỹ thuật số hoàn chỉnh có thể khiến bạn cảm thấy choáng ngợp. AI Flipbook Maker loại bỏ sự khó khăn đó bằng cách tự động hóa quá trình tạo nội dung, thiết kế và tổ chức.
Bạn sẽ đạt được điều gì:
-
Tạo ra những cuốn flipbook chất lượng chuyên nghiệp trong vài phút, chứ không phải vài ngày
-
Không cần kỹ năng viết lách, thiết kế hay lập trình
-
Sắp xếp và trưng bày công việc của bạn trên những kệ sách ảo có thể tùy chỉnh
-
Chia sẻ ngay lập tức qua liên kết trên bất kỳ thiết bị nào
💡 Mẹo chuyên gia:Bắt đầu với một chủ đề và đối tượng rõ ràng trong tâm trí. Càng cụ thể thông tin đầu vào của bạn, nội dung do AI tạo ra sẽ càng được cá nhân hóa hơn.
🚀 Giai đoạn 2: Bắt đầu – Xác định cuốn sách của bạn
Bước 1: Xây dựng nền tảng của bạn
Điều hướng đến AI Flipbook Maker và bắt đầu bằng cách xác định các thông số cốt lõi của cuốn sách:
-
Nhập chủ đề của bạn: Cuốn sách của bạn nói về điều gì? (ví dụ: “Vườn hữu cơ bền vững cho người mới bắt đầu”)
-
Chọn đối tượng mục tiêu: Bạn đang viết cho ai? (ví dụ: người đam mê, chuyên gia, sinh viên)
-
Chọn giọng điệu và phong cách: Trang trọng, thân mật, vui vẻ, uy tín?
-
Đặt số trang: Cuốn flipbook của bạn nên dài bao nhiêu?
✅ AI ngay lập tức xử lý thông tin đầu vào của bạn và chuẩn bị một dàn ý có cấu trúc.
✍️ Giai đoạn 3: Tạo nội dung được hỗ trợ bởi AI
Bước 2: Tạo dàn ý cuốn sách của bạn
Nhìn cách AI tạo ra một cấu trúc hợp lý, hấp dẫn cho cuốn flipbook của bạn:
-
Tiêu đề chương và tiêu đề phần
-
Những điểm chính được trình bày dưới mỗi phần
-
Luồng thông tin được tối ưu cho đối tượng và phong cách bạn đã chọn
Bạn vẫn giữ quyền kiểm soát: Xem lại, chỉnh sửa hoặc tạo lại bất kỳ phần nào của dàn ý trước khi tiếp tục.
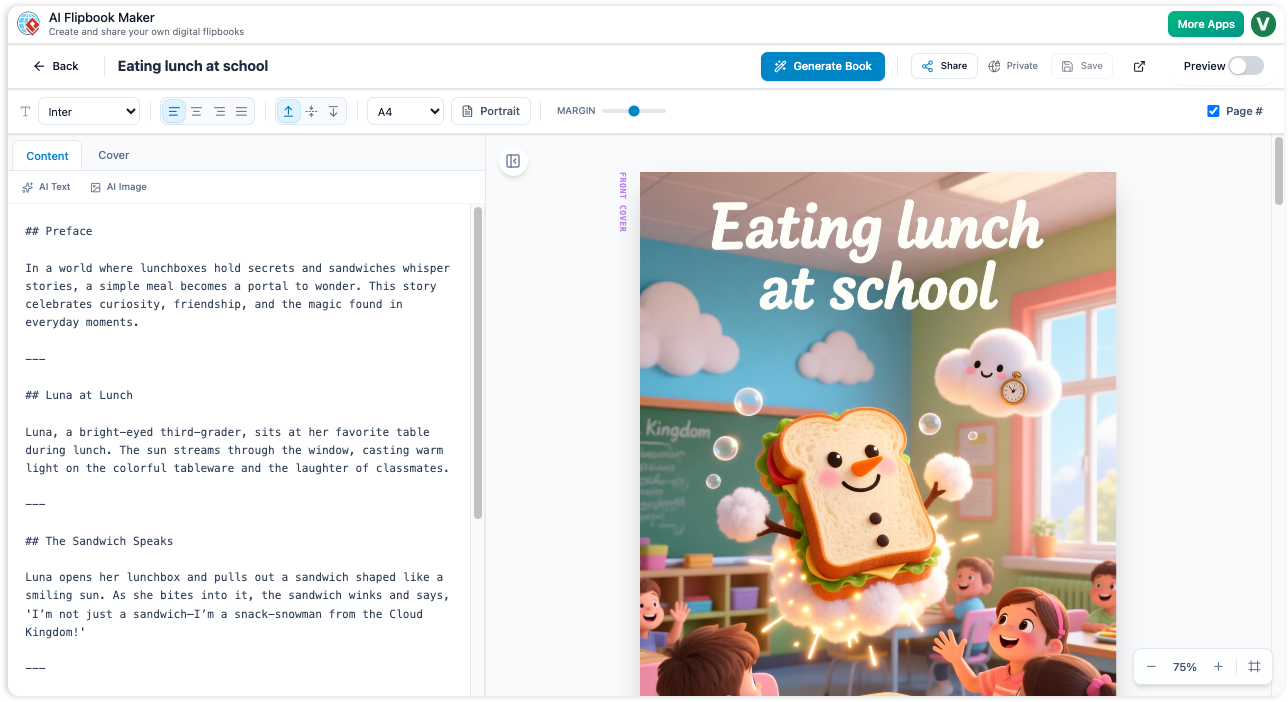
Bước 3: Khiến các trang sống động với hình ảnh do AI tạo
Sau khi dàn ý của bạn được duyệt, AI sẽ tạo ra:
-
Một bìa sách độc đáo, ấn tượngđược thiết kế để thu hút người đọc
-
Những hình ảnh độc đáo, phù hợp cho từng trang, phù hợp với nội dung của bạn
-
Phong cách hình ảnh nhất quán xuyên suốt cuốn flipbook của bạn
🎨 Không có kinh nghiệm thiết kế? Không sao. AI sẽ tự động xử lý về kiểu chữ, bố cục và lựa chọn hình ảnh.
🎨 Giai đoạn 4: Tùy chỉnh & Tinh chỉnh
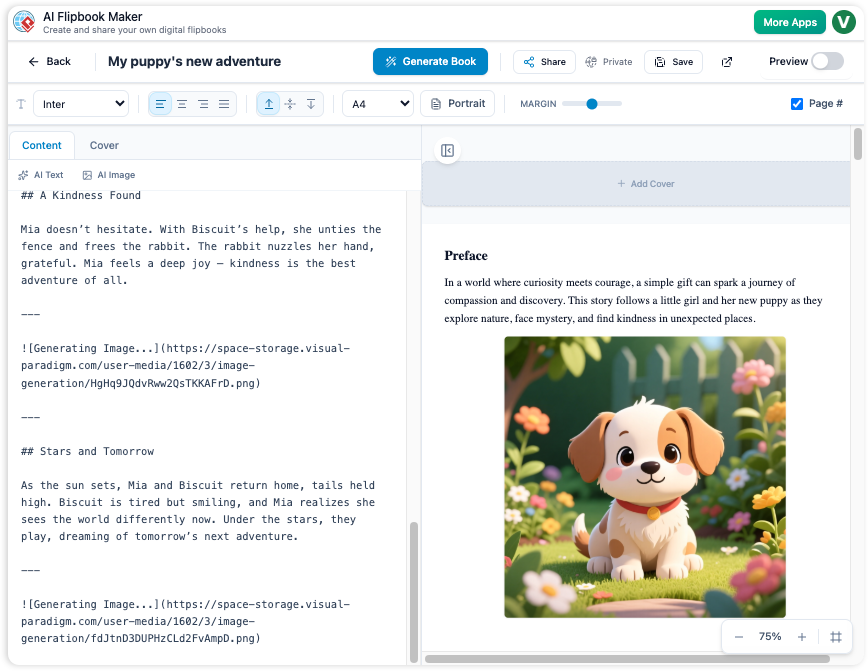
Tùy chỉnh cuốn flipbook của bạn
Trong khi AI làm phần việc nặng nhọc, bạn có thể tinh chỉnh từng chi tiết:
-
Chỉnh sửa nội dung văn bản trực tiếp trên bất kỳ trang nào
-
Thay thế hình ảnh do AI tạo bằng các tệp hình ảnh do bạn tải lên
-
Điều chỉnh màu sắc, phông chữ và bố cục để phù hợp với thương hiệu của bạn
-
Xem trước hiệu ứng lật trang chân thực ngay lập tức
Sắp xếp trên kệ sách AI của bạn
Tạo một không gian ảo đẹp mắt để trưng bày công việc của bạn:
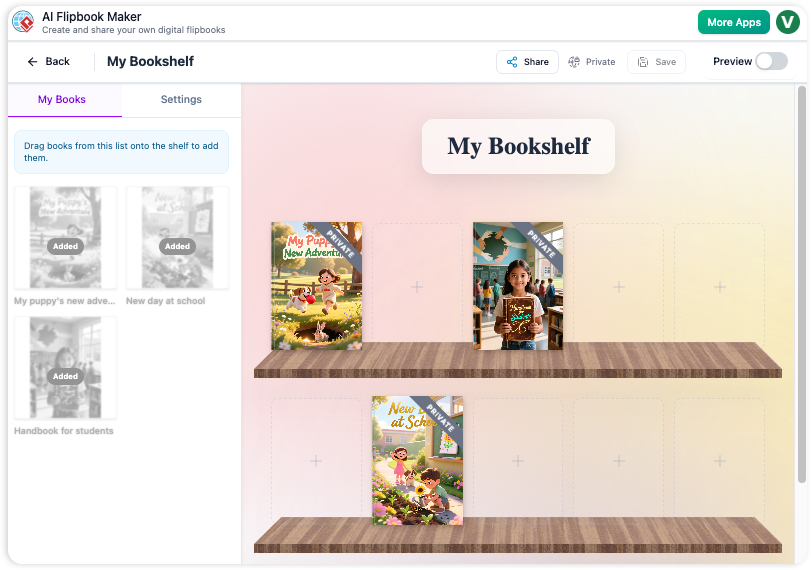
Tính năng kệ sách:
-
📚 Tạo nhiều kệ sách theo chủ đề (ví dụ: “Hướng dẫn Marketing”, “Dự án Cá nhân”)
-
🎨 Chọn từ nhiều phong cách kệ sách và nền khác nhau
-
🖱️ Kéo và thả để sắp xếp lại sách hoặc phân loại theo trạng thái (Nháp, Đã xuất bản, Lưu trữ)
-
🏷️ Thêm thẻ và mô tả để dễ dàng tìm thấy
🌐 Giai đoạn 5: Chia sẻ & Tương tác
Xuất bản chỉ với một cú nhấp
Khi cuốn flipbook của bạn sẵn sàng:
-
Nhấp vào “Xuất bản” để tạo ra một URL duy nhất, có thể chia sẻ
-
Chọn cài đặt quyền riêng tư: Công khai, Không hiển thị hoặc Được bảo vệ bằng mật khẩu
-
Sao chép liên kết hoặc mã nhúng cho trang web và mạng xã hội
Tại sao việc chia sẻ lại trơn tru:
-
🔗 Chia sẻ dễ dàng: Một liên kết hoạt động ở mọi nơi—email, LinkedIn, Twitter, portfolio của bạn
-
📱 Tương thích đa nền tảng: Trông hoàn hảo trên máy tính để bàn, máy tính bảng và điện thoại di động
-
🔄 Trải nghiệm tương tác: Người đọc tận hưởng các trang lật thực tế, thu phóng và chế độ toàn màn hình
-
📊 Sẵn sàng thu hút sự chú ý: Lý tưởng cho các công cụ thu hút khách hàng tiềm năng, nội dung giáo dục, sổ tay sản phẩm và các bộ sưu tập sáng tạo
🔄 Giai đoạn 6: Cải tiến và Phát triển
Cập nhật và Tái sử dụng
Cuốn flipbook của bạn không phải là tĩnh. Trở lại bất kỳ lúc nào để:
-
Chỉnh sửa nội dung hoặc cập nhật hình ảnh
-
Tạo các phiên bản mới với nội dung AI được cập nhật
-
Nhân bản các cuốn sách thành công để tạo thành chuỗi hoặc phiên bản khác nhau
Xây dựng Thư viện Số của bạn
Khi bạn tạo thêm nhiều flipbook, kệ sách tùy chỉnh của bạn sẽ trở thành một điểm nổi bật mạnh mẽ cho chuyên môn, sự sáng tạo hoặc nghệ thuật kể chuyện thương hiệu của bạn—tất cả được sắp xếp gọn gàng và sẵn sàng gây ấn tượng.
✅ Tóm tắt các lợi ích chính
| Tính năng | Lợi ích cho người dùng |
|---|---|
| Dàn ý do AI tạo ra | Tiết kiệm hàng giờ lập kế hoạch; bắt đầu với cấu trúc chuyên nghiệp |
| Tạo hình ảnh và bìa do AI | Những hình ảnh ấn tượng mà không cần thuê nhà thiết kế |
| Kệ sách tùy chỉnh | Sắp xếp chuyên nghiệp phản ánh thương hiệu của bạn |
| Chia sẻ chỉ với một cú nhấp | Phân phối tức thì trên tất cả các kênh |
| Chỉnh sửa không cần mã hóa | Kiểm soát sáng tạo toàn diện mà không có rào cản kỹ thuật |
| Trải nghiệm lật trang linh hoạt | Thu hút người đọc trên mọi thiết bị với tương tác hấp dẫn |
🛠️ Sức mạnh kỹ thuật bên trong
AI Flipbook Maker tận dụng các công nghệ web hiện đại để đảm bảo:
-
Tải nhanh và chuyển động mượt mà
-
Trang flipbook thân thiện với SEO và dễ truy cập
-
Lưu trữ an toàn và hiệu suất liên kết đáng tin cậy
-
Cập nhật tự động và cải tiến tính năng
🎯 Trường hợp sử dụng lý tưởng
-
🎓 Giáo viên: Tạo sách giáo khoa tương tác hoặc tài liệu bổ sung bài học
-
💼 Nhà tiếp thị: Phát triển danh mục sản phẩm, nghiên cứu trường hợp hoặc công cụ thu hút khách hàng tiềm năng
-
✍️ Tác giả và người sáng tạo: Thiết kế bản mẫu sách, chia sẻ portfolio hoặc xuất bản truyện ngắn
-
🏢 Doanh nghiệp: Hướng dẫn đăng ký, sách hướng dẫn đào tạo hoặc đề xuất khách hàng
-
🎨 Nhà thiết kế: Trình bày các dự án trực quan theo định dạng cuốn sách lật hấp dẫn
📚 Danh sách tham khảo
- Visual Paradigm Flipbook Maker – Tạo sách lật kỹ thuật số tương tác: Công cụ trực tuyến này cho phép người dùng chuyển đổi tài liệu tĩnh thành các cuốn sách lật hấp dẫn với hiệu ứng lật trang chân thực.
- Trình tạo sách lật AI: Tạo và xuất bản sách kỹ thuật số ngay lập tức: Công cụ này cho phép người sáng tạo viết, thiết kế và xuất bản các cuốn sách lật kỹ thuật số chuyên nghiệp và truyện kể trực tiếp từ một lời nhắc văn bản đơn giản.
- Lumina AI Slideshow Maker: Tạo các bài thuyết trình ấn tượng với AI: Người dùng có thể tận dụng trí tuệ nhân tạo để tạo các bản trình chiếu chất lượng cao từ đầu vào văn bản đơn giản, tiết kiệm thời gian đồng thời nâng cao sáng tạo hình ảnh.
- Studio trình chiếu có hoạt hình AI: Tạo các bản trình chiếu động, có hoạt hình một cách dễ dàng: Một studio web được hỗ trợ bởi AI kết hợp chỉnh sửa bản trình chiếu truyền thống với AI sinh thành để tự động hóa việc viết và thiết kế các bản trình chiếu có hoạt hình.
- Trình chiếu sách lật tự lưu trữ: Chuyển đổi tài liệu thành các bài thuyết trình tương tác: Hướng dẫn kỹ thuật về việc chuyển đổi PDF thành các bản trình chiếu sách lật tương tác với khả năng kiểm soát hoàn toàn về lưu trữ và tùy chỉnh.
- Trình tạo bài thuyết trình Markdown: Chuyển mã thành các bản trình chiếu đẹp mắt: Công cụ này chuyển đổi các tệp Markdown thành các bài thuyết trình được hoàn thiện, có hoạt hình với đánh dấu cú pháp, lý tưởng cho nội dung kỹ thuật và hướng đến nhà phát triển.
- Lumina AI: Tạo ngay các bản trình chiếu video được hỗ trợ AI: Cập nhật phiên bản mô tả một công cụ tạo các bản trình chiếu video động từ văn bản, lý tưởng cho việc tạo nội dung tiếp thị nhanh chóng và kể chuyện.
- Trình tạo sách lật: Một bước đột phá cho nội dung tương tác: Bài viết này khám phá cách công nghệ sách lật biến các tờ rơi và báo cáo tĩnh thành trải nghiệm kỹ thuật số sâu sắc.
- Tạo sách lật hoạt hình với AniFuzion và Fliplify: Một hướng dẫn tập trung vào việc kết hợp phần mềm hoạt hình với trình tạo sách lật để tạo ra các ấn phẩm kỹ thuật số có hình ảnh phong phú, chuyển động.
- Tại sao trình tạo sách lật của Visual Paradigm Online nổi bật: Phân tích các tính năng độc đáo giúp trình tạo sách lật này phù hợp với các bài thuyết trình KPI chuyên nghiệp và báo cáo tương tác.