


Understanding the external environment is a core component of strategic planning. For students studying business management, economics, or marketing, the PEST analysis framework provides a structured way to evaluate macro-environmental factors. While the political, social, and technological dimensions often attract attention, the economic section demands rigorous attention. Economic indicators act as the pulse of the market, influencing consumer behavior, operational costs, and investment decisions.
This guide breaks down the specific economic metrics that students must understand when conducting a PEST analysis. We will explore how these variables interact with business strategy and provide a roadmap for accurate interpretation without relying on jargon or hype.
🔍 What is the Economic Component of PEST?
The “E” in PEST stands for Economic. It refers to the external economic forces that impact an organization’s ability to operate profitably. Unlike internal factors like company culture or employee skills, economic indicators are largely beyond the control of a single business. They are systemic forces that affect entire industries or regions.
When students analyze the economic environment, they are looking for trends that suggest opportunities or threats. A healthy economy might signal growth potential, while a recession might require cost-cutting measures. The goal is not to predict the future with certainty, but to assess the current trajectory.
Macro vs. Micro: PEST focuses on macroeconomics. This means looking at national or global trends rather than specific company performance.
Time Horizon: Economic factors often change slowly. A student should look at long-term trends rather than daily fluctuations.
Interconnectedness: Economic conditions influence social and technological factors. For example, high interest rates may slow down technology adoption.
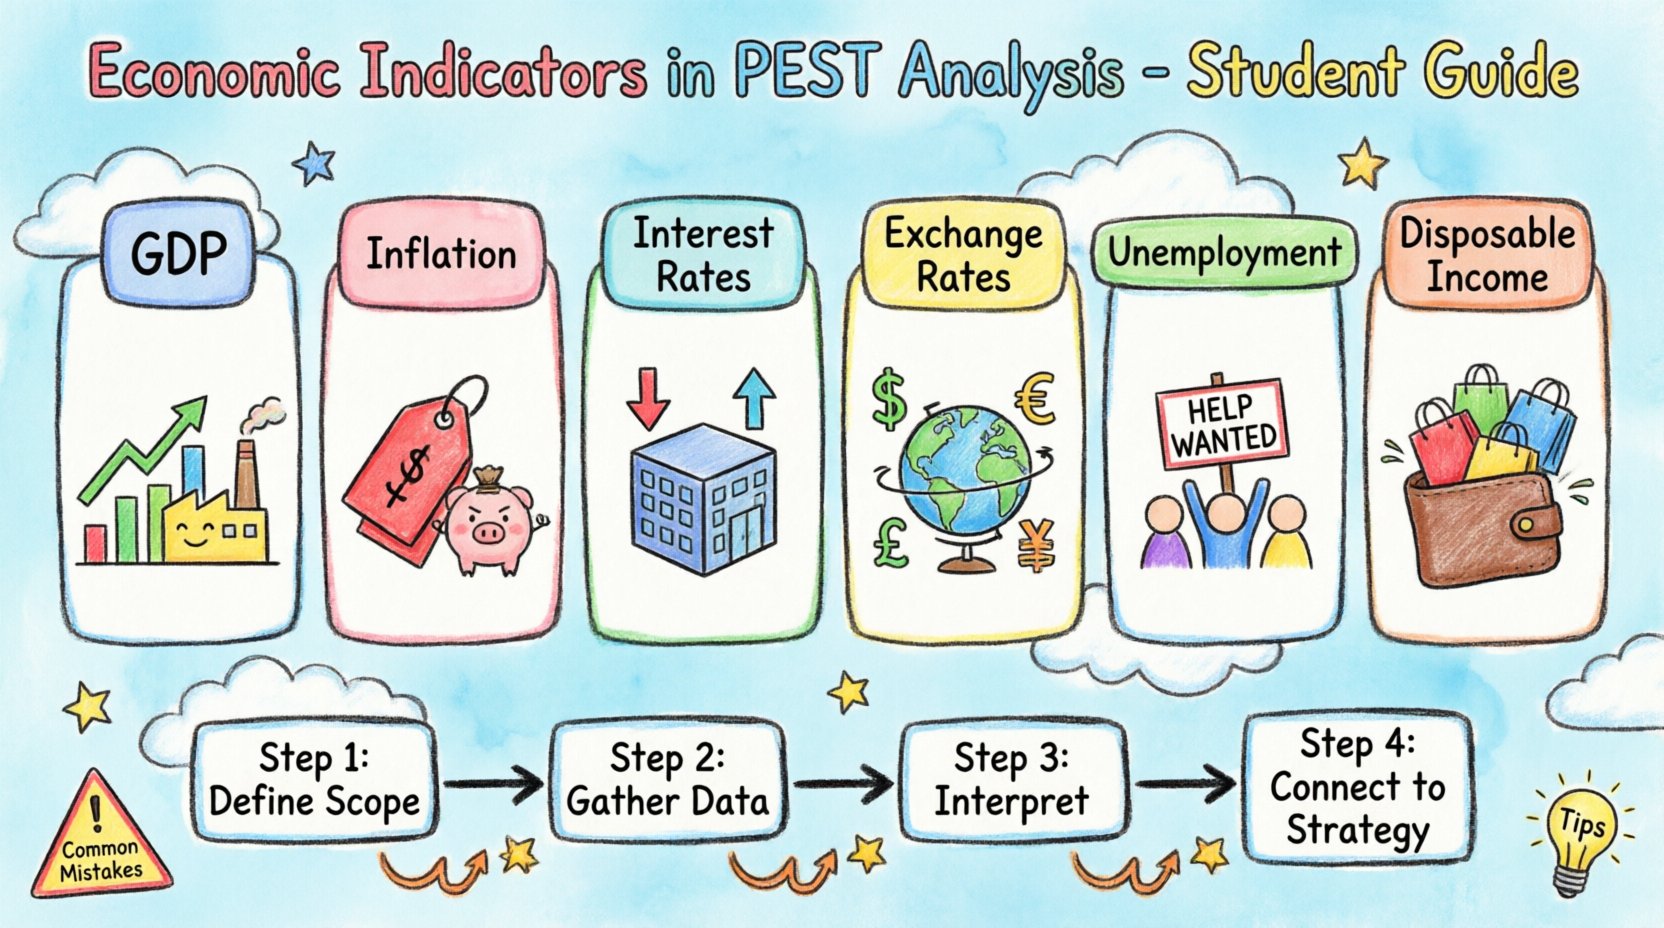
📈 Key Economic Indicators Explained
To conduct a robust analysis, you must identify the specific indicators that matter for your chosen industry. Not all indicators apply to every business. Below are the primary metrics used in academic and professional settings.
1. Gross Domestic Product (GDP) 🏛️
GDP measures the total value of goods and services produced over a specific time period. It is the broadest measure of economic activity.
Growth: Rising GDP typically indicates a growing economy. Businesses can expect higher demand.
Recession: Two consecutive quarters of negative growth signal a recession. This often leads to reduced consumer spending.
Per Capita: Dividing GDP by population gives a sense of average income, which helps assess purchasing power.
2. Inflation and Deflation 📉
Inflation represents the rate at which the general level of prices for goods and services is rising. Purchasing power falls as inflation rises.
Consumer Price Index (CPI): Tracks changes in the price of a basket of consumer goods. High CPI suggests lower real income for consumers.
Producer Price Index (PPI): Measures the average change in selling prices received by domestic producers. This often predicts future consumer price changes.
Deflation: Falling prices can be dangerous. While good for consumers, it signals weak demand and can lead to wage cuts or layoffs.
3. Interest Rates 💳
Interest rates determine the cost of borrowing money. Central banks set these rates to control inflation and stabilize the economy.
Low Rates: Encourage borrowing for expansion and consumer spending on big-ticket items like homes or cars.
High Rates: Discourage borrowing. This cools down the economy but makes saving more attractive.
Impact on Capital: High rates increase the cost of capital for businesses, potentially delaying new projects.
4. Exchange Rates 💱
The value of one currency against another affects international trade. This is crucial for businesses that import raw materials or export finished goods.
Strong Currency: Makes imports cheaper but exports more expensive for foreign buyers.
Weak Currency: Boosts exports by making them cheaper but increases the cost of imported components.
Volatility: Rapid fluctuations create uncertainty, making it difficult for firms to plan budgets.
5. Unemployment Rates 📋
The unemployment rate reflects the percentage of the labor force that is jobless and actively looking for work.
High Unemployment: Reduces disposable income and consumer confidence. Retail and luxury sectors suffer.
Low Unemployment: Indicates a tight labor market. Wages may rise, increasing operational costs for employers.
Labor Supply: Affects the availability of skilled workers needed for specific projects.
6. Disposable Income 💵
This is the amount of household income left after paying taxes and necessary expenses like food and housing.
Consumer Spending: Directly correlates with disposable income. If this figure rises, retail sales often follow.
Savings Rate: High savings rates during uncertain times indicate consumers are hoarding cash rather than spending.
🏭 Industry Sensitivity to Economic Indicators
Different sectors react differently to economic shifts. A student must tailor their analysis based on the specific industry being studied. The table below outlines common sensitivities.
Industry Sector | Primary Economic Concern | Impact Description |
|---|---|---|
Real Estate | Interest Rates | Mortgage costs directly affect housing demand. |
Retail | Disposable Income | Consumer spending power dictates sales volume. |
Manufacturing | Raw Material Prices | Inflation impacts production costs and margins. |
Export Business | Exchange Rates | Currency strength determines global competitiveness. |
Banking | Interest Rates | Net interest margins depend on rate spreads. |
Healthcare | Unemployment | Job loss often correlates with reduced elective care. |
🎓 How Students Can Analyze These Indicators
Performing this analysis for an assignment or project requires a systematic approach. You do not need expensive tools to gather this data. Publicly available information from government bodies is often sufficient.
Step 1: Define the Scope
Identify the geographic region (e.g., United States, European Union, Global).
Select the specific industry or company under review.
Choose the time period (e.g., current year, last 5 years).
Step 2: Gather Data Sources
Government Agencies: Look for reports from central banks, labor bureaus, or statistical offices.
International Organizations: Data from the IMF, World Bank, or OECD provides global context.
News Outlets: Reputable financial news sources often summarize complex data into readable trends.
Step 3: Interpret the Data
Do not just list numbers. Explain what the numbers mean for the business.
Look for anomalies. Is inflation higher than expected? Is GDP growth slowing?
Consider lag times. Interest rate changes might take months to fully impact consumer behavior.
Step 4: Connect to Strategy
If interest rates are rising, should the company delay expansion?
If disposable income is falling, should the brand focus on value products?
If the currency is weak, should the company hedge against currency risk?
🔄 Integration with Other PEST Factors
The economic factor does not exist in a vacuum. It interacts dynamically with the other three pillars of the framework. Understanding these relationships adds depth to your analysis.
Economic & Social
Economic conditions shape social trends. During a recession, social spending on entertainment or travel may decline. Conversely, economic growth can lead to increased demand for education and wellness services. Students should note how purchasing power influences social behaviors.
Economic & Technological
Technology adoption often requires capital investment. In an environment with high interest rates, companies may delay adopting new software or hardware. However, economic pressure can also drive innovation, forcing firms to find cost-saving technologies. This creates a complex relationship between cost and efficiency.
Economic & Political
Government policy drives economic conditions. Fiscal policy (taxation and spending) and monetary policy (interest rates) are political decisions with economic outcomes. Trade tariffs, for instance, are political actions that alter economic costs for importers.
⚠️ Common Mistakes to Avoid
Even experienced analysts make errors. Students should be vigilant about these common pitfalls to ensure their analysis holds up to scrutiny.
Correlation vs. Causation: Just because two indicators move together does not mean one causes the other. Avoid assuming a direct link without evidence.
Ignoring Regional Differences: National data can mask local realities. A city might be booming while the national average is flat.
Overlooking Lag Effects: Economic indicators are often backward-looking. They describe the past, not the future. Students must project forward based on current trends.
Static Analysis: The economy changes. A snapshot from last year is insufficient for a long-term strategy.
Ignoring Global Context: In a globalized world, domestic indicators are influenced by foreign events. Trade wars or global pandemics can disrupt local economic stability.
🌍 Real-World Application Examples
Applying theory to practice helps solidify understanding. Consider how different businesses react to specific economic shifts.
Case A: The Housing Market
When central banks raise interest rates, mortgage rates usually follow. For a real estate developer, this means fewer buyers can afford homes. The PEST analysis would suggest a slowdown in demand. The strategy might shift from building luxury units to affordable housing or slowing construction to avoid debt.
Case B: The Retail Sector
During periods of high inflation, consumers feel the pinch. A clothing retailer might see a drop in sales for premium lines. The economic analysis suggests a pivot towards value-oriented brands. The business might also adjust inventory levels to prevent overstocking if disposable income is projected to drop.
Case C: The Import/Export Business
If a company imports raw materials from abroad and the local currency weakens, costs rise. A PEST analysis highlights the need to diversify suppliers or pass costs to consumers. If the company exports, a weak currency might boost sales abroad, but hedging strategies become essential to lock in profits.
📚 Resources for Further Study
Deepening your knowledge of economic indicators requires ongoing research. Here are areas where you can find reliable information.
National Statistical Offices: These government bodies publish official data on GDP, employment, and prices.
Central Bank Publications: Reports from the Federal Reserve, ECB, or Bank of England provide insight into monetary policy.
Economic Journals: Academic papers offer deep dives into specific economic theories and historical data analysis.
Industry Reports: Sector-specific analysts often publish economic impact assessments relevant to their field.
🧠 Final Thoughts on Economic Analysis
Mastery of economic indicators within the PEST framework is a skill that develops over time. It requires patience, critical thinking, and a willingness to look beyond surface-level numbers. For students, this knowledge is invaluable. It transforms a simple assignment into a strategic exercise that mirrors real-world decision-making.
Remember that data is a tool, not a crystal ball. Use it to inform your strategy, manage risk, and identify opportunities. By understanding the economic pulse, you position yourself to make informed decisions in a complex business environment. The goal is not to control the economy, but to navigate it effectively.
As you move forward in your studies, keep these indicators in mind. They are the backdrop against which all business strategies are written. Whether you are writing a report or planning a career, a strong grasp of economic fundamentals will serve as a solid foundation for your professional journey.