


Designing a robust database requires a clear map of data structures. An Entity-Relationship Diagram (ERD) serves as this blueprint, visualizing how data connects within a system. Understanding the core components—entities, attributes, and relationships—is essential for building scalable solutions. This guide explores these elements in depth, ensuring a solid foundation for database architecture.
🏗️ What is an ERD?
An ERD is a visual representation of the structure of a database. It outlines the data elements and their interconnections. Think of it as an architectural plan for a building, where the database is the structure and the data is the inhabitants. It bridges the gap between abstract business requirements and concrete technical implementation.
Key benefits include:
- Clarity: Stakeholders can visualize data flow without writing code.
- Consistency: Ensures data rules are applied uniformly across the system.
- Efficiency: Reduces errors during the development phase by catching design flaws early.
- Communication: Provides a common language for developers, analysts, and business owners.
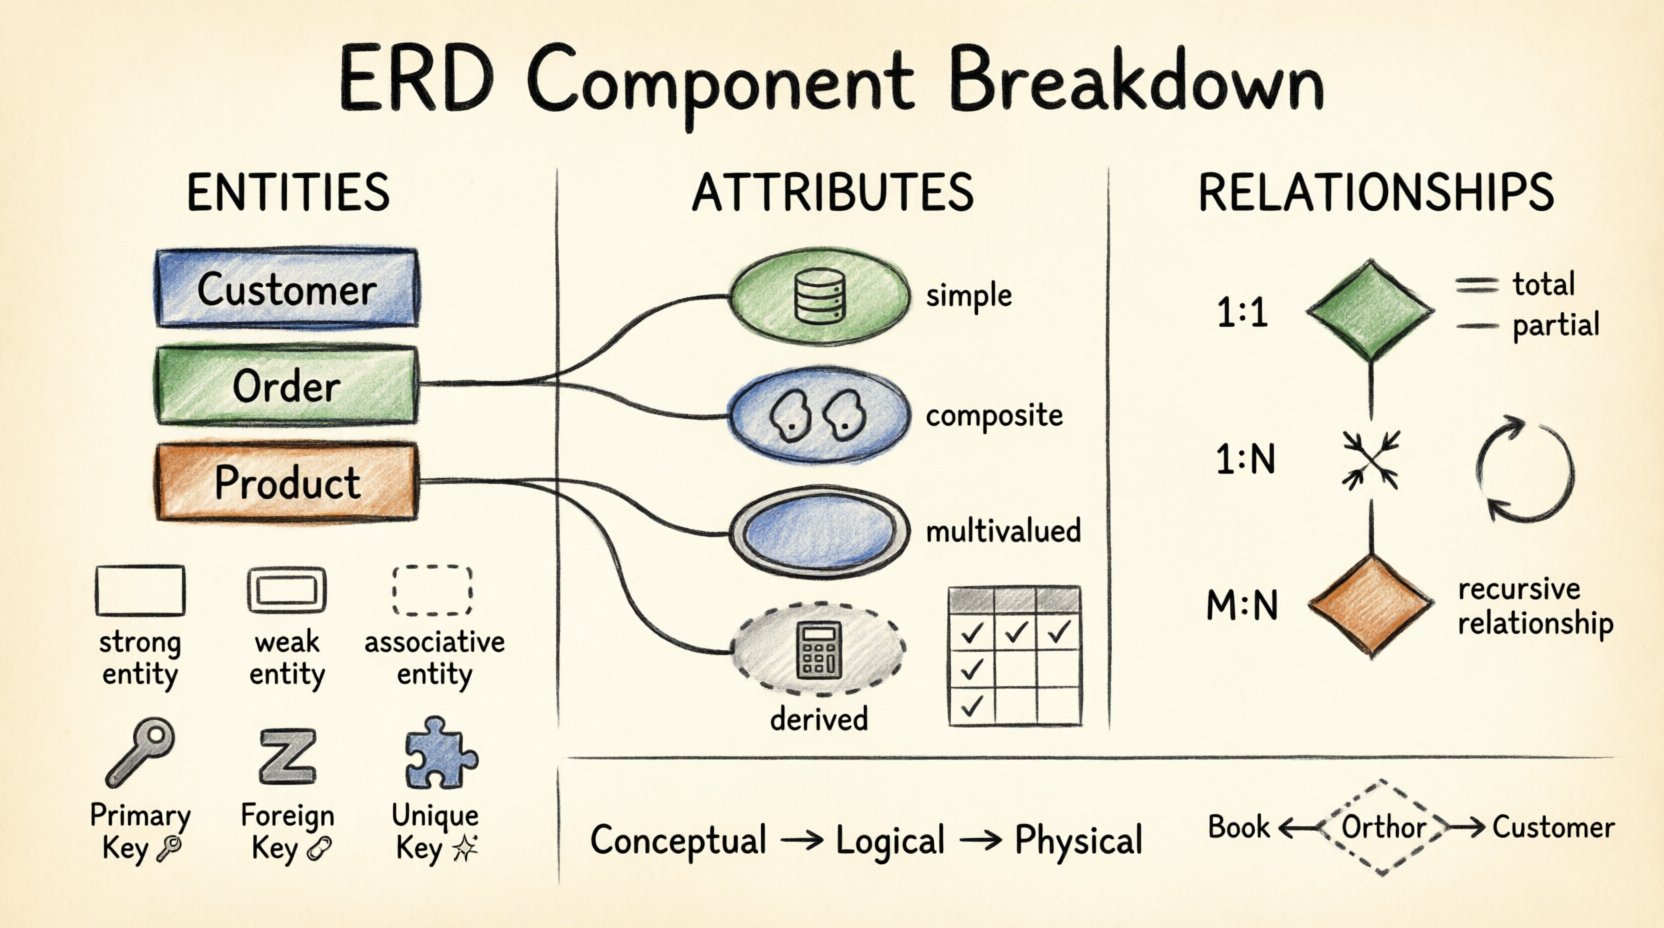
🔑 Component 1: Entities
Entities represent real-world objects or concepts that need to be stored in the database. They are the fundamental building blocks of the model. Every entity should be distinct and identifiable.
1.1 Defining Entities
An entity is typically a noun, such as Customer, Order, or Product. In the diagram, they are often depicted as rectangles. Each entity represents a collection of similar objects.
1.2 Types of Entities
Not all entities function the same way. Distinguishing between them helps in modeling complex scenarios.
- Strong (Regular) Entities: These exist independently. They have their own primary key and do not rely on another entity for existence.
- Weak Entities: These depend on a strong entity for their identity. They cannot exist without the parent entity. They are often depicted with a double rectangle.
- Associative Entities: These resolve many-to-many relationships by breaking them into two one-to-many relationships. They act as a bridge table containing foreign keys from both related entities.
1.3 Entity Identification
Every entity must have a unique identifier. Without this, distinguishing between two records becomes impossible. Common strategies include:
- Using a system-generated ID (e.g., UUID).
- Using a natural key (e.g., Social Security Number, ISBN).
- Using a composite key (combination of multiple attributes).
📝 Component 2: Attributes
Attributes are the properties or characteristics that describe an entity. If an entity is a person, attributes are their name, age, and address. They are usually represented by ovals connected to the entity rectangle.
2.1 Classifying Attributes
Attributes vary in complexity and function. Understanding these categories aids in normalization and query optimization.
- Simple Attributes: Atomic values that cannot be divided further. Example: Age or Color.
- Composite Attributes: Can be subdivided into other attributes. Example: Address can be split into Street, City, and Zip Code.
- Multivalued Attributes: An entity can have multiple values for this attribute. Example: Phone Numbers or Education Degrees. These are often represented by a double oval.
- Derived Attributes: Calculated from other attributes. Example: Age can be derived from Date of Birth. These are typically not stored physically to save space.
2.2 Key Attributes
Certain attributes serve specific roles in data integrity. A table summarizes the key types:
| Key Type | Function | Example |
|---|---|---|
| Primary Key | Uniquely identifies each record in a table. | CustomerID |
| Foreign Key | Links one table to another via a primary key. | OrderID (in OrderItems) |
| Unique Key | Ensures no duplicate values but allows NULLs. | EmailAddress |
| Candidate Key | Any attribute that could serve as a primary key. | SSN, PassportNumber |
2.3 Null vs. Not Null
Constraints define whether an attribute must contain data. A NOT NULL constraint ensures data presence, which is critical for primary keys. NULL values indicate missing or unknown data, requiring careful handling in application logic.
🔗 Component 3: Relationships
Relationships define how entities interact with one another. They describe the business logic connecting data points. In an ERD, relationships are shown as diamonds connecting entity rectangles.
3.1 Cardinality
Cardinality specifies the number of instances of one entity that relate to the number of instances of another. It is the most critical aspect of relationship modeling.
- One-to-One (1:1): One instance of Entity A relates to exactly one instance of Entity B. Example: Person to Passport.
- One-to-Many (1:N): One instance of Entity A relates to many instances of Entity B. Example: Department to Employee.
- Many-to-Many (M:N): Many instances of Entity A relate to many instances of Entity B. Example: Student to Course. This requires an associative entity to resolve.
3.2 Participation Constraints
Participation determines if an entity must be involved in a relationship. It is often called existence dependency.
- Total Participation: Every instance of an entity must participate in the relationship. Represented by a double line. Example: Every Order must have at least one Customer.
- Partial Participation: Some instances may not participate. Represented by a single line. Example: An Employee might not have a Spouse record yet.
3.3 Relationship Types
Beyond cardinality, relationships can be categorized by their nature.
| Type | Description | Example |
|---|---|---|
| Identifying | The weak entity depends on the strong entity for its identity. | Child depends on Parent |
| Non-Identifying | The relationship exists, but the child has its own identity. | Manager manages Employee |
| Recursive | An entity relates to itself. | Employee supervises Employee |
📊 Component 4: Notation Styles
While the logic remains the same, visual representation varies. Knowing the common styles helps in reading diagrams created by different teams.
4.1 Crow’s Foot Notation
This is the most widely used style. It uses symbols like a line, a circle, and a crow’s foot (three lines) to denote cardinality.
- One Line: Mandatory One.
- Circle: Optional (Zero).
- Crow’s Foot: Many.
4.2 Chen Notation
Named after Peter Chen, the creator of ERDs. It uses rectangles for entities, diamonds for relationships, and ovals for attributes. It is more abstract and often used in academic contexts.
4.3 UML Class Diagrams
Unified Modeling Language diagrams use similar concepts but are tailored for object-oriented programming. They include visibility indicators (+, -, #) and method lists.
🛠️ Component 5: Normalization and ERD
Normalization is the process of organizing data to reduce redundancy and improve integrity. The ERD is the visual output of this process.
5.1 The Process
- First Normal Form (1NF): Ensure atomic values. No repeating groups.
- Second Normal Form (2NF): Remove partial dependencies. All non-key attributes must depend on the whole primary key.
- Third Normal Form (3NF): Remove transitive dependencies. Non-key attributes should not depend on other non-key attributes.
5.2 Impact on Design
Normalization often increases the number of tables. While this improves data integrity, it can complicate queries. The ERD helps visualize this trade-off, showing where joins are required to retrieve full information.
⚠️ Common Pitfalls
Even experienced designers make mistakes. Awareness of common errors prevents future technical debt.
- Ambiguous Names: Using terms like Data or Info makes the model hard to understand. Use specific nouns like TransactionLog.
- Missing Cardinality: Forgetting to define if a relationship is optional or mandatory leads to data integrity issues.
- Circular Dependencies: Entity A depends on B, and B depends on A. This creates a logical loop that database engines cannot resolve.
- Over-Normalization: Creating too many tables can make querying slow. Balance normalization with performance needs.
- Ignoring Business Rules: A diagram that looks perfect structurally might fail if it doesn’t reflect actual business constraints.
🚀 Best Practices
Adhering to standards ensures maintainability and collaboration.
6.1 Naming Conventions
Consistency is key. Use a standard format for all names.
- Plural vs. Singular: Choose one and stick to it. (e.g., Customer vs. Customers).
- Underscores: Use snake_case for database columns (e.g., customer_id).
- Meaningful Prefixes: Indicate table types (e.g., tbl_ or dim_).
6.2 Documentation
An ERD is not a standalone artifact. It needs context.
- Include a data dictionary explaining each attribute.
- Document the business rules behind constraints.
- Version control the diagrams to track changes over time.
6.3 Review Cycles
Never finalize a design without peer review.
- Technical Review: Check for normalization and key integrity.
- Business Review: Ensure the model matches the real-world workflow.
- Performance Review: Assess indexing strategies and join complexity.
🔍 Practical Example
Consider an online bookstore. The core entities would be Book, Author, and Customer.
- Book: Attributes include ISBN (Primary Key), Title, and Price.
- Author: Attributes include AuthorID (Primary Key) and Name.
- Relationship: A Book can have multiple Authors (Many-to-Many). An Author can write multiple Books.
- Resolution: Create an associative entity Book_Author containing ISBN and AuthorID.
This structure allows for flexible data entry without duplicating author information for every book.
📈 Evolution of the Model
Database designs are rarely static. As business requirements change, the ERD must evolve.
- Conceptual Model: High-level view for stakeholders. Focuses on entities and relationships without technical details.
- Logical Model: Adds attributes and keys. Defines data types and relationships precisely.
- Physical Model: Optimized for a specific database engine. Includes indexes, partitioning, and storage details.
Transitions between these stages require careful validation to ensure data integrity is maintained throughout the lifecycle.
🧩 Advanced Concepts
For complex systems, standard ERDs may need extensions.
7.1 Supertypes and Subtypes
Generalization and specialization allow for inheritance. A Vehicle entity can be specialized into Car and Truck. This reduces redundancy for common attributes while allowing unique ones for subtypes.
7.2 Aggregation
When a relationship itself needs to be treated as an entity. For example, a Consultation between a Doctor and a Patient has its own attributes like Date and Diagnosis.
7.3 Ternary Relationships
Relationships involving three entities. While possible, they are often difficult to implement in relational databases. Decomposition into binary relationships is usually preferred.
🔍 Conclusion
Mastering the components of an Entity-Relationship Diagram is fundamental to effective data management. By clearly defining entities, attributes, and relationships, teams can build systems that are both robust and flexible. Attention to detail during the design phase pays dividends in the development and maintenance phases. Regular reviews and adherence to best practices ensure the database remains a reliable asset for the organization.
As data volumes grow, the need for precise modeling increases. Investing time in understanding these core concepts ensures long-term success in database architecture.