Introduction
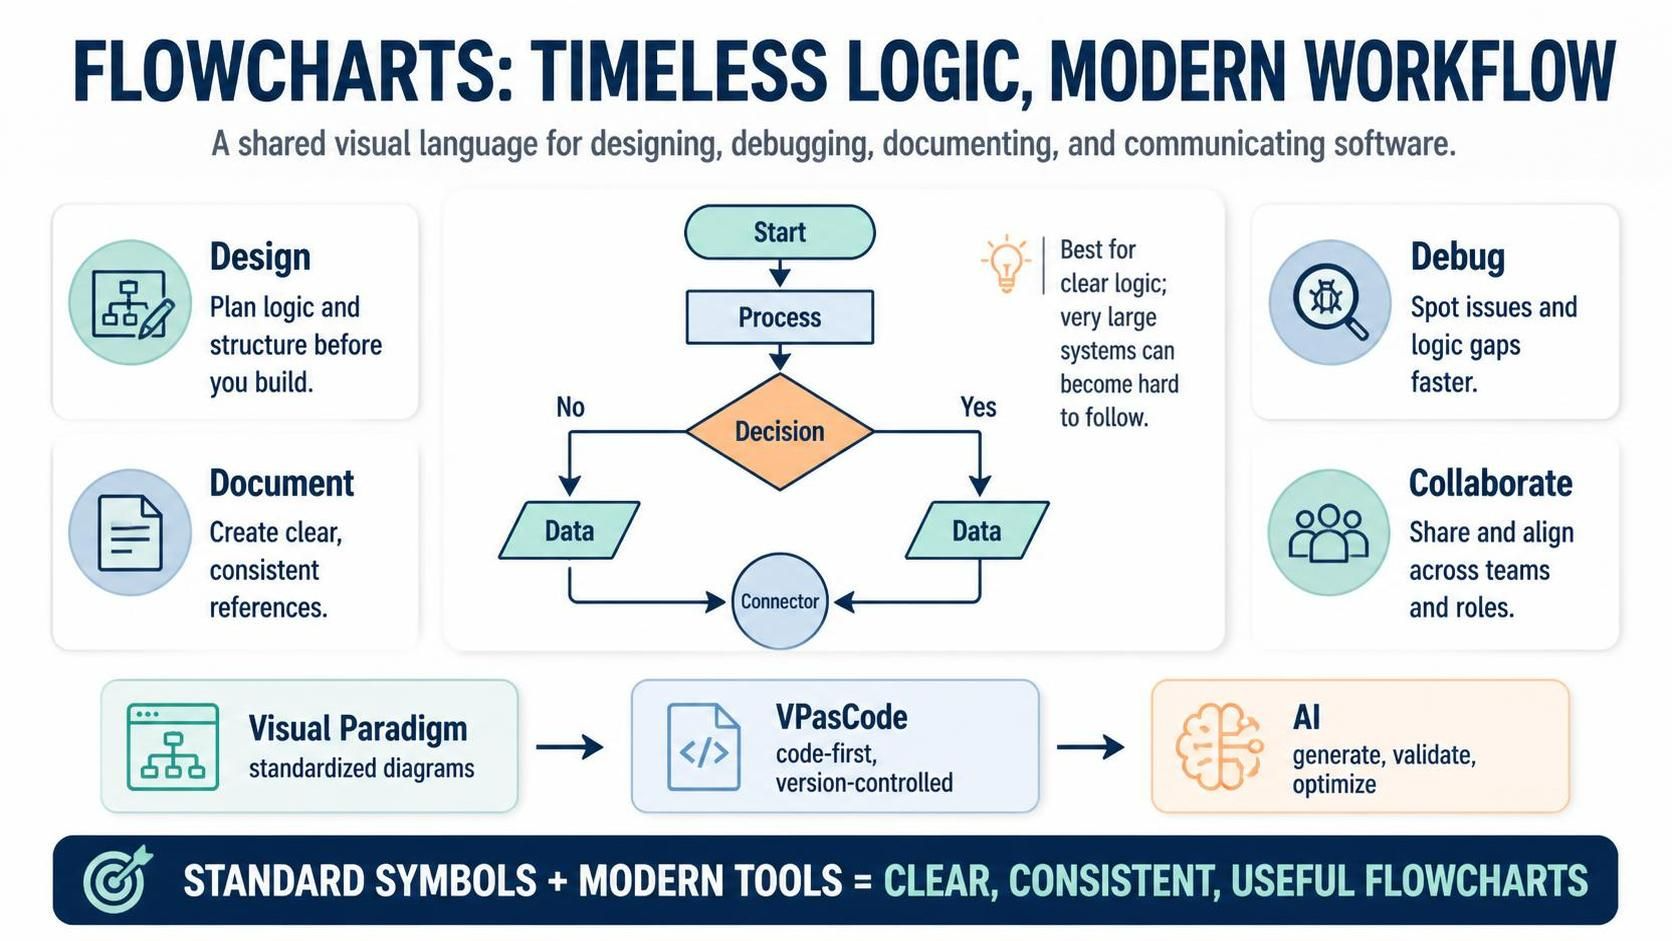
Flowcharts are graphical representations of data, algorithms, or processes that provide a visual approach to understanding code. They illustrate step-by-step solutions to problems, making them invaluable tools for beginner programmers, while also serving as powerful aids for debugging, troubleshooting, and communicating complex logic across teams. Because flowcharts visually represent algorithms or workflows, they are far easier to interpret and understand than raw code alone. However, to create an effective flowchart, certain standardized rules must be followed—ensuring clarity and consistency across different professionals worldwide.
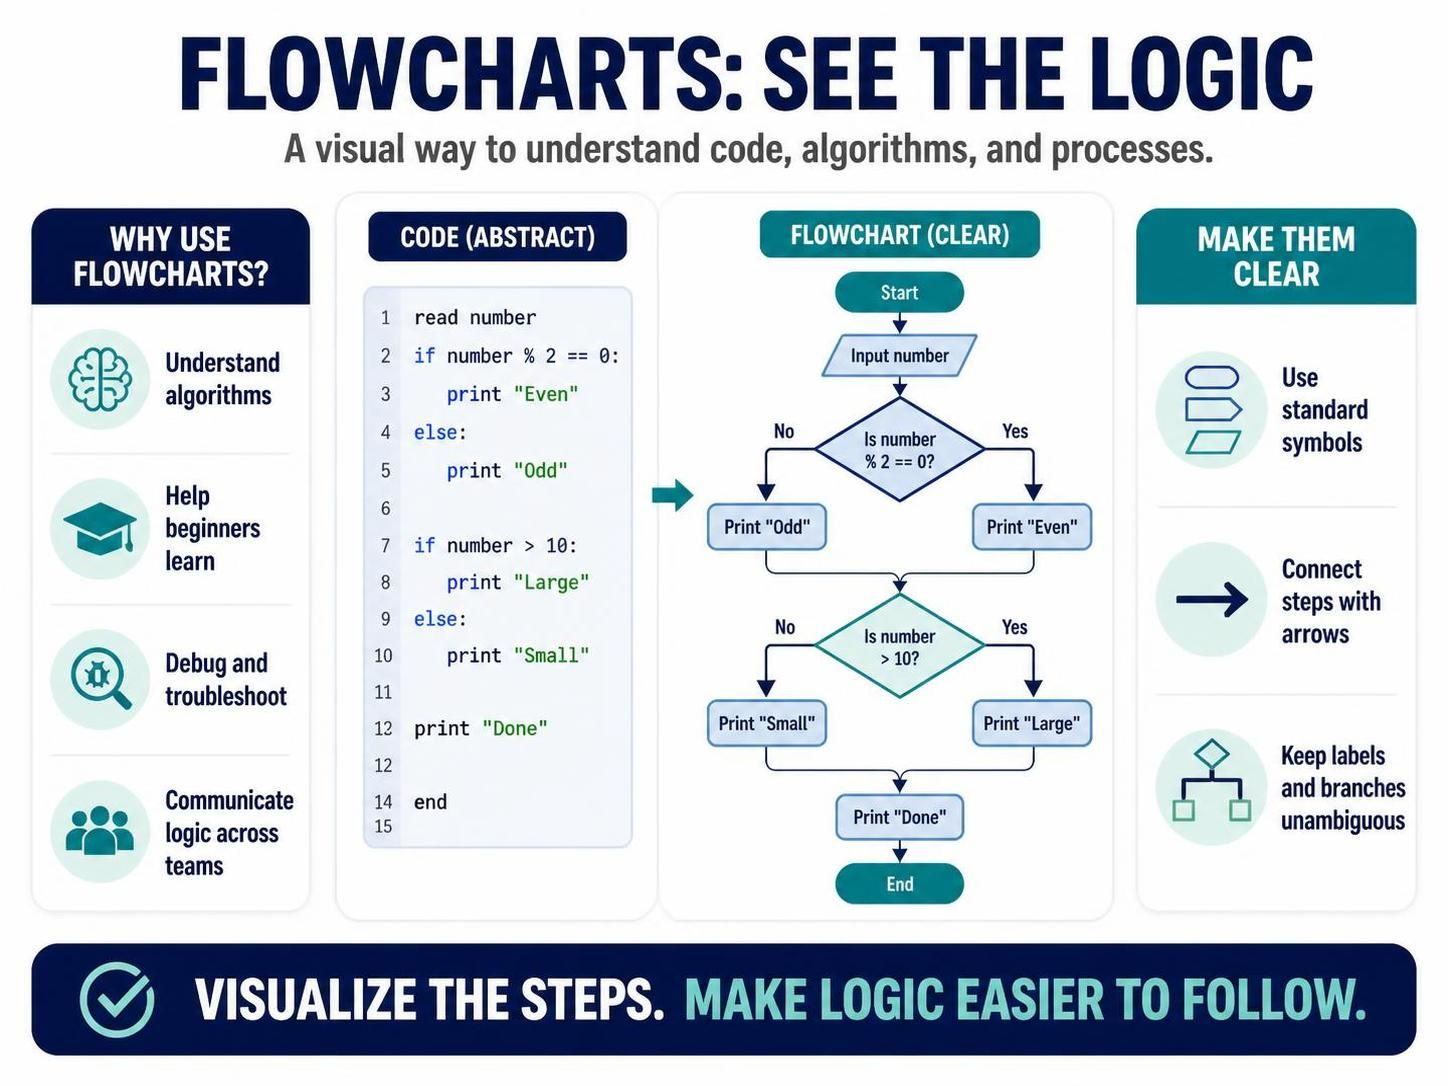
This comprehensive guide explores the foundational concepts of flowcharts, the standard symbols used to construct them, their practical applications in programming and business, and how modern tools—including Visual Paradigm, the VPasCode tool, and AI—are transforming the way flowcharts are created and used.
Key Concepts
1. What Is a Flowchart?
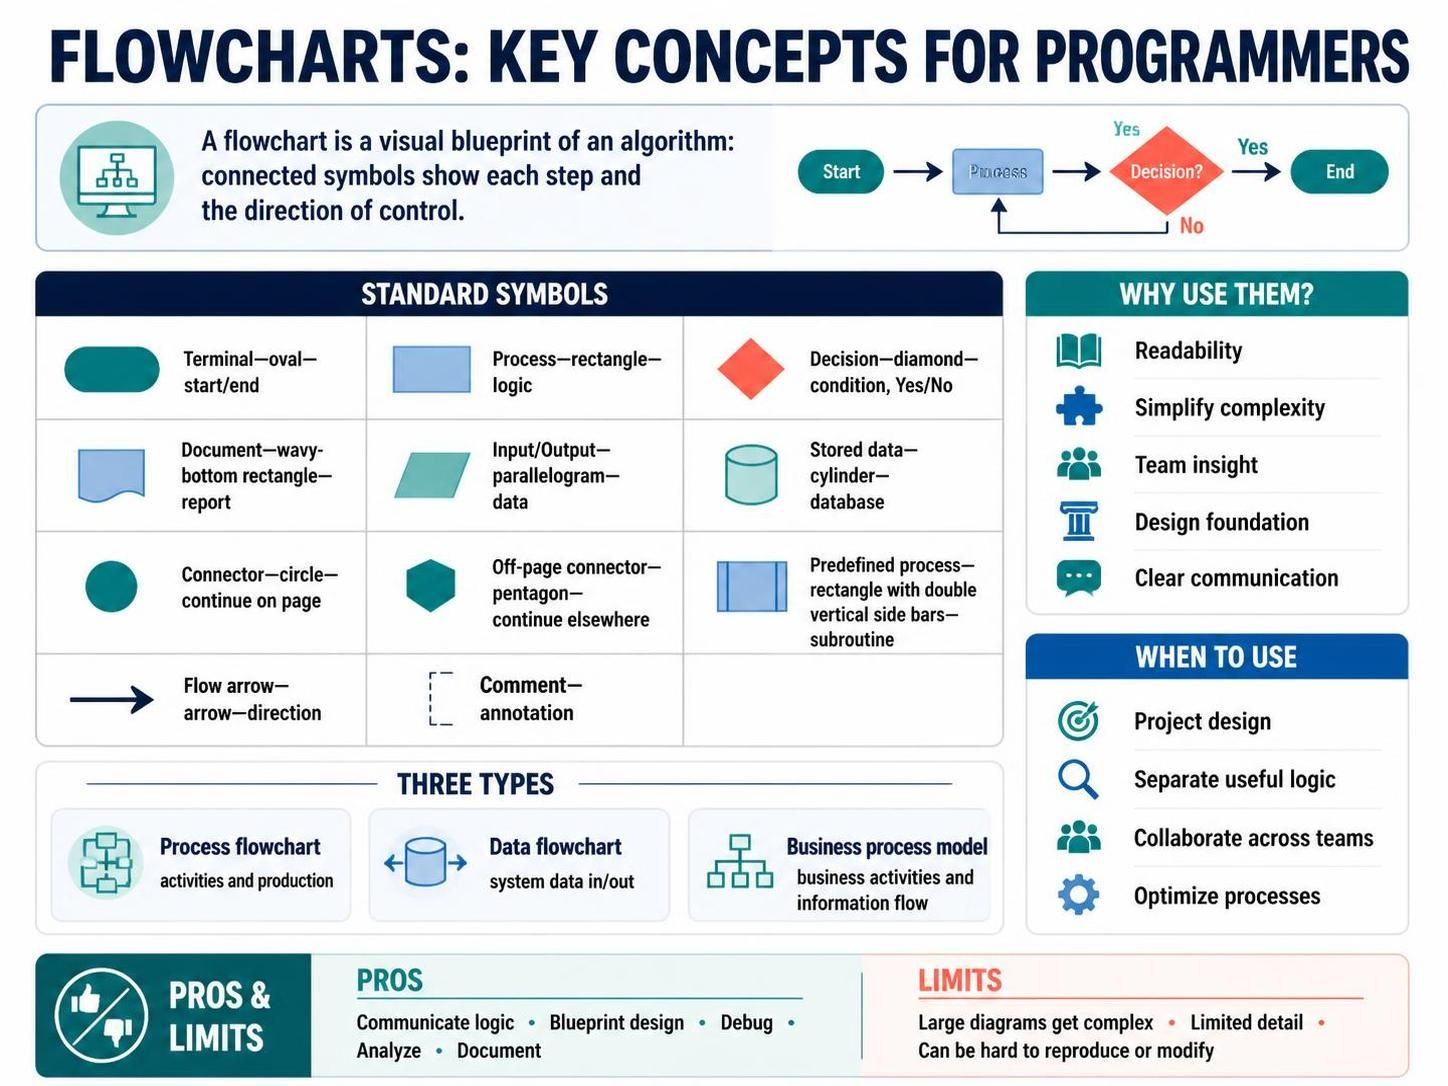
A flowchart is a diagram composed of sequentially arranged boxes—each depicting a step in a process—connected by arrow lines that display the flow of control. It acts as a blueprint for algorithms, making the logic of a program tangible and visual.
2. The Standardized Symbols
Every effective flowchart relies on a universal vocabulary of shapes. All boxes are connected by arrow lines that show the direction of process flow. The table below summarizes the core symbols:
| Symbol Name | Shape | Purpose |
|---|---|---|
| Terminal/Terminator | Oval | Indicates the start or end of the program |
| Process | Rectangle | Contains the main logic or processing code |
| Decision | Rhombus | Holds conditions (e.g., a > 0) with “Yes”/”No” paths |
| Document | Wavy-bottom rectangle | Represents a document or report |
| Data or Input/Output | Parallelogram | Shows inputs entering or outputs leaving the system |
| Stored Data | Cylinder | Represents stored data |
| Flow Arrow | Arrow | Displays the direction of control flow |
| Comment or Annotation | Bracket/dashed | Adds explanatory notes |
| Predefined Process | Rectangle with side bars | Represents a named subroutine or module |
| On-page Connector | Circle (numbered) | Continues flow elsewhere on the same page |
| Off-page Connector | Pentagon (numbered) | Continues flow onto another page |
3. Uses of Flowcharts in Programming and Algorithms
-
Readability: A pictorial representation of an algorithm increases how easily a program can be read and understood.
-
Simplification: Complex programs can be drawn in a simple, digestible way.
-
Team Insight: Team members gain insight into processes, enabling them to collect data, detect problems, and develop software collaboratively.
-
Design Foundation: Flowcharts are a basic first step for designing new processes or adding features.
-
Communication: Sharing flowcharts makes communication with stakeholders far easier.
4. When to Use Flowcharts
-
Project Design: Programmers prefer flowcharts as a basic step to design projects pictorially.
-
Separating Sound Logic: Drawing a flowchart reveals non-useful parts of a process, helping separate sound logic from unwanted elements.
-
Universal Communication: Because drawing rules are universal, flowcharts serve as a communication channel for everyone working on the same project.
-
Optimization: Process optimization becomes easier, and code efficiency improves, with flowchart-based planning.
5. Types of Flowcharts
-
Process Flowchart: Shows all activities involved in making a product, providing a pathway to analyze what is to be built. Common in process engineering and business product modelling.
-
Data Flowchart: Analyzes data and structural details, making data inflow and outflow from the system easy to understand.
-
Business Process Modelling Diagram: Analytically represents business processes, simplifying the concepts needed to understand business activities and information flow—paving the way for process improvement.
6. Advantages and Disadvantages
Advantages:
-
The most efficient way of communicating system logic
-
Acts as a blueprint during program design
-
Aids the debugging process
-
Enables easy analysis of programs
-
Excellent for documentation
Disadvantages:
-
Challenging to draw for large, complex programs
-
Lacks proper amounts of detail
-
Difficult to reproduce
-
Difficult to modify
Diagram Examples Using PlantUML Code
PlantUML provides a text-based way to generate flowcharts that render consistently and can be version-controlled. Below are several examples covering the core constructs.
Example 1: Basic Start → Input → Process → Output → End
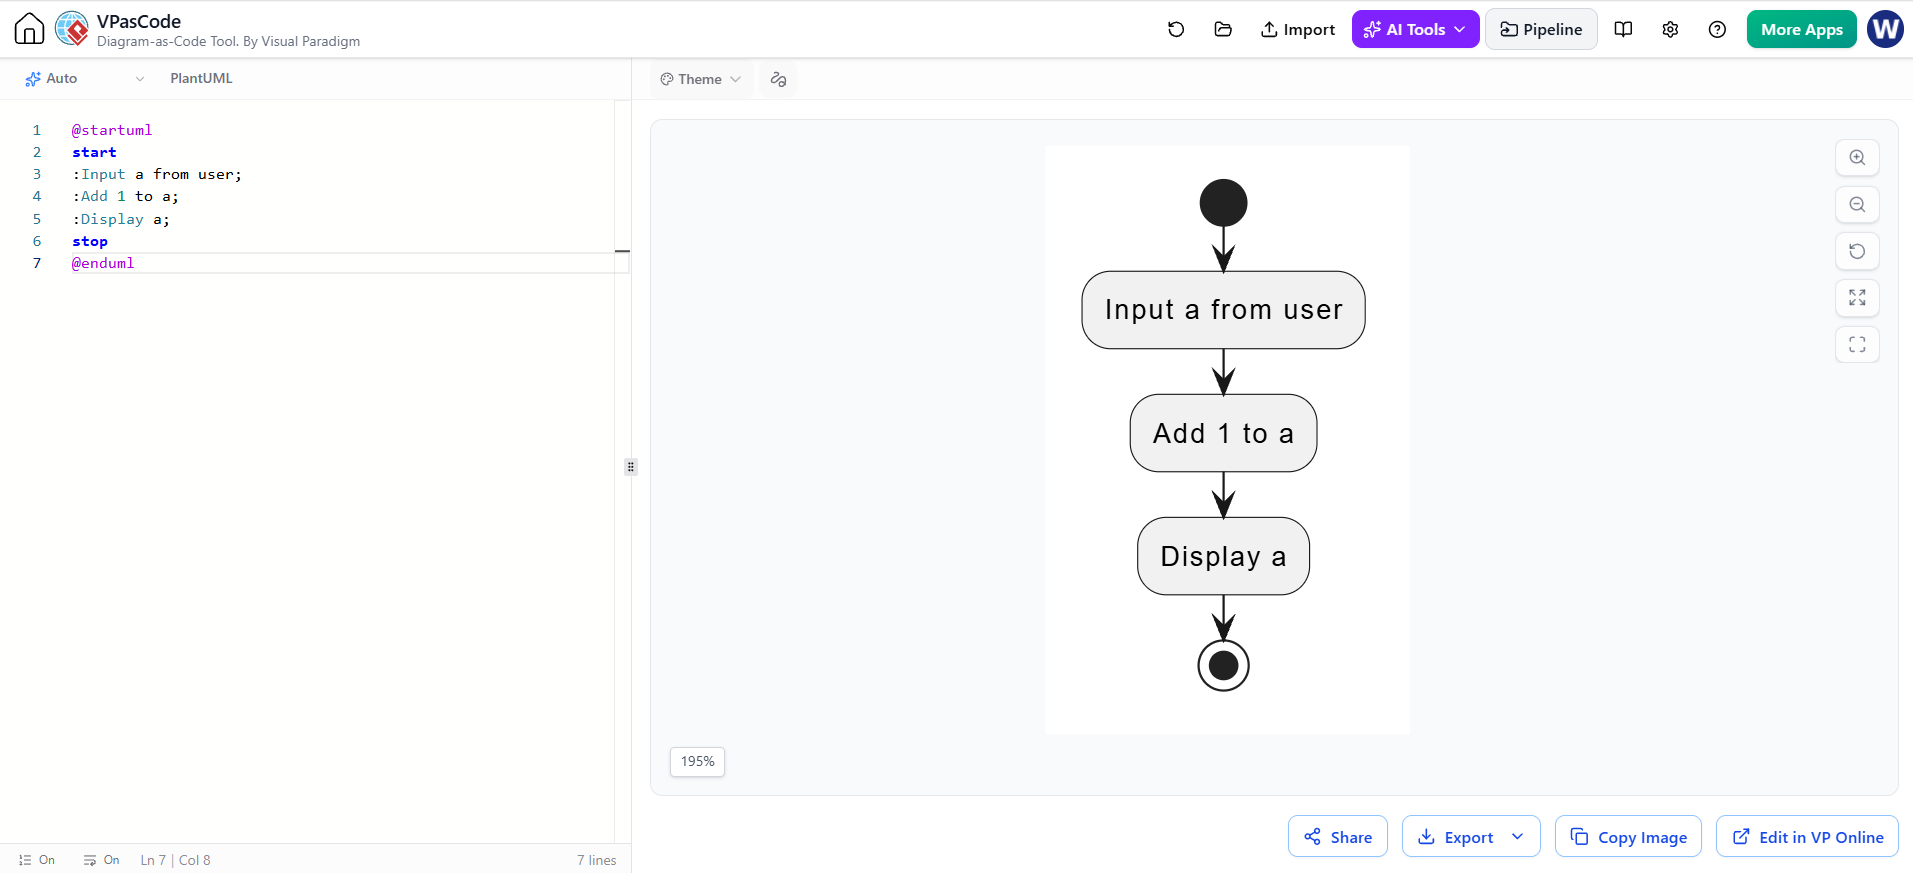
@startuml
start
:Input a from user;
:Add 1 to a;
:Display a;
stop
@enduml
Example 2: Decision Making (Even/Odd Number)
This mirrors the classic example: add 1 to an even number, subtract 1 if the number is odd.
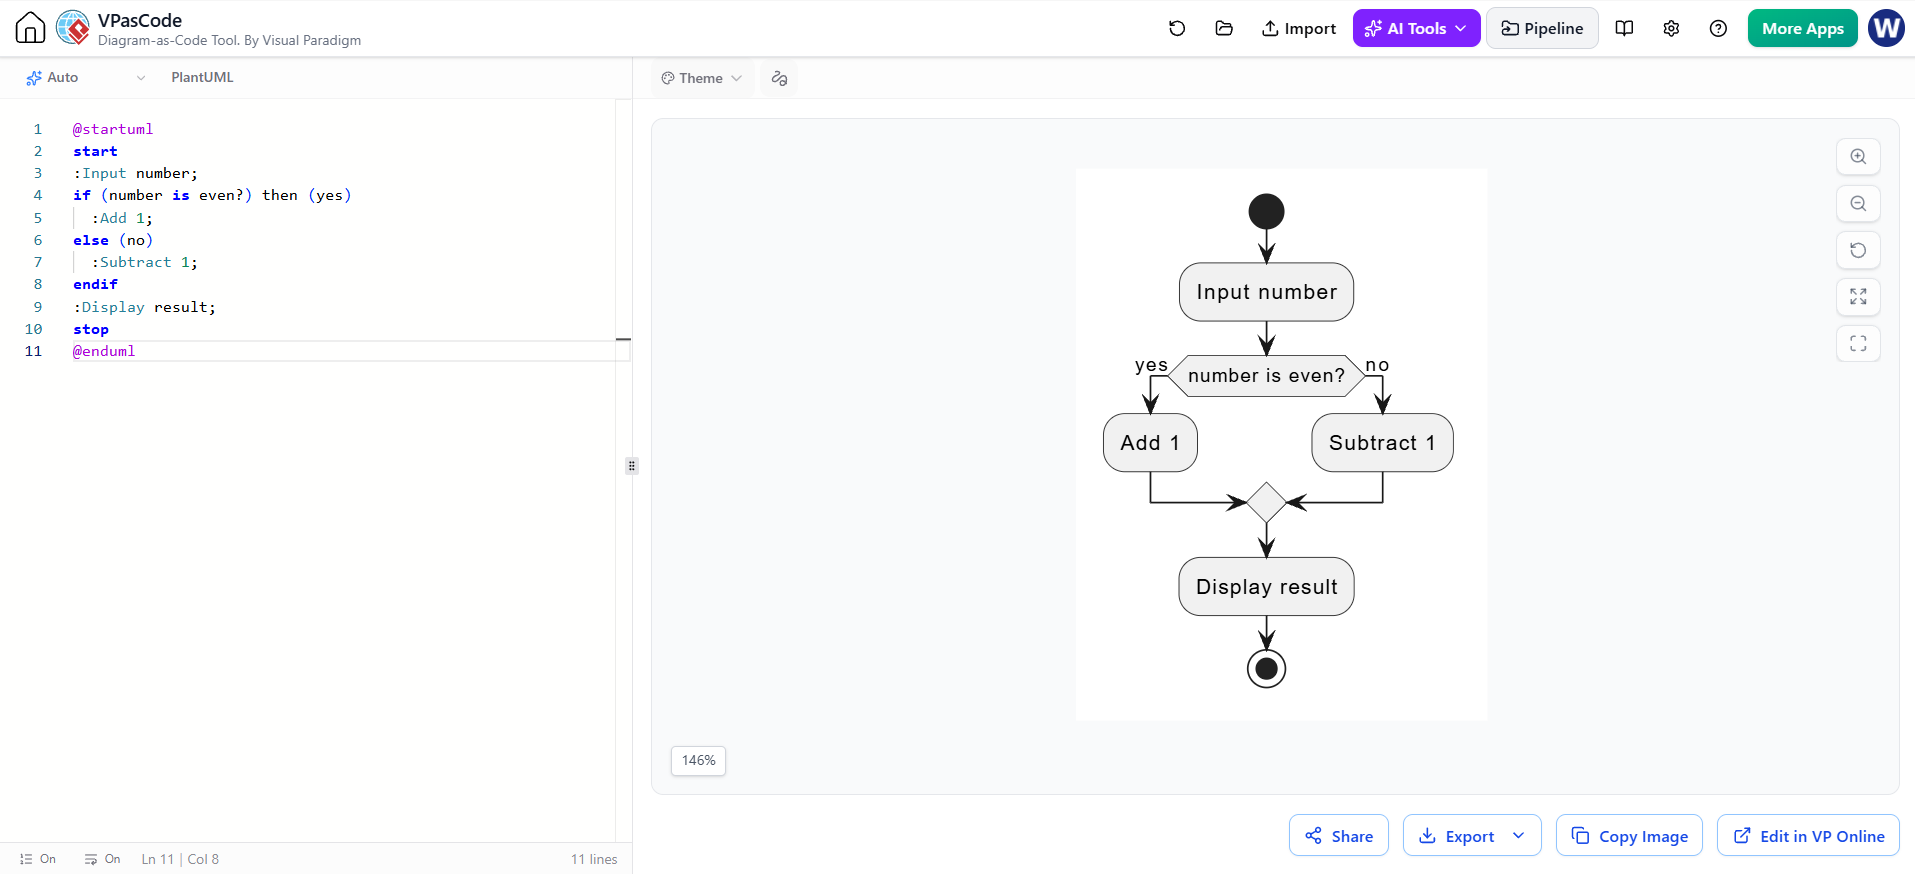
@startuml
start
:Input number;
if (number is even?) then (yes)
  :Add 1;
else (no)
  :Subtract 1;
endif
:Display result;
stop
@enduml
Example 3: Loop with On-Page Reference
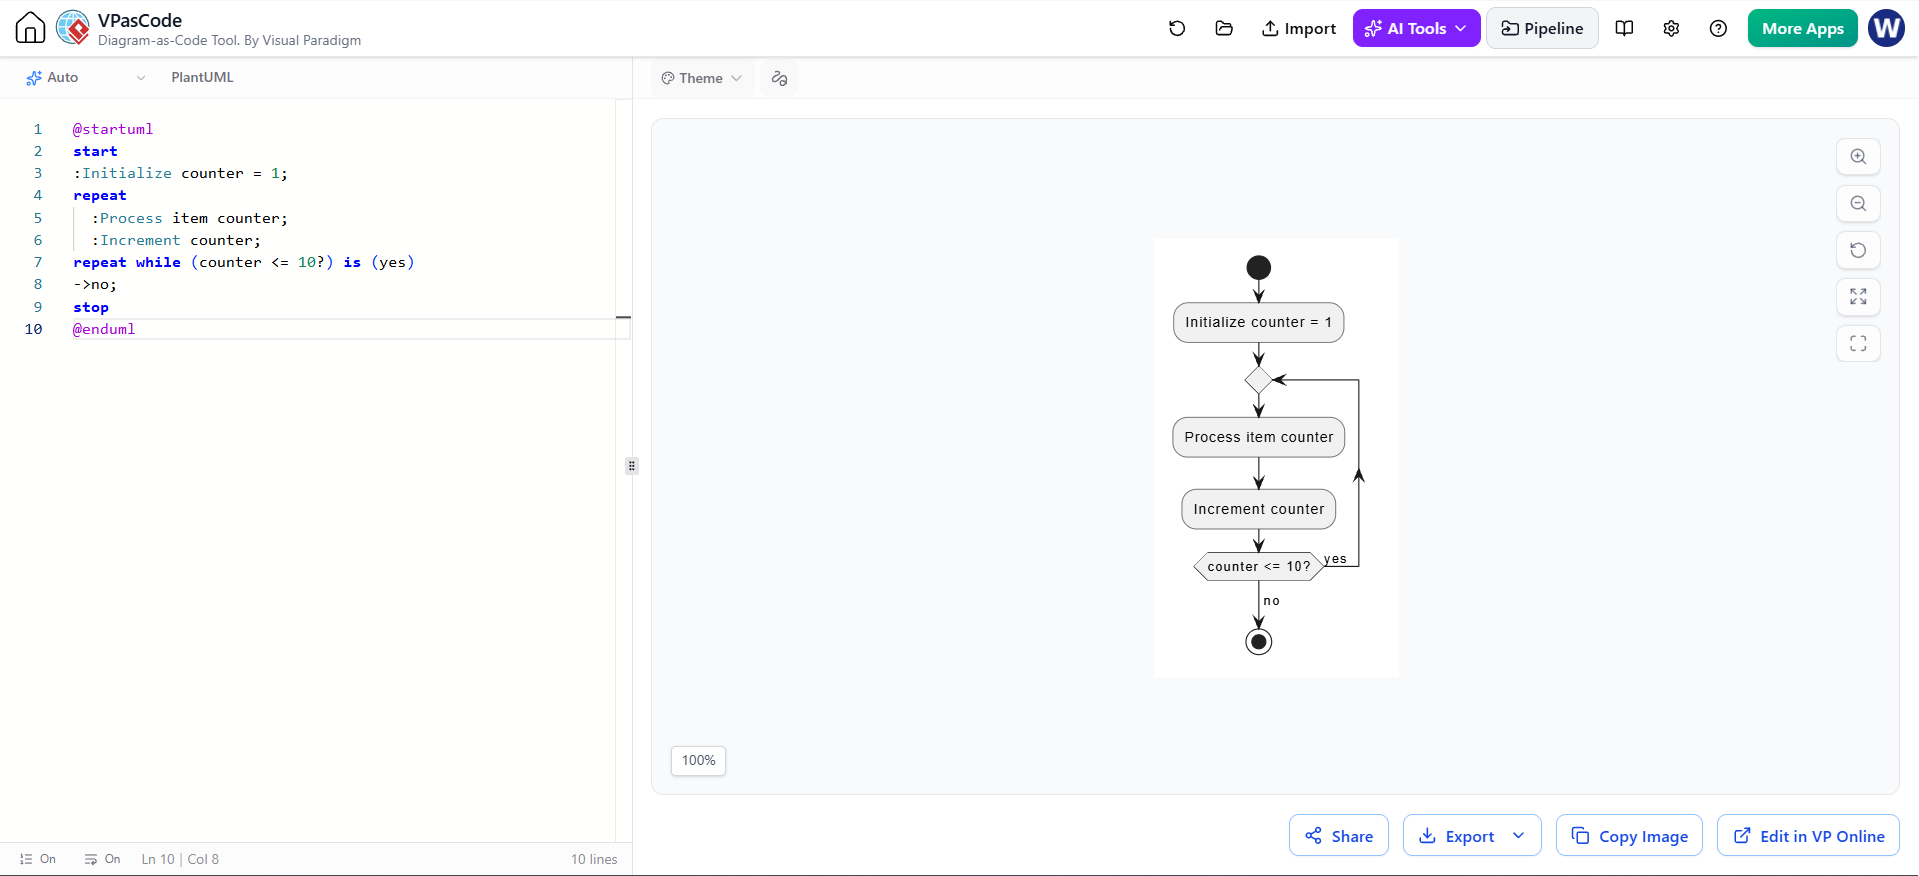
@startuml
start
:Initialize counter = 1;
repeat
  :Process item counter;
  :Increment counter;
repeat while (counter <= 10?) is (yes)
->no;
stop
@enduml
Example 4: Business Process with Connectors
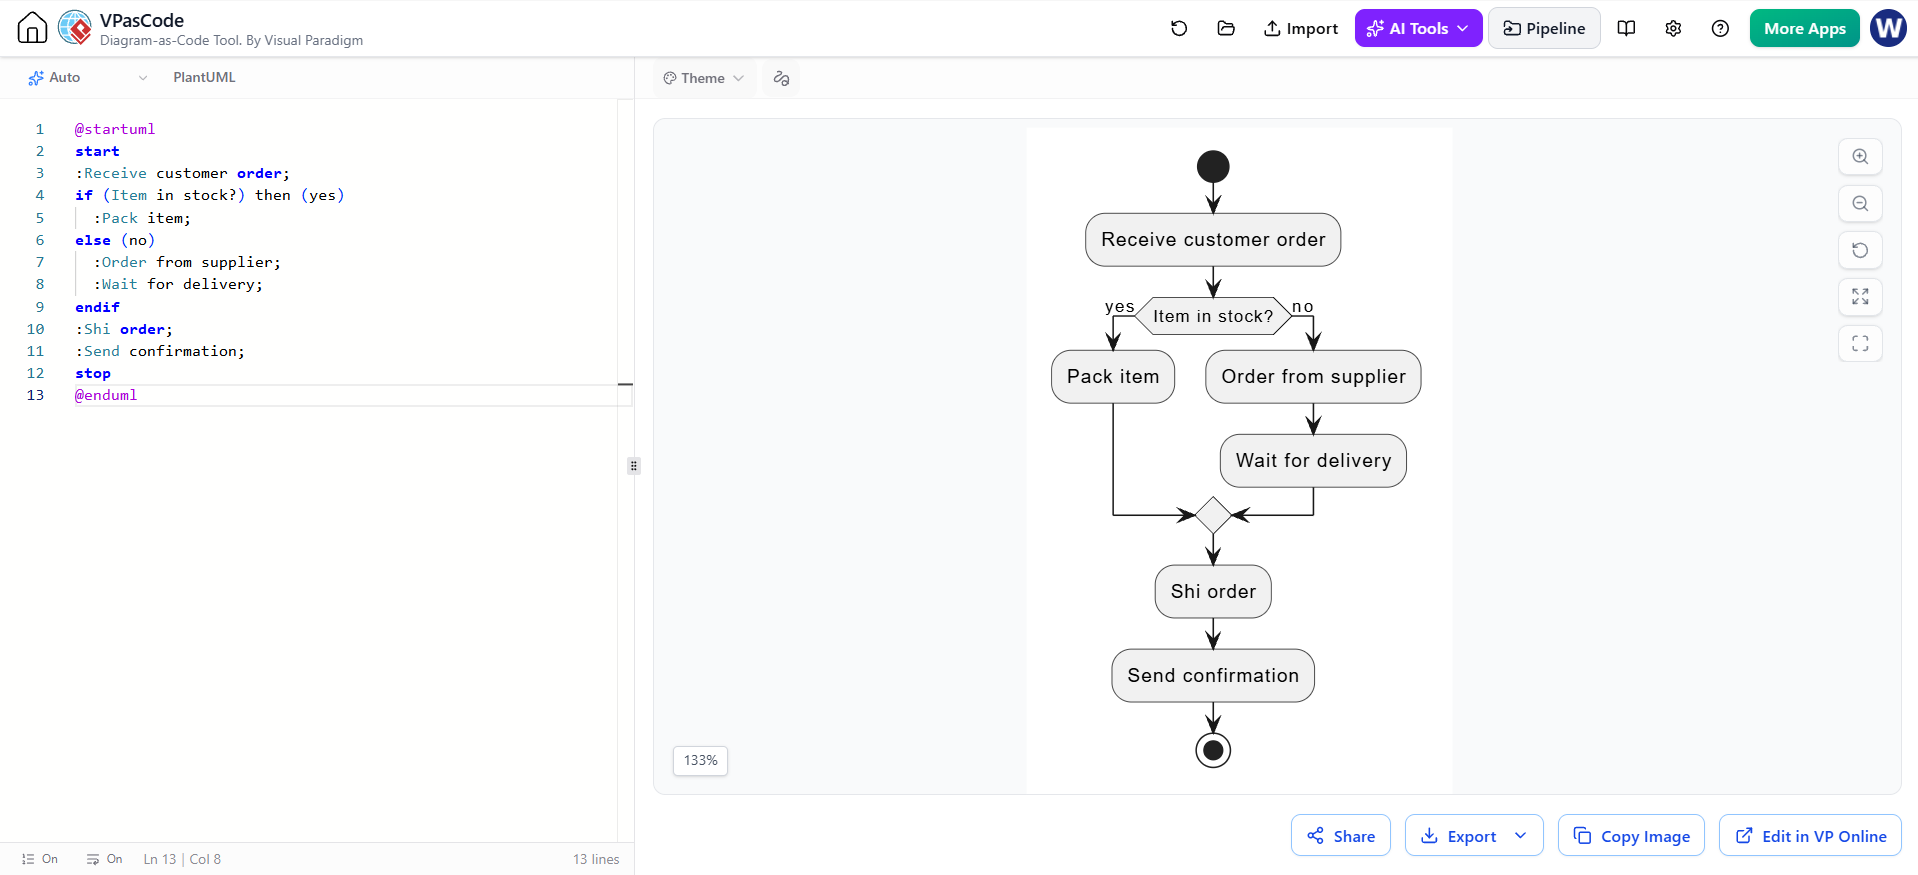
@startuml
start
:Receive customer order;
if (Item in stock?) then (yes)
  :Pack item;
else (no)
  :Order from supplier;
  :Wait for delivery;
endif
:Shi order;
:Send confirmation;
stop
@enduml
Tooling: Visual Paradigm Flowchart + VPasCode + AI
Modern flowchart creation has moved beyond manual drawing. The combination of Visual Paradigm, the VPasCode tool, and AI offers a streamlined workflow:
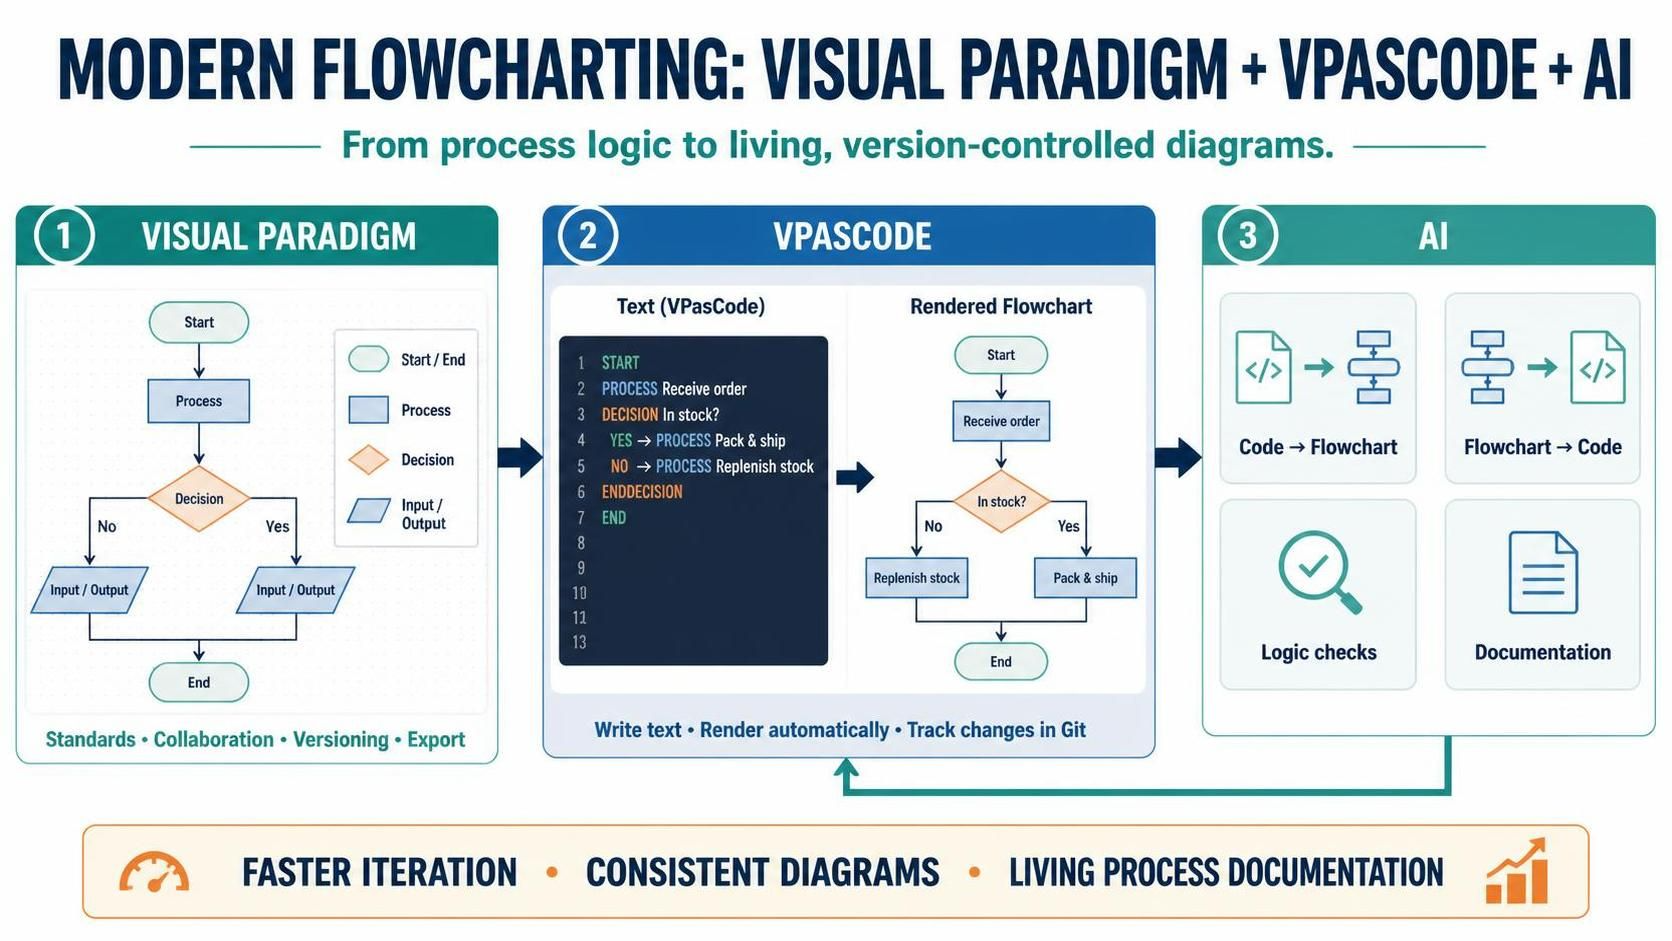
Visual Paradigm Flowchart
Visual Paradigm is a full-featured diagramming platform that supports standardized flowchart symbols out of the box. It enforces the universal conventions described above—ovals for terminals, rhombuses for decisions, parallelograms for I/O—so that diagrams remain consistent and professional. It supports collaboration, versioning, and export to multiple formats.
VPasCode Tool
VPasCode brings a code-first approach to diagramming. Instead of dragging shapes, you write concise textual descriptions (similar to the PlantUML examples above) and the tool generates the corresponding flowchart automatically. Benefits include:
-
Speed: Rapid iteration on logic without manual layout.
-
Version control: Diagrams stored as text integrate cleanly with Git.
-
Consistency: Standardized rendering removes stylistic drift across team members.
AI Integration
AI augments the workflow at several points:
-
Code-to-Flowchart: Paste a function or pseudocode, and AI generates the corresponding flowchart description, which VPasCode renders.
-
Flowchart-to-Code: Feed a flowchart back into AI to generate boilerplate code or identify logic gaps.
-
Optimization suggestions: AI can flag redundant branches, unreachable paths, or inefficiencies—directly addressing the “optimizing a process becomes easier” benefit.
-
Documentation: AI can auto-annotate flowcharts and produce accompanying documentation.
Together, these tools transform flowcharts from static drawings into living, version-controlled artifacts that evolve with the codebase—while preserving the universal standards that make flowcharts understandable to professionals worldwide.
Best Practices Summary
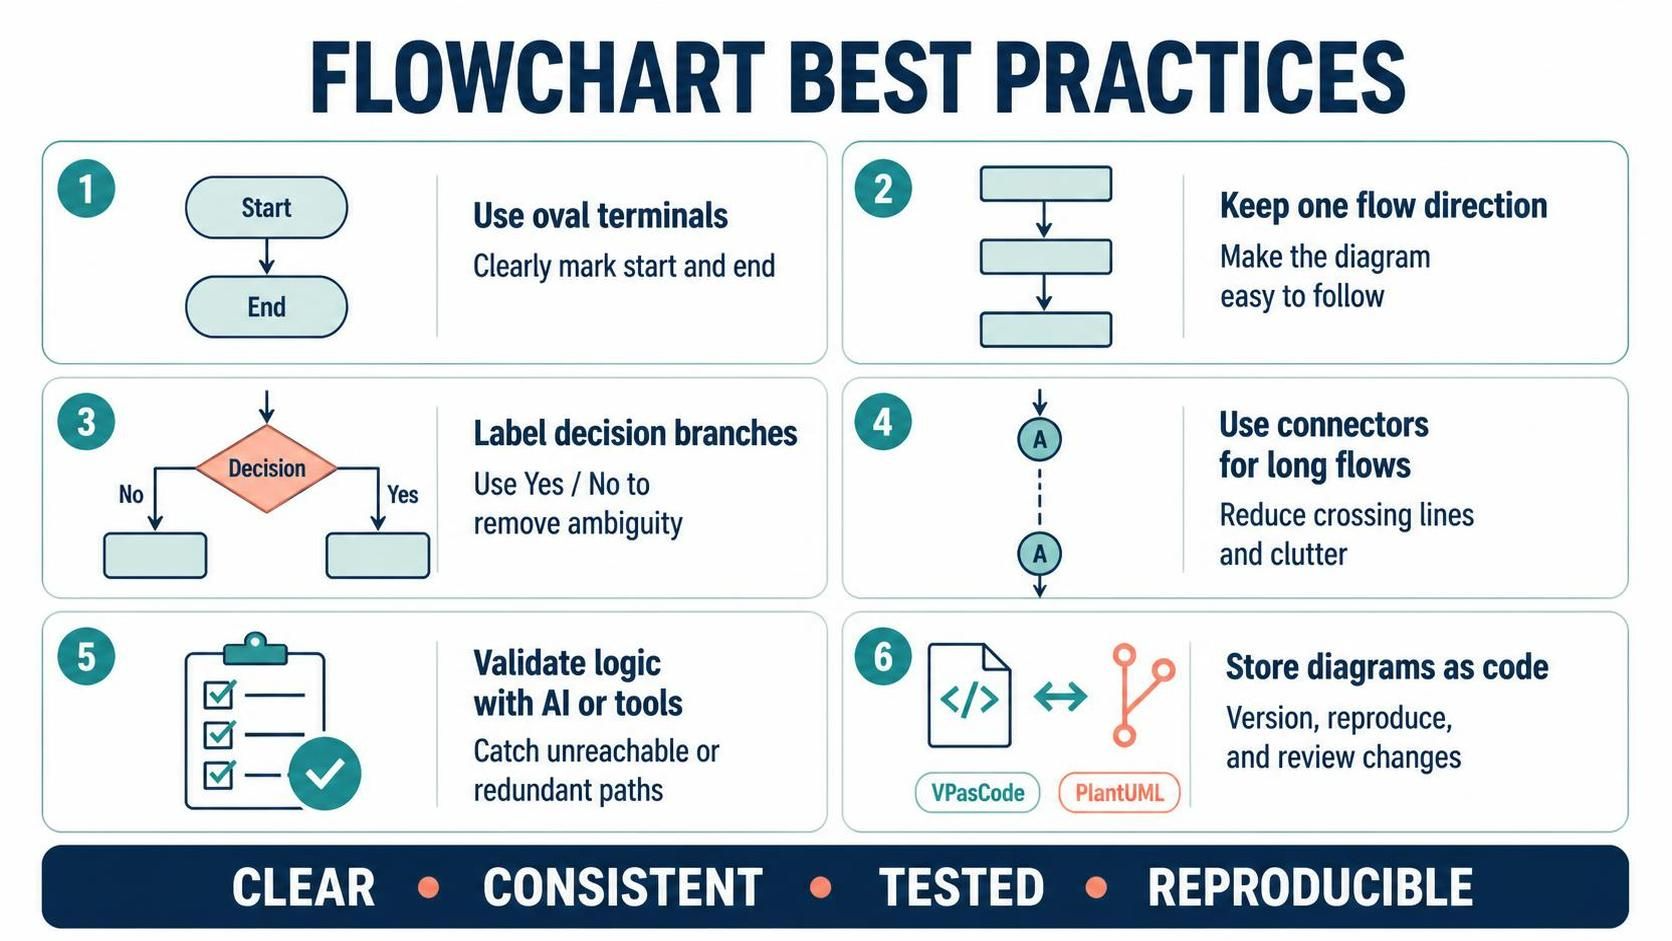
| Practice | Reason |
|---|---|
| Always use oval terminals | Clearly marks start/end |
| Keep one flow direction | Maintains readability |
| Label decision branches (“Yes”/”No”) | Removes ambiguity |
| Use connectors for long flows | Avoids clutter |
| Validate logic with AI/tools | Catches unreachable or redundant paths |
| Store diagrams as code (VPasCode/PlantUML) | Enables version control and reproduction |
Conclusion
Flowcharts remain one of the most enduring and effective tools in a programmer’s toolkit. By translating algorithms into a visual language of standardized symbols—terminals, processes, decisions, data, and connectors—they make complex logic accessible to beginners and experts alike. They streamline design, debugging, documentation, and cross-team communication, even as they carry inherent limitations for very large systems.
What has changed is how we build them. With platforms like Visual Paradigm providing standardized rendering, VPasCode enabling a code-first, version-controlled approach, and AI accelerating generation, validation, and optimization, creating effective flowcharts has never been faster or more reliable. By following the universal rules of flowcharting and embracing modern tooling, developers and business analysts can ensure their visual representations remain clear, consistent, and genuinely useful—worldwide.