
Introduction
In an era defined by complex systems, agile workflows, and rapid digital transformation, clarity is the ultimate currency. Whether you are a product manager mapping out a user journey, a developer debugging an algorithm, or an engineer designing a system architecture, the ability to visualize logic is indispensable. Enter the flowchart: a timeless yet evolving tool that transforms abstract processes into clear, actionable visual maps.
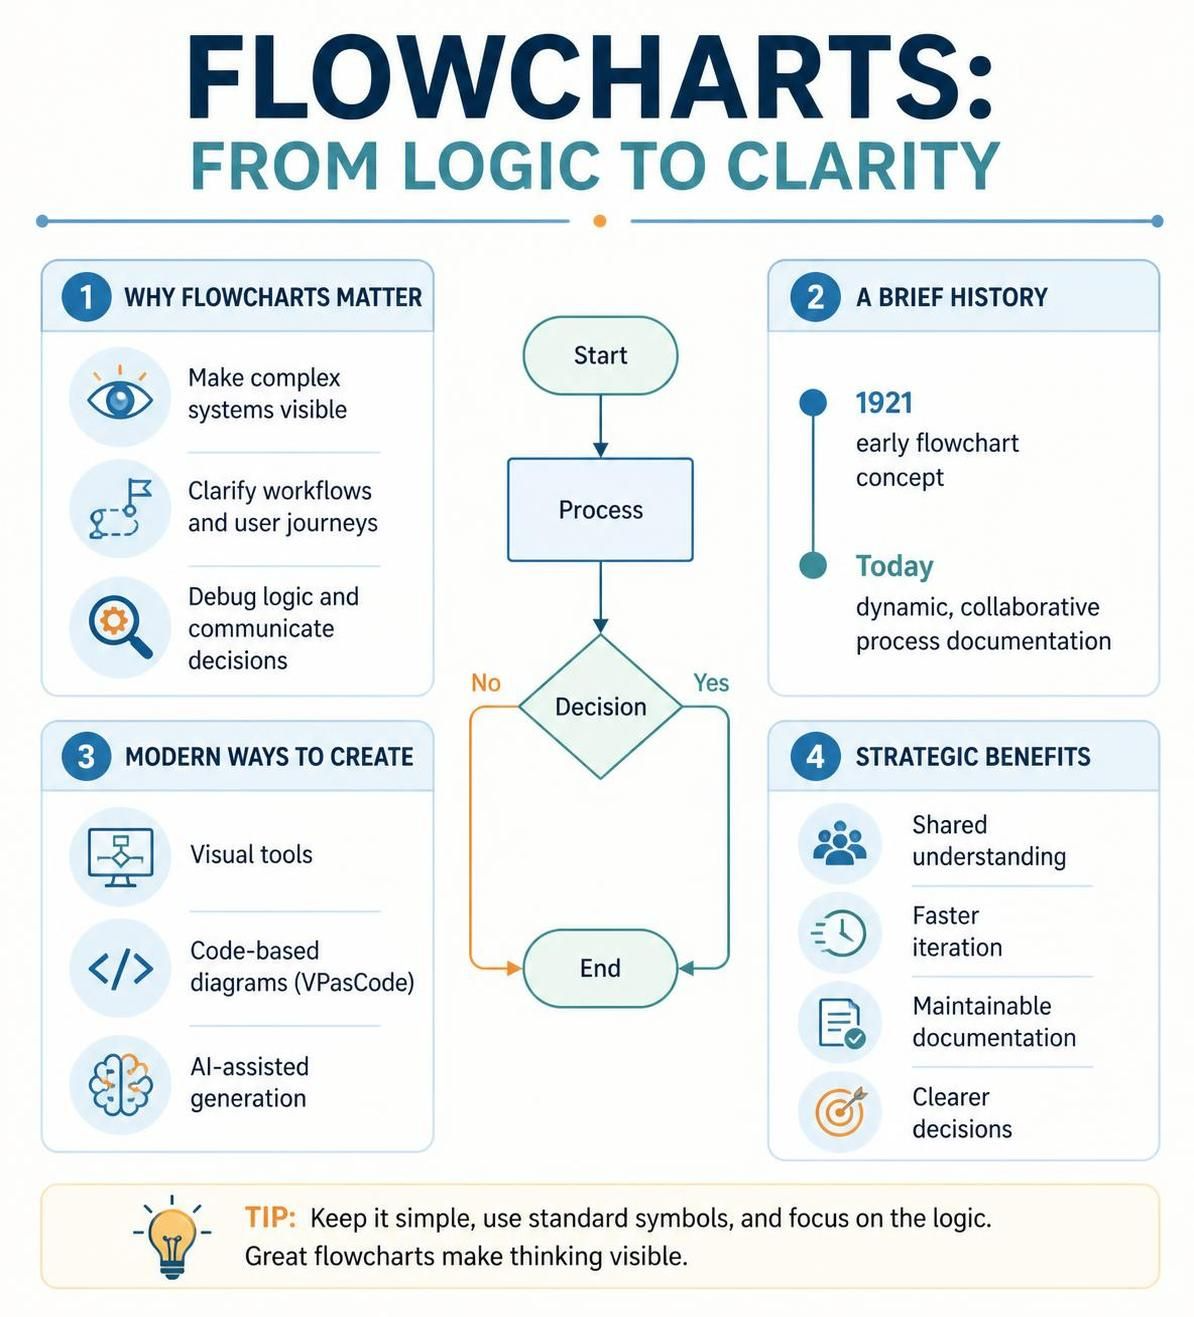
While the concept of the flowchart dates back to 1921, its application has never been more critical. Today, we are not just drawing boxes and arrows; we are leveraging AI-driven generation and code-based diagramming to create dynamic, maintainable, and collaborative process documentation. This guide explores the fundamentals of flowcharts, their strategic benefits, and how modern tools like Visual Paradigm, VPasCode, and Generative AI are revolutionizing how we design and document workflows.
Part 1: What Is a Flowchart?
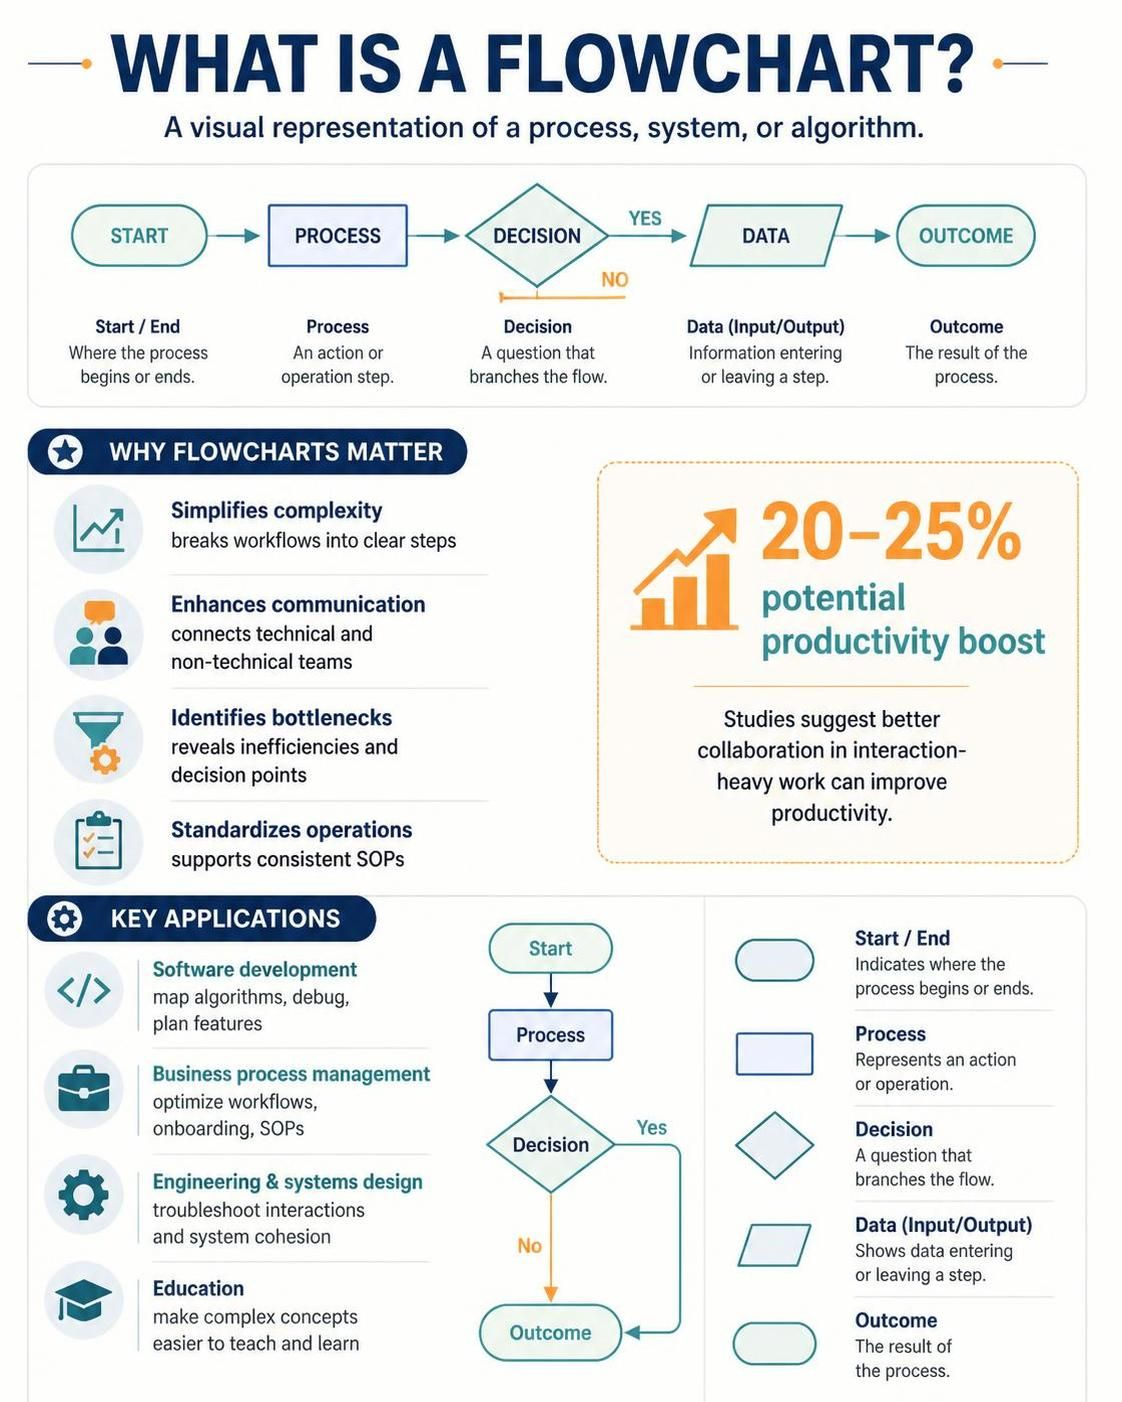
A flowchart is a visual representation of a process, system, or algorithm. It uses standardized symbols connected by arrows to depict the sequence of steps, decisions, and data flows required to achieve a specific outcome.
Why Flowcharts Matter
-
Simplifies Complexity: Breaks down intricate workflows into digestible steps.
-
Enhances Communication: Bridges the gap between technical and non-technical stakeholders. Studies suggest that better collaboration in interaction-heavy work can boost productivity by 20-25%.
-
Identifies Bottlenecks: Visualizing the entire process makes inefficiencies, redundancies, and decision points obvious.
-
Standardizes Operations: Essential for creating Standard Operating Procedures (SOPs) and ensuring consistency across teams.
Key Applications
-
Software Development: Mapping algorithm logic, debugging, and planning feature implementation.
-
Business Process Management: Optimizing workflows, onboarding new employees, and documenting SOPs.
-
Engineering & Systems Design: Troubleshooting hardware/software interactions and ensuring system cohesion.
-
Education: Breaking down complex concepts for easier learning and teaching.
Part 2: Core Concepts & Standard Symbols
To create a universally understood flowchart, it’s essential to use standardized symbols. Here are the most common elements:
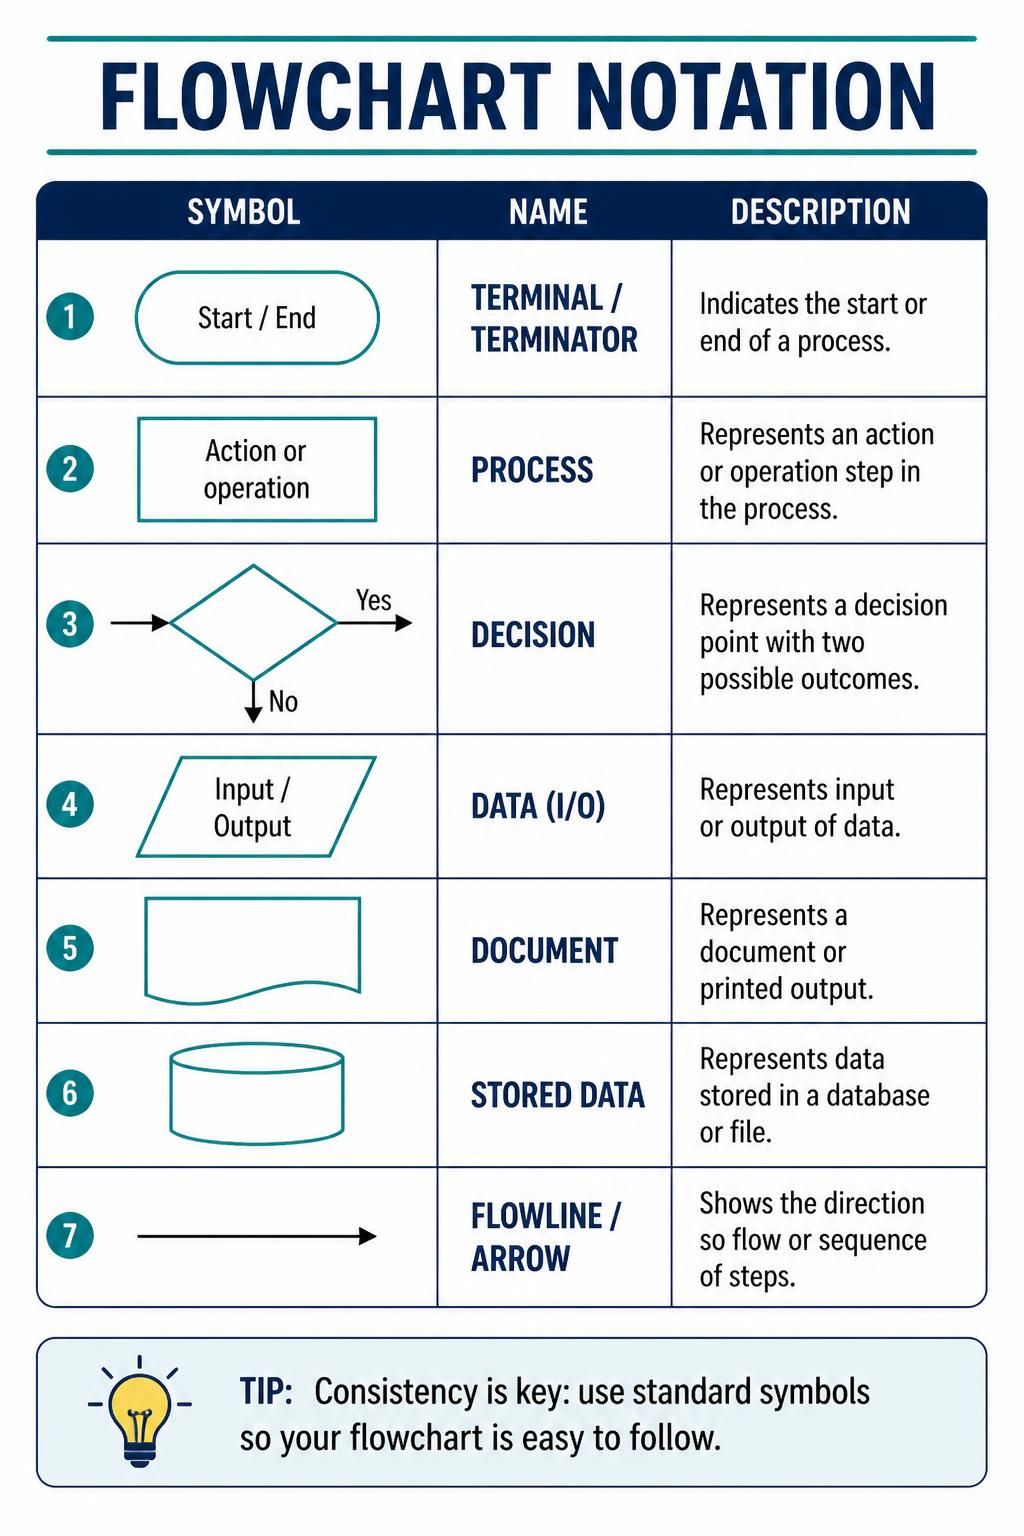
Pro Tip: Consistency is key. Stick to standard symbols to ensure your flowchart is intuitive for anyone who reads it.
Part 3: How to Create a Flowchart – A Step-by-Step Guide
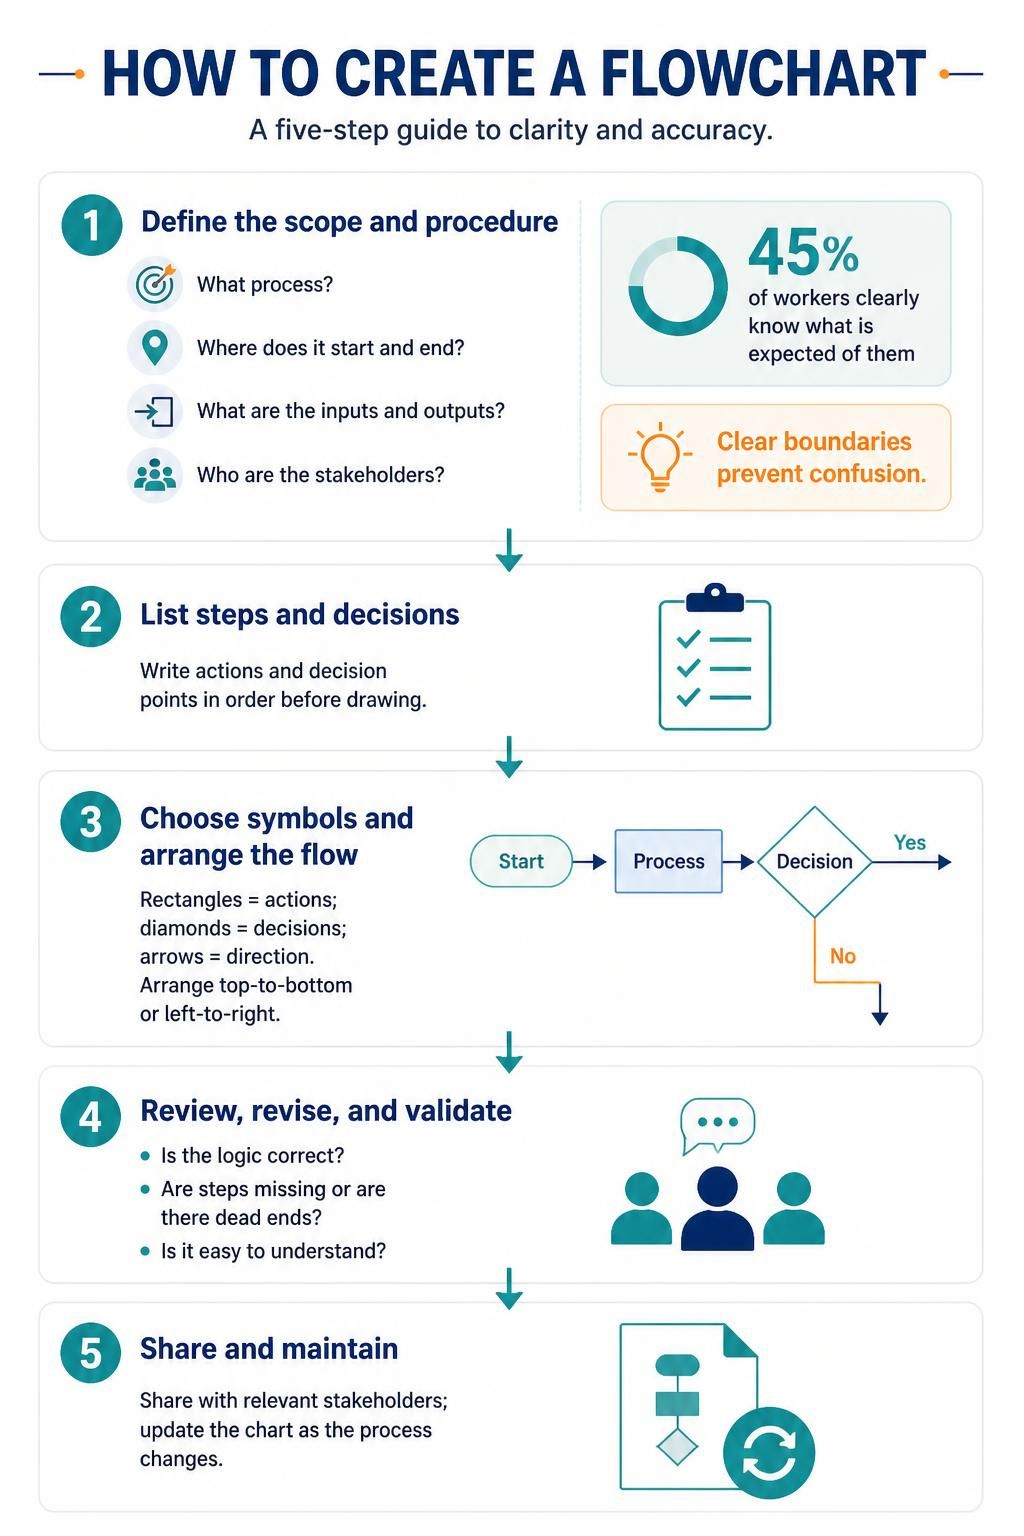
Creating an effective flowchart involves more than just drawing shapes. Follow these five steps to ensure clarity and accuracy.
Step 1: Define the Scope and Procedure
Before drawing, clearly identify:
-
What process are you mapping?
-
Where does it start and where does it end?
-
Who are the inputs and outputs?
-
Who are the stakeholders involved?
Clarity upfront prevents confusion later. Only 45% of workers clearly know what is expected of them, so defining boundaries is crucial.
Step 2: List the Steps and Decisions
Break the process down into individual actions and decision points. Write them out in a linear list first. This helps you organize the logical flow before visualizing it.
Step 3: Choose the Right Symbols and Arrange the Flow
Using your list, assign the appropriate symbol to each step.
-
Use Rectangles for actions.
-
Use Diamonds for decisions.
-
Connect them with Arrows to show direction.
-
Arrange the flow logically, typically from top to bottom or left to right.
Step 4: Review, Revise, and Validate
Share your draft with team members or process owners. Ask:
-
Is the logic correct?
-
Are there any missing steps or dead ends?
-
Is it easy to understand?
-
Use contextual comments and feedback tools to refine the chart.
Step 5: Share and Maintain
Distribute the final flowchart via a shared workspace link. Ensure it’s accessible to all relevant stakeholders. Remember, processes change—keep your flowcharts updated!
Part 4: Modern Tooling – Visual Paradigm, VPasCode, and AI
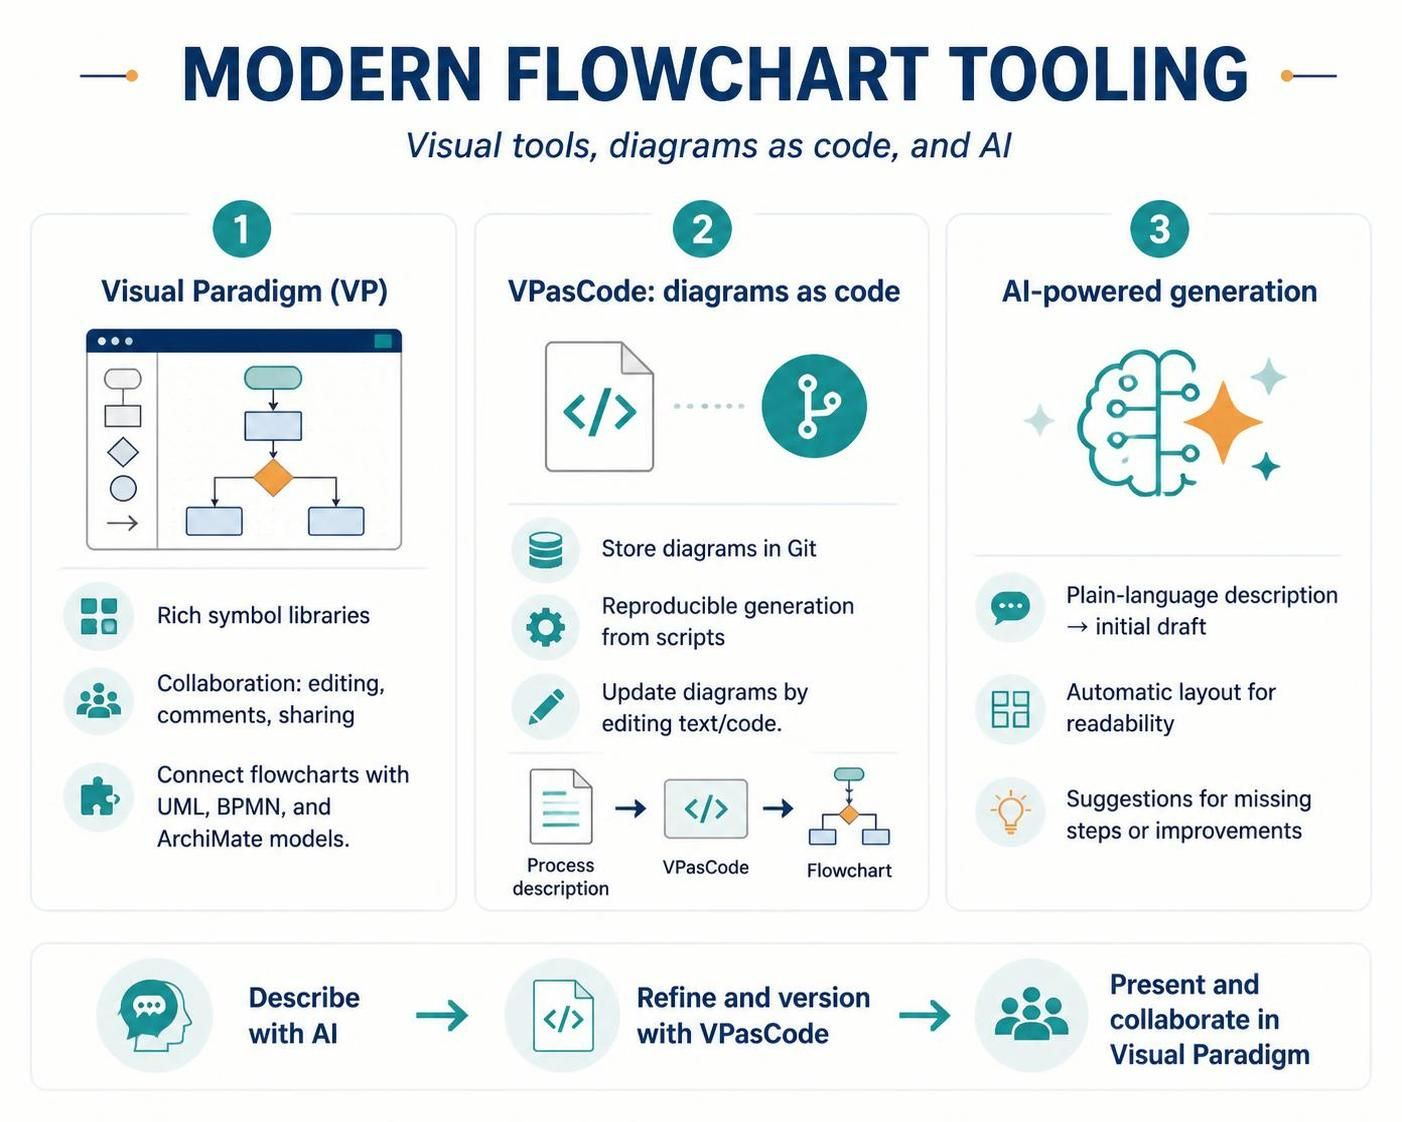
While traditional drag-and-drop tools are useful, modern engineering and product teams demand speed, version control, and automation. This is where Visual Paradigm (VP), VPasCode, and AI come into play.
1. Visual Paradigm Flowchart
Visual Paradigm is a robust modeling tool that supports not just flowcharts, but also UML, BPMN, and ArchiMate. It offers:
-
Rich Symbol Libraries: Access to industry-standard shapes.
-
Collaboration Features: Real-time editing, comments, and sharing.
-
Integration: Seamlessly connects with other VP models for comprehensive system design.
2. VPasCode: Diagrams as Code
For developers and tech-savvy PMs, VPasCode allows you to generate flowcharts using code. This approach offers significant advantages:
-
Version Control: Store your diagrams in Git alongside your codebase. Track changes, branch, and merge just like software.
-
Reproducibility: Generate consistent diagrams automatically from scripts.
-
Efficiency: Quickly update diagrams by modifying code rather than manually dragging shapes.
-
Example: Define a process in a simple text format, and VPasCode renders it into a professional flowchart.
3. AI-Powered Flowchart Generation
Generative AI is transforming diagram creation. Tools now allow you to:
-
Natural Language to Flowchart: Describe a process in plain English (e.g., “Create a flowchart for a user login process with password reset”), and AI generates the initial draft.
-
Auto-Layout: AI intelligently arranges shapes to minimize crossing lines and improve readability.
-
Smart Suggestions: AI can identify missing steps or suggest optimizations based on best practices.
Workflow Integration: Start with an AI-generated draft, refine it using VPasCode for precision and version control, and finalize it in Visual Paradigm for stakeholder presentation.
Part 5: Best Practices – What to Do and Avoid
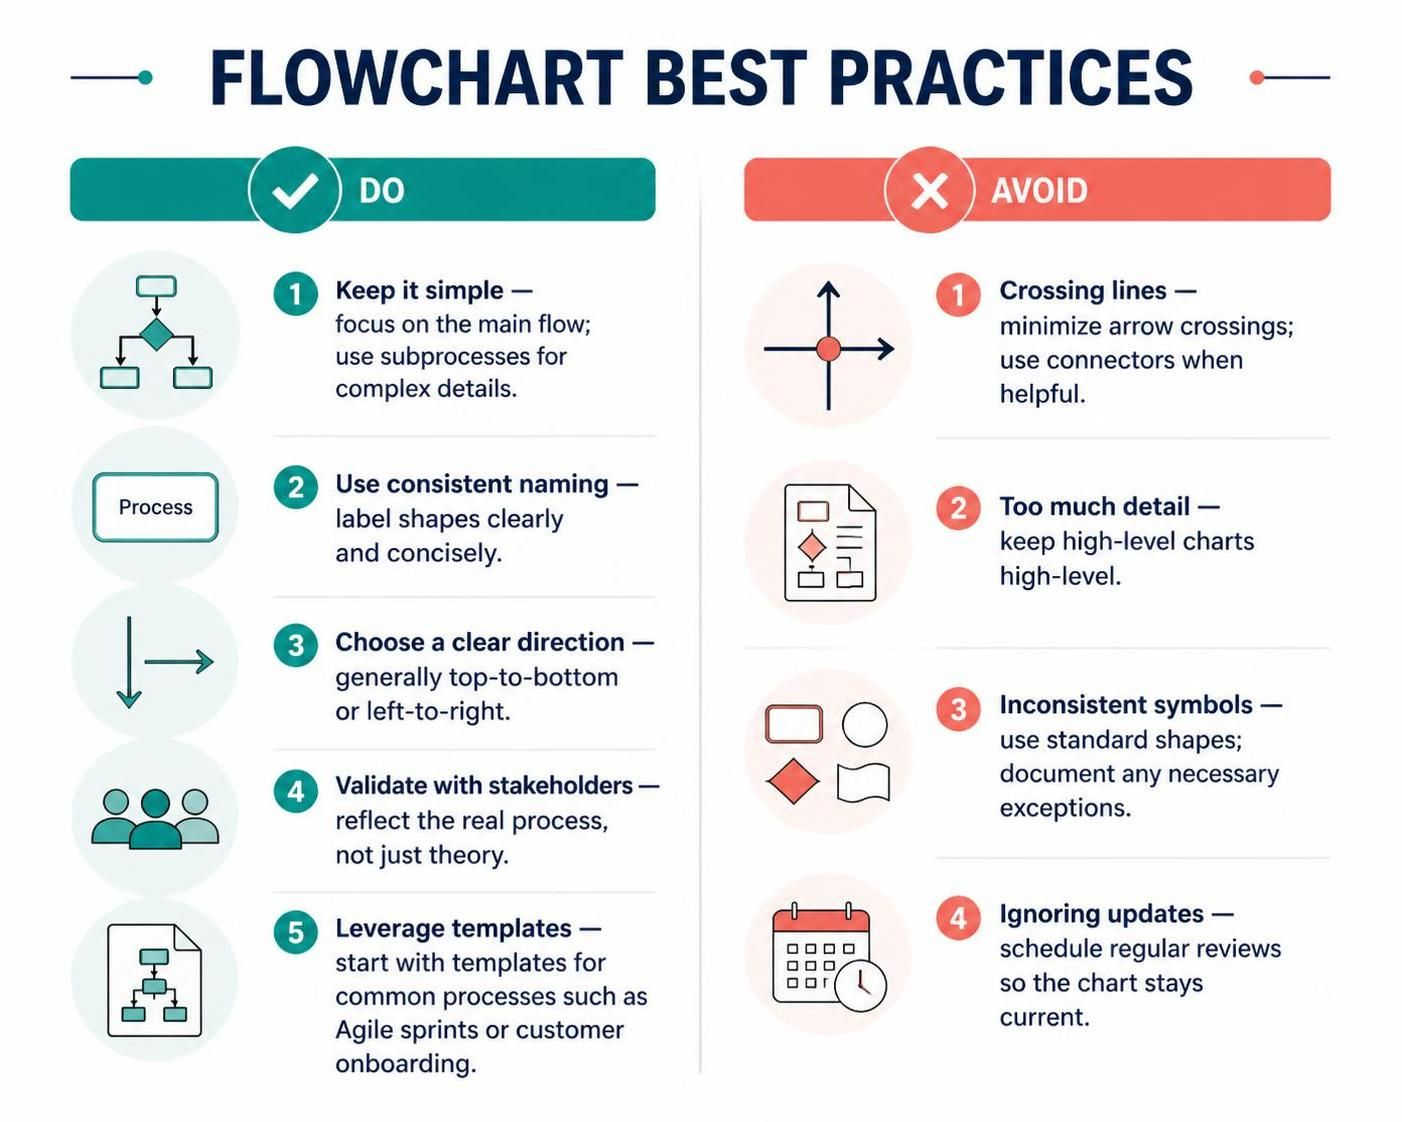
✅ Do:
-
Keep it Simple: Focus on the main flow. Use sub-processes for complex details.
-
Use Consistent Naming: Label shapes clearly and concisely.
-
Direction Matters: Flow should generally move from top-to-bottom or left-to-right.
-
Validate with Stakeholders: Ensure the chart reflects reality, not just theory.
-
Leverage Templates: Start with pre-built templates for common processes (e.g., Agile Sprint, Customer Onboarding).
❌ Avoid:
-
Crossing Lines: Minimize arrow crossings to maintain readability. Use connectors if necessary.
-
Overloading with Detail: Don’t try to include every exception. Keep high-level charts high-level.
-
Inconsistent Symbols: Stick to standard shapes. Don’t invent new symbols unless absolutely necessary and well-documented.
-
Ignoring Updates: An outdated flowchart is worse than no flowchart. Schedule regular reviews.
Examples & Templates
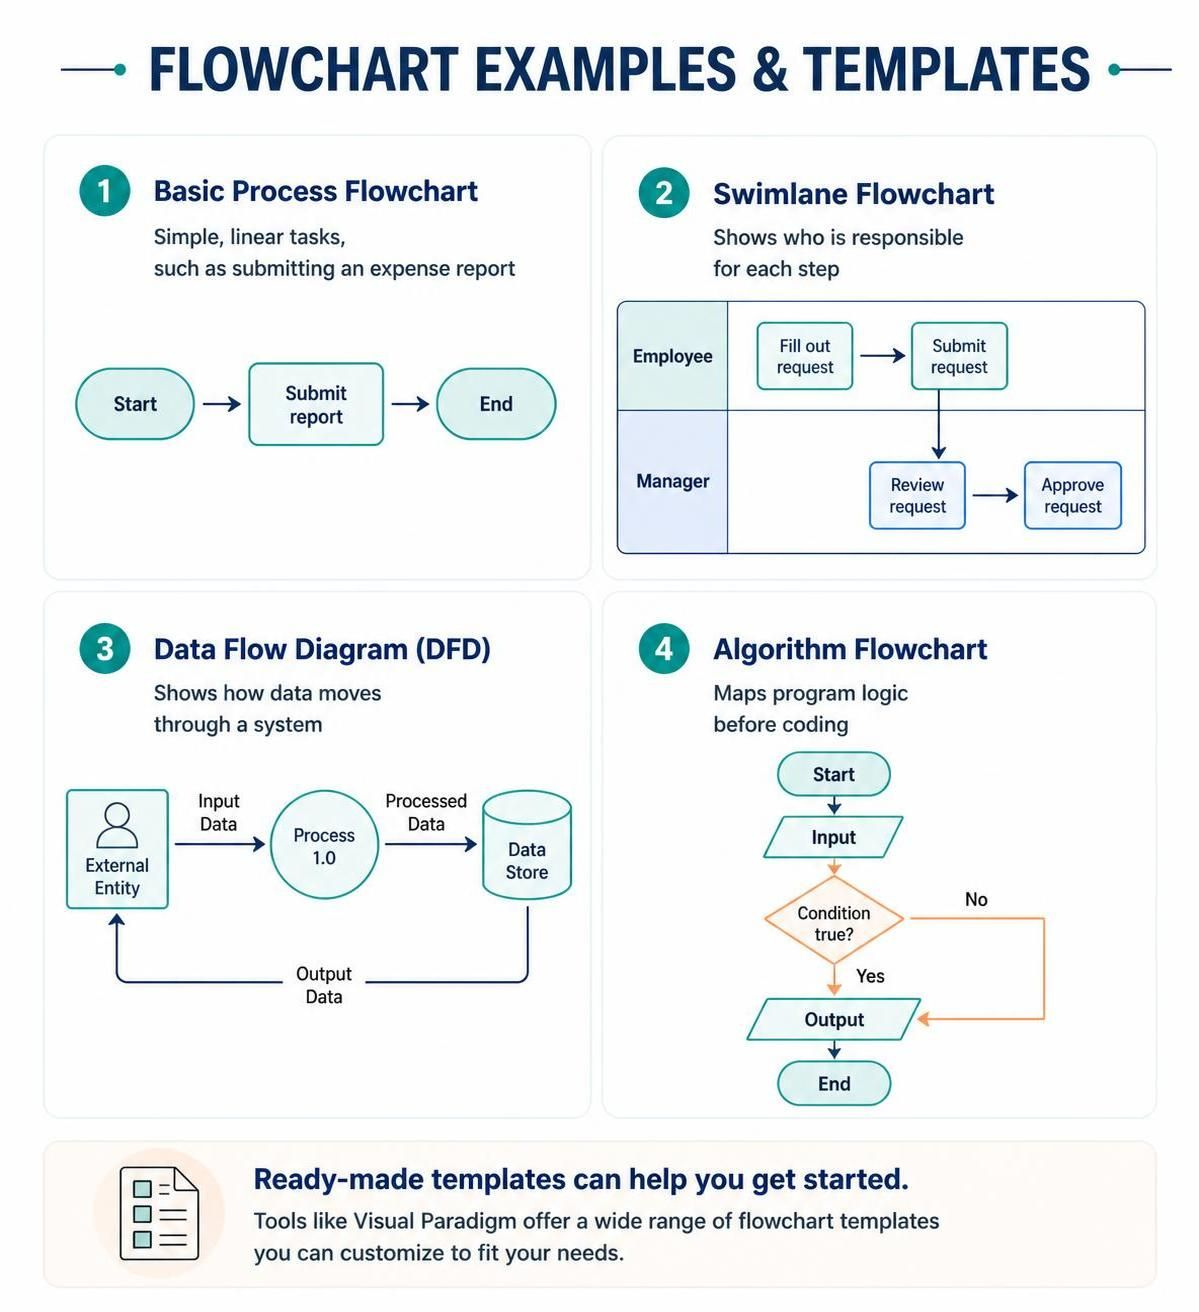
Here are a few common flowchart types you can create:
-
Basic Process Flowchart: Ideal for simple, linear tasks (e.g., “How to Submit an Expense Report”).
-
Swimlane Flowchart: Shows who is responsible for each step. Great for cross-functional teams.
-
Data Flow Diagram (DFD): Focuses on how data moves through a system.
-
Algorithm Flowchart: Used by developers to map out logic before coding.
Explore ready-made templates in Visual Paradigm to jumpstart your next diagram.
Conclusion
Flowcharts remain one of the most powerful tools for clarifying complexity, enhancing communication, and driving process improvement. From their origins in industrial engineering to their current evolution with AI and Diagrams-as-Code, flowcharts have adapted to meet the needs of modern teams.
By combining the visual clarity of Visual Paradigm, the precision and version control of VPasCode, and the speed of AI generation, you can create flowcharts that are not just static documents, but living assets that evolve with your projects. Whether you’re optimizing a business workflow, designing a software algorithm, or onboarding new team members, mastering the art of the flowchart will pay dividends in clarity, efficiency, and collaboration.
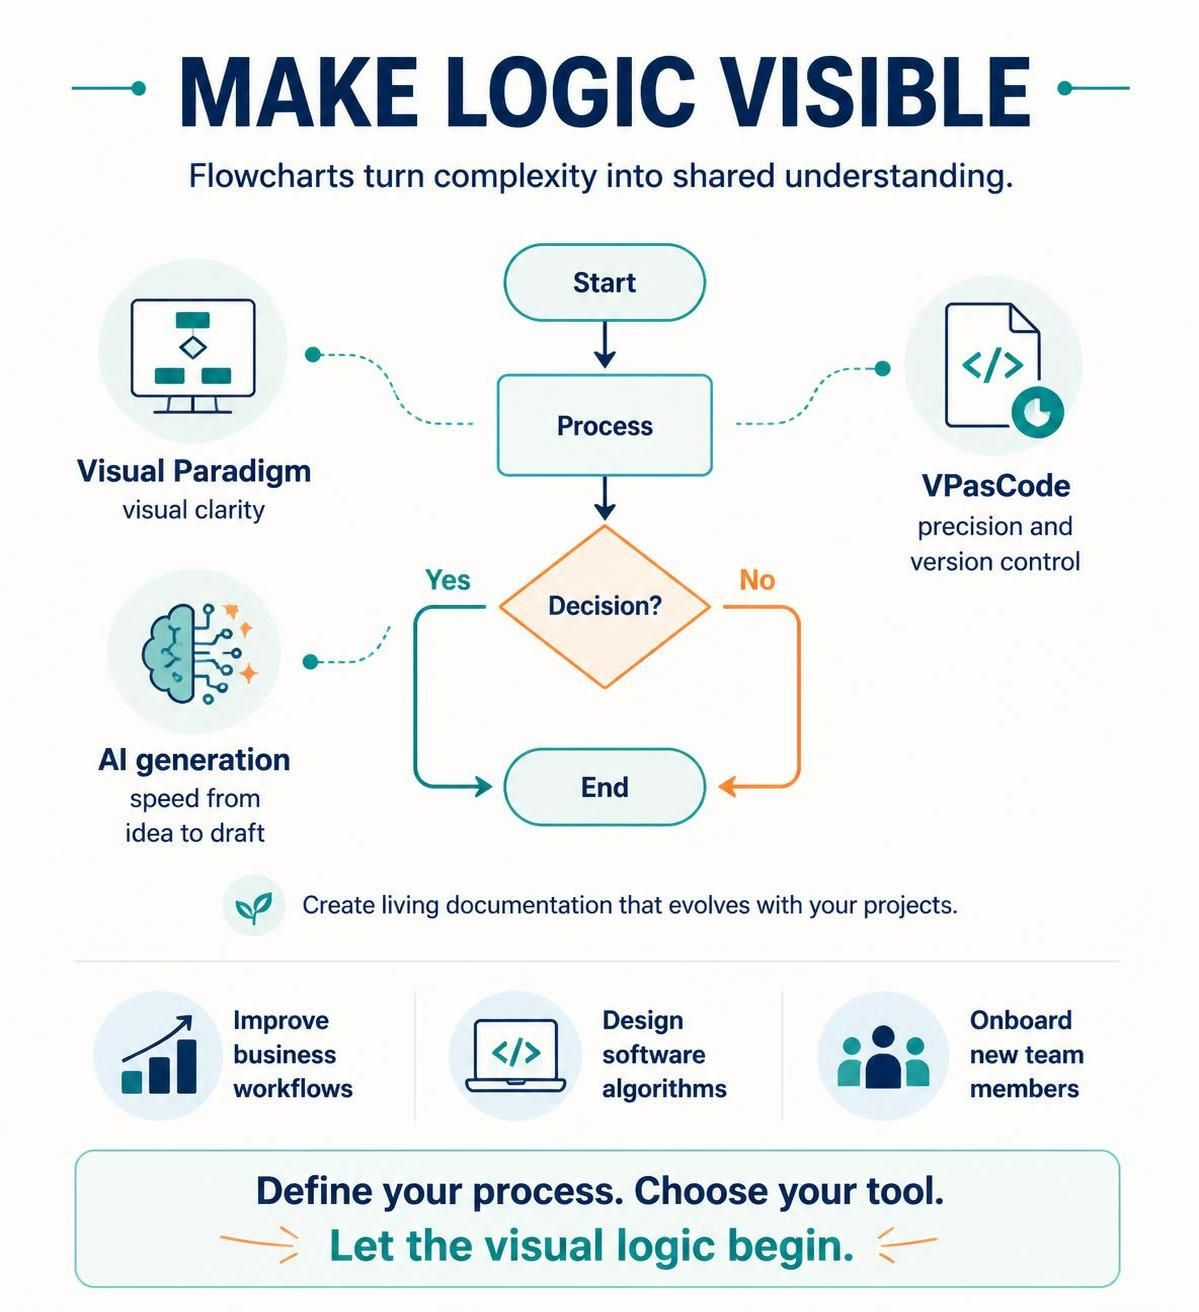
Ready to start? Define your process, choose your tool, and let the visual logic begin.
Frequently Asked Questions
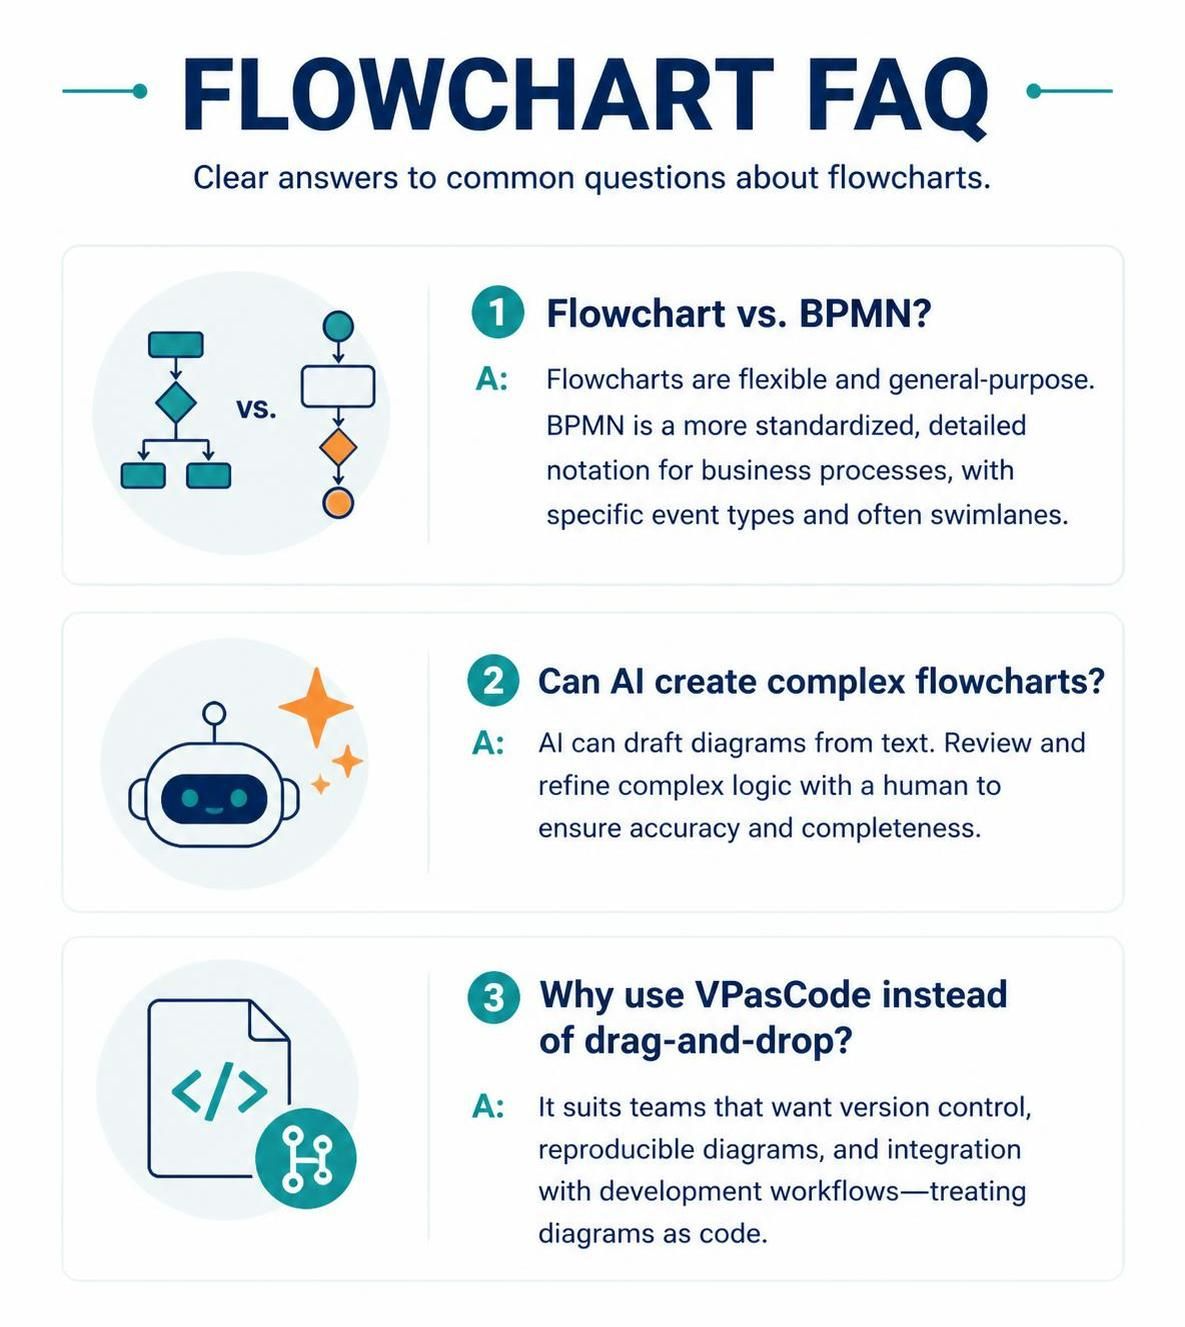
Q: What is the difference between a flowchart and a BPMN diagram?
A: While both visualize processes, BPMN (Business Process Model and Notation) is a more standardized and detailed notation specifically for business processes, often including swimlanes and specific event types. Flowcharts are more general-purpose and flexible.
Q: Can I use AI to create complex flowcharts?
A: Yes! AI can generate initial drafts from text descriptions. However, for complex logic, human review and refinement are essential to ensure accuracy and completeness.
Q: Why should I use VPasCode instead of a drag-and-drop tool?
A: VPasCode is ideal for teams that want version control, reproducibility, and integration with their development workflow. It treats diagrams as code, making them easier to maintain and collaborate on in technical environments.