Data is the backbone of modern software applications. Without it, systems cannot function, decisions cannot be made, and user experiences degrade rapidly. However, having data is not enough. The true value lies in how that data is structured, related, and understood by the people building and maintaining the system. At the heart of this structural integrity lies the Entity Relationship Diagram, commonly known as the ERD.
An ERD is often treated as a technical artifact reserved for database administrators or backend engineers. This perspective creates a dangerous silo. When the visual representation of your data exists only in the minds of a few, the rest of the team operates on assumptions. Assumptions lead to errors, rework, and friction. Achieving ERD clarity means moving beyond the drawing itself to foster a shared understanding of data across the entire organization.
Understanding the Core: What Is an ERD? 📊
An Entity Relationship Diagram is a visual representation of the logical structure of a database. It maps out entities (objects or concepts), attributes (properties of those objects), and relationships (how entities interact). While the syntax varies across different modeling methodologies, the fundamental purpose remains constant: to document the schema before code is written.
However, a diagram on a screen is not a shared understanding. To achieve clarity, teams must look past the symbols.
- Entities: These represent the nouns of your business domain. Examples include Customer, Order, Product, or Invoice.
- Attributes: These describe the details. For a Customer, this might be Name, Email, or Registration Date.
- Relationships: These define how entities connect. Does one Customer place many Orders? Does one Product appear in many Orders?
- Cardinality: This specifies the constraints. Is the relationship one-to-one, one-to-many, or many-to-many?
When every team member understands these components, the diagram becomes a communication tool rather than a technical constraint.
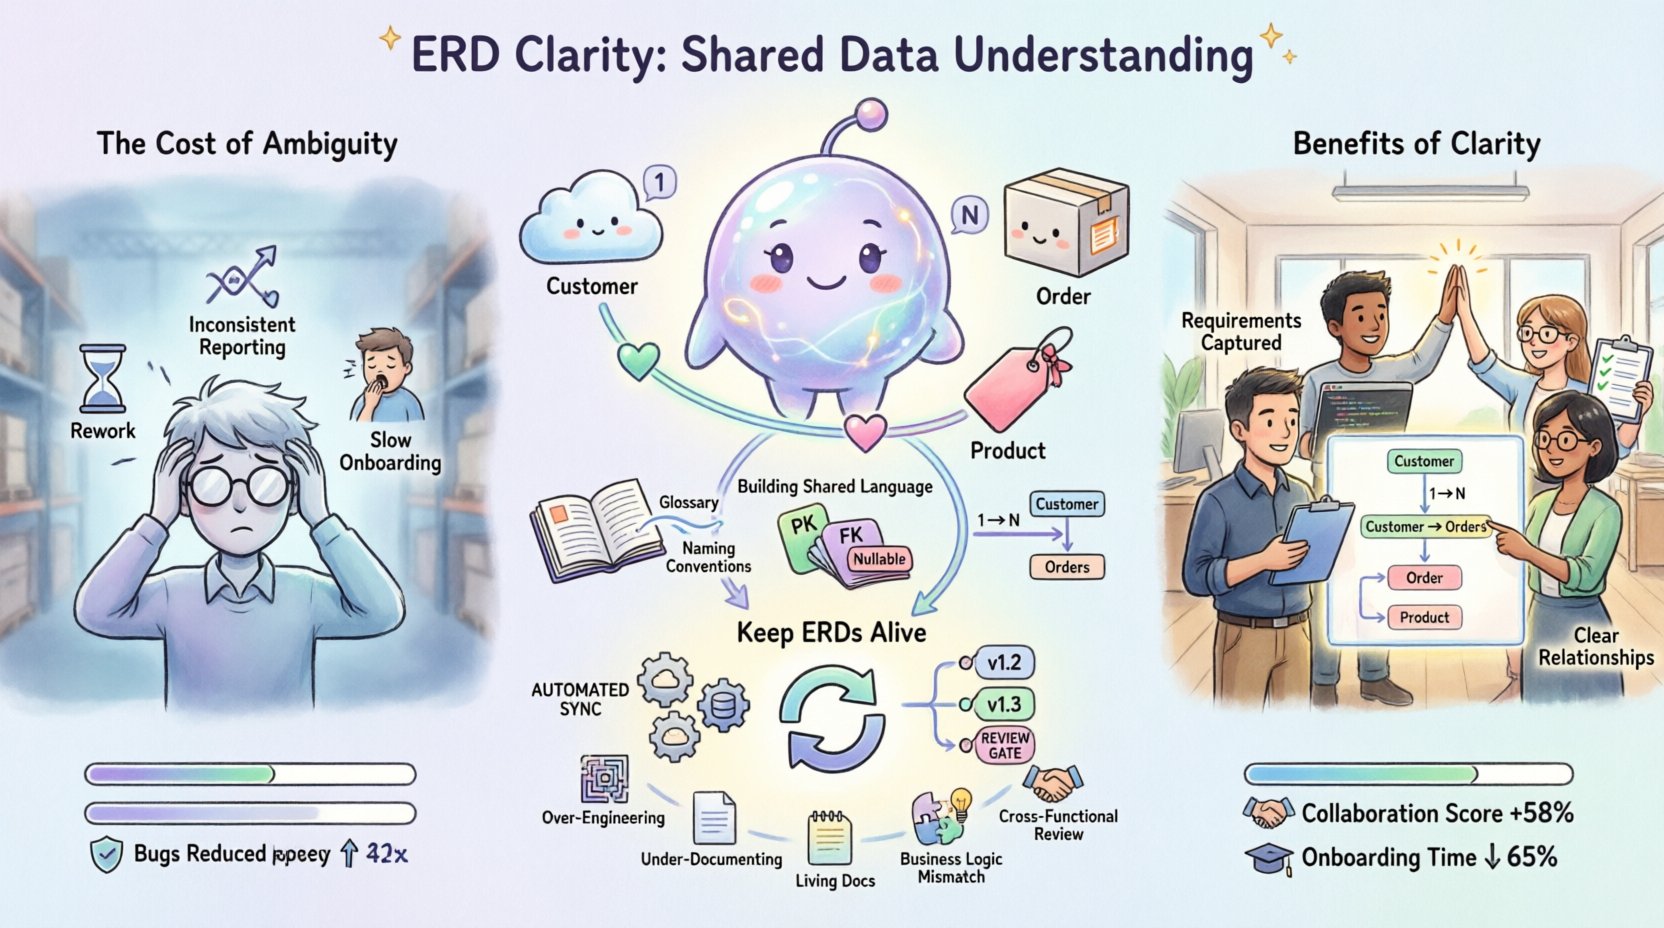
The High Cost of Data Ambiguity 💸
Ambiguity in data modeling is like a fog in a warehouse. You can see the boxes, but you do not know what is inside or how they connect. This leads to tangible business costs. When developers, product managers, and analysts do not share a common mental model of the data, the friction manifests in several ways.
1. Rework and Technical Debt
If the product team requests a feature that requires a specific data relationship, and the engineering team has modeled it differently, changes become necessary. Refactoring a database schema is significantly more expensive than designing it correctly the first time. This is not just about changing a table; it involves data migration, API updates, and potential downtime.
- Scenario: Product asks for “Customer Loyalty Points.” Engineering realizes the “User” table does not support a history log. They must add a new table and migrate data.
- Result: Delayed release and increased risk of data loss.
2. Inconsistent Reporting
Business intelligence relies on accurate data aggregation. If the marketing team defines “Active User” differently than the engineering team, dashboards will contradict each other. One says 10,000 users; the other says 12,000. Without a shared ERD definition, there is no single source of truth.
3. Slower Onboarding
New engineers spend weeks deciphering legacy schemas. If the ERD is unclear or undocumented, they cannot contribute effectively. A clear diagram reduces the cognitive load required to understand the system architecture.
Bridging the Gap: Stakeholder Alignment 🤝
Clarity requires more than just a diagram; it requires a conversation. Different roles interact with data in different ways. An ERD must serve as a translation layer between these groups.
| Stakeholder | Primary Focus | Key Questions |
|---|---|---|
| Business Analyst | Requirements & Flow | Does this data capture the business rule? |
| Developer | Implementation & Performance | Can we query this efficiently? |
| Data Analyst | Aggregation & Insight | Can we join these tables for reporting? |
| QA Engineer | Validation & Testing | What are the valid input states? |
When these groups review the ERD together, gaps in logic are exposed early. For example, a business analyst might realize that a “Product” should have a “Category” relationship, but the current model treats them as independent items. Catching this during the planning phase saves weeks of development time.
Building a Shared Language 🗣️
Tech terms often confuse non-technical stakeholders. Words like “foreign key,” “normalization,” or “indexing” can create barriers. To build clarity, teams must agree on a glossary.
- Define Entities Clearly: Ensure everyone agrees on what constitutes a “User.” Is it a person, an account, or a session?
- Standardize Naming Conventions: Avoid snake_case in some files and camelCase in others. Consistency reduces cognitive friction.
- Document Relationships: Don’t just draw the line. Label it. “One Order contains Many Items” is better than a simple line between Order and Item.
This shared language extends beyond the diagram. It includes the documentation that accompanies the data model. Comments within the schema, README files for the database, and design documents should all reinforce the same definitions.
The Living Document: Evolution of the Schema 🔄
One of the most common mistakes is treating the ERD as a static artifact. Once the database is created, the diagram is often forgotten. However, software requirements change. Features are added. Regulations shift.
Why ERDs Become Stale
- Lack of Maintenance: No one is assigned the task of updating the diagram after a schema change.
- Manual Updates: If the diagram is not generated from the code or vice versa, it drifts over time.
- Access Barriers: If the diagram is stored in a proprietary tool that only a few can access, it is not a shared resource.
Strategies for Maintenance
To keep the ERD accurate, it must be integrated into the development workflow.
- Version Control: Store the diagram definition in the same repository as the application code. This ensures changes are tracked.
- Automated Sync: Where possible, use tools that reverse-engineer the database schema to update the diagram automatically.
- Review Gates: Include schema updates in the code review process. If a pull request changes a table, the diagram must be updated in the same commit.
Common Pitfalls in Data Modeling 🚫
Even with good intentions, teams often stumble into patterns that obscure clarity. Recognizing these pitfalls helps in avoiding them.
1. Over-Engineering
Designing for a hypothetical future scale can complicate the current state. Introducing complex partitioning or sharding strategies before they are needed adds unnecessary complexity to the ERD.
- Fix: Design for the current requirements. Scale when the data volume demands it.
2. Under-Documenting
Assuming that the code speaks for itself is risky. Code changes frequently. Documentation should capture the intent, not just the implementation.
- Fix: Add comments explaining why a relationship exists, not just what the relationship is.
3. Ignoring Business Logic
A database table might be technically valid but logically wrong. For example, storing a “Full Name” in one field versus “First Name” and “Last Name” in separate fields has implications for sorting, searching, and internationalization.
- Fix: Validate data structures against actual business usage scenarios.
Governance and Ownership 👮
Who is responsible for the ERD? Without an owner, accountability disappears. In many organizations, the Database Administrator (DBA) owns the schema. In modern cloud-native environments, this responsibility often shifts to the Lead Backend Engineer or a dedicated Data Architect.
Regardless of the title, the role requires specific duties:
- Approving Changes: No table should be added or removed without review.
- Ensuring Consistency: Checking that naming conventions are followed across all modules.
- Facilitating Communication: Acting as the bridge between technical constraints and business needs.
Establishing a governance process does not mean creating bureaucracy. It means creating a checkpoint that ensures quality and alignment.
Measuring the Impact of Clarity 📈
How do you know if your team has achieved better ERD clarity? Look for these indicators over time.
- Reduced Bug Rates: Fewer data integrity errors in production indicate a better initial design.
- Faster Feature Delivery: Less time spent debating schema changes means more time building features.
- Improved Collaboration: Non-technical stakeholders can read the diagram and ask informed questions.
- Lower Onboarding Time: New hires understand the system faster.
Conclusion: Data as a Team Asset 🏆
An Entity Relationship Diagram is more than a technical diagram. It is a contract between the business and the technology. It defines the boundaries of what the system can do and how data flows through it. When this contract is clear, teams move faster. When it is ambiguous, progress stalls.
Investing in ERD clarity is an investment in the longevity of the software. It reduces the cost of change, minimizes risk, and ensures that everyone from the product manager to the junior developer speaks the same language. By prioritizing shared understanding, teams build systems that are robust, scalable, and aligned with business goals.
Start today. Review your current data models. Invite your team to the table. Ask them if they truly understand the diagram. If the answer is no, then the work is not done. Clarity is the foundation of quality.