In the landscape of software architecture and system design, clarity is paramount. Two of the most fundamental visualization tools available to architects and developers are the Entity-Relationship Diagram (ERD) and the Class Diagram. While both serve the purpose of modeling structure, they operate in different domains and address distinct concerns. Selecting the correct tool depends heavily on the nature of your application, the persistence layer requirements, and the programming paradigm in use.
This guide provides a detailed examination of these two modeling techniques. We will explore their components, their specific use cases, and the strategic implications of choosing one over the other. Understanding the nuance between database-centric modeling and object-oriented design is essential for building systems that are both maintainable and performant.
Understanding the Entity-Relationship Diagram 🗄️
The Entity-Relationship Diagram is a conceptual tool designed to represent the structure of data within a database system. It focuses on the storage, integrity, and flow of information. An ERD is typically used during the data modeling phase of the software development lifecycle. Its primary goal is to define how data is organized and how different data sets relate to one another before any code is written.
- Core Focus: Data persistence and relational integrity.
- Primary Audience: Database administrators, backend developers, and data architects.
- Key Components:
- Entities: Represented as tables, these are the objects of interest, such as Customer, Order, or Product.
- Attributes: The specific properties of an entity, like customer_name or order_date. These map to columns in a database table.
- Relationships: The associations between entities, such as a one-to-many or many-to-many connection. Cardinality is a critical concept here.
- Keys: Primary keys and foreign keys that enforce data uniqueness and link tables together.
The ERD is grounded in set theory and relational algebra. It ensures that data is normalized to reduce redundancy. For example, if you have a list of orders, an ERD helps determine if customer details should be repeated in every order record or stored separately in a Customer table to maintain a single source of truth.
Understanding the Class Diagram 🧩
The Class Diagram is a standard component of the Unified Modeling Language (UML). It represents the static structure of a system in object-oriented programming. Unlike the ERD, which looks at data as stored, the Class Diagram looks at data as it behaves within the application logic. It bridges the gap between the database and the code.
- Core Focus: Software behavior, logic, and object interactions.
- Primary Audience: Software engineers, frontend developers, and system designers.
- Key Components:
- Classes: The blueprint for objects. A class defines the state (attributes) and behavior (methods) of an entity.
- Methods: Functions or operations that the object can perform, such as calculateTotal() or validateUser().
- Inheritance: The ability for a class to derive properties and methods from another class, promoting code reuse.
- Interfaces: Contracts that define what a class must do without specifying how it does it.
- Visibility: Access modifiers like public, private, or protected that control how classes interact.
In a Class Diagram, relationships go beyond simple data links. They include associations, aggregations, and compositions. Composition implies a stronger relationship where the lifecycle of one object depends on another. For instance, a Car class might be composed of Engine and Wheel classes; if the Car is destroyed, the Engine and Wheels cease to exist in that context.
Key Differences at a Glance ⚖️
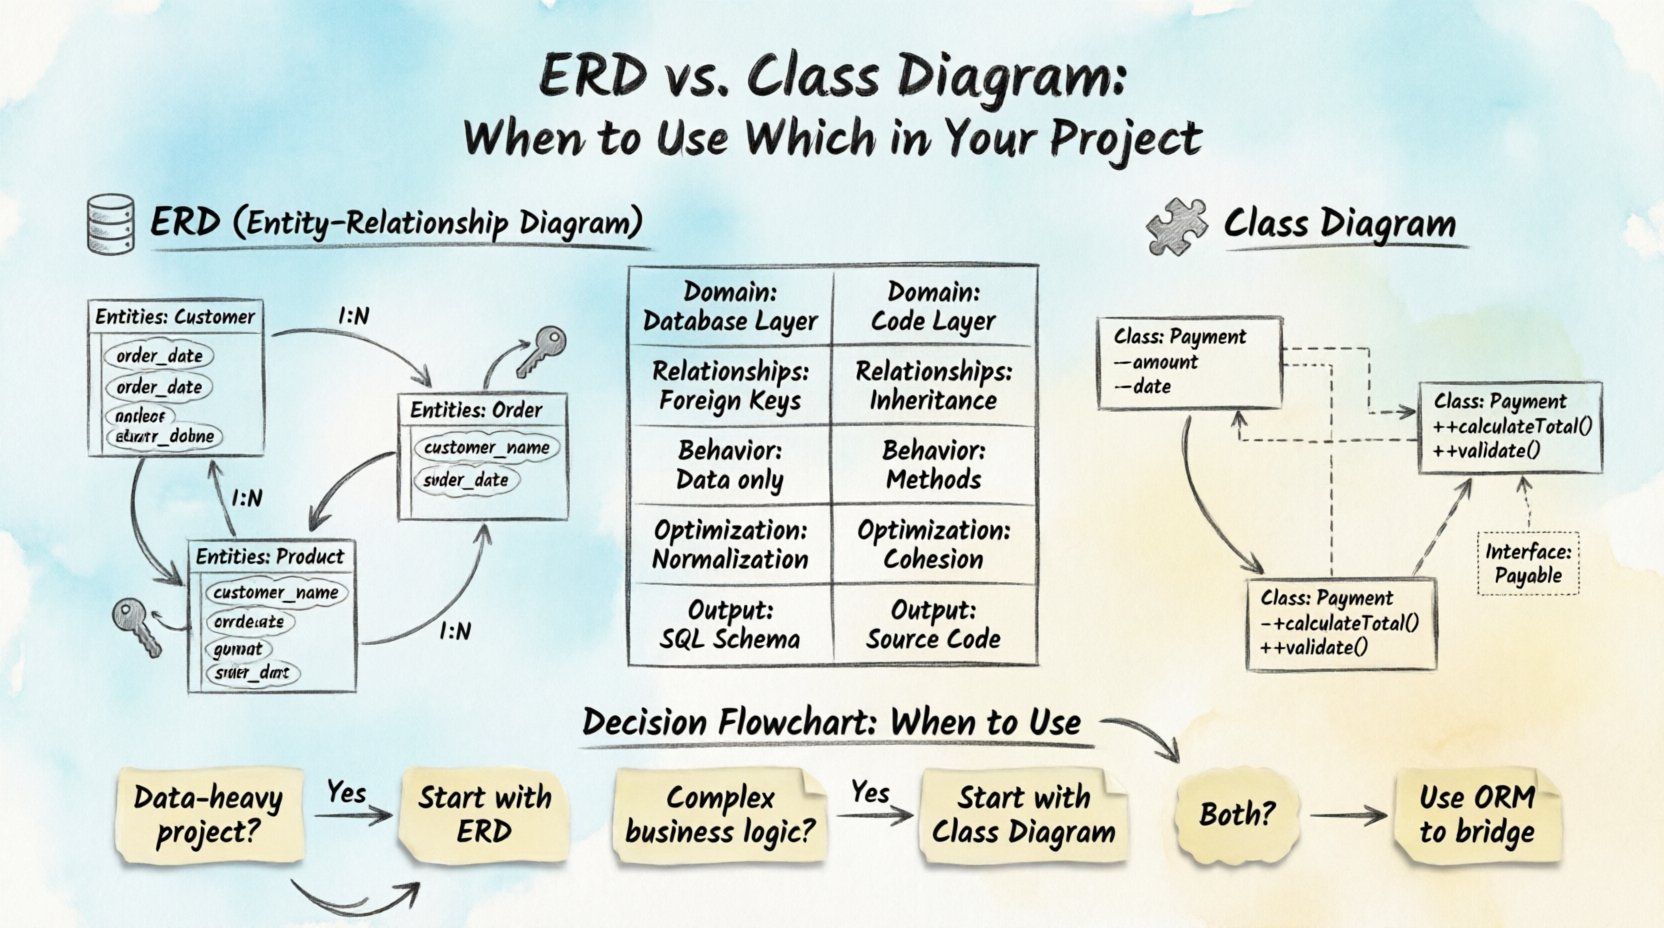
While both diagrams model structure, their underlying philosophies differ. The ERD is declarative, describing what the data is. The Class Diagram is imperative, describing what the objects can do. The following table outlines the technical distinctions.
| Feature | Entity-Relationship Diagram (ERD) | Class Diagram |
|---|---|---|
| Domain | Database Layer | Application / Code Layer |
| Relationships | Foreign Keys, Cardinality (1:1, 1:N) | Association, Inheritance, Aggregation |
| Behavior | None (Data only) | Methods, Functions, Logic |
| Optimization | Normalization, Indexing | Coupling, Cohesion, Polymorphism |
| Output | SQL Schema | Source Code |
When to Prioritize the ERD 💾
There are specific scenarios where the ERD is the primary modeling tool. In these cases, the integrity and performance of the data are more critical than the immediate behavior of the application logic.
1. Data-Intensive Applications
If your project involves heavy data processing, such as analytics platforms, reporting tools, or content management systems, the data structure dictates the system’s success. An ERD allows you to visualize complex joins and dependencies before writing a single line of backend code. It helps identify bottlenecks in query performance.
- Normalization: Use the ERD to ensure data is not duplicated unnecessarily. This reduces storage costs and prevents update anomalies.
- Constraints: Define strict rules for data entry. For example, ensuring a Transaction cannot exist without a linked Account.
- Schema Migration: When planning database migrations, the ERD serves as the source of truth for how tables must evolve over time.
2. Multi-System Integration
When multiple applications need to share the same database, an ERD acts as the contract. It ensures that all systems agree on the meaning of a field or a relationship. Without a standardized ERD, different teams might interpret user_id differently, leading to data corruption.
3. Legacy System Modernization
When reverse-engineering an existing database, an ERD is often the starting point. It helps new developers understand the historical context of the data structure. You can then map this structure to new application logic, ensuring no data is lost during the transition.
When to Prioritize the Class Diagram 🏗️
The Class Diagram becomes the priority when the complexity of the application logic outweighs the complexity of the data storage. This is common in business applications where the rules of the domain are intricate.
1. Complex Business Logic
If your project requires intricate workflows, state management, or complex calculations, the Class Diagram captures this behavior. An ERD cannot show that a Discount class requires a Cart class to be in a specific state before applying a reduction.
- Encapsulation: You can visualize which data is hidden from external modules. This is crucial for maintaining security and reducing bugs.
- Polymorphism: Show how different types of objects can be treated uniformly. For example, a Payment interface could be implemented by CreditCard, PayPal, or Crypto classes.
2. Object-Oriented Architecture
In systems built on languages like Java, C#, or Python, the Class Diagram mirrors the actual code structure. It helps developers plan the inheritance hierarchy. This reduces the need for refactoring later in the development cycle.
3. Frontend Integration
When designing a user interface, the data often needs to be transformed into objects that the UI can consume. A Class Diagram helps define these DTOs (Data Transfer Objects). It ensures that the frontend receives exactly what it needs without exposing sensitive database fields.
Bridging the Gap: Integration Strategies 🔗
It is rare for a project to rely exclusively on one diagram. Most robust systems require a translation between the data model and the object model. This process is often referred to as Object-Relational Mapping (ORM).
- Mapping Entities to Classes: An Entity in an ERD usually maps to a Class in the code. However, a Class might contain multiple entities if the database schema is split across tables for performance (sharding or partitioning).
- Handling Many-to-Many: In an ERD, a many-to-many relationship might require a junction table. In a Class Diagram, this is often represented as a collection within a class (e.g., a Student class holding a list of Course objects).
- Denormalization: Sometimes, to improve read performance, data is denormalized in the database. The Class Diagram might need to account for this by having attributes that are not directly tied to a single database column.
Understanding this mapping is vital. If the Class Diagram does not align with the ERD, developers may struggle to persist data correctly. Conversely, if the ERD does not reflect the business rules captured in the Class Diagram, the database may enforce constraints that hinder application functionality.
Common Modeling Mistakes ⚠️
Misusing these diagrams can lead to significant technical debt. Avoid the following pitfalls to ensure your architecture remains solid.
- Ignoring Cardinality in ERDs: Failing to define correct cardinality (one-to-one vs. one-to-many) leads to ambiguous relationships. This makes queries inefficient and data integrity hard to enforce.
- Over-Modeling in Class Diagrams: Creating deep inheritance hierarchies that are difficult to maintain. Sometimes, composition is a better choice than inheritance. If a class has too many methods, it may be a sign that it is doing too much.
- Confusing State with Behavior: An ERD shows state (attributes). A Class Diagram shows behavior (methods). Do not try to force behavior into an ERD. It lacks the syntax to represent logic.
- Neglecting the Domain Model: The Class Diagram should reflect business rules, not just database tables. If your Class Diagram is a direct copy of your ERD, you have likely missed opportunities to encapsulate logic and simplify the API.
Decision Framework 🧭
When starting a new project, use this framework to decide which diagram to prioritize first.
- Identify the Bottleneck: Is the challenge primarily data storage, retrieval, and volume?
- Yes: Start with the ERD.
- No: Proceed to step 2.
- Assess Logic Complexity: Are there complex workflows, state machines, or rule engines?
- Yes: Start with the Class Diagram.
- No: Proceed to step 3.
- Review Team Expertise: Does the team have strong SQL skills but weak OOP skills?
- Yes: Emphasize the ERD to leverage existing strengths, then introduce OOP concepts.
- No: Use both in parallel.
- Check External Dependencies: Are you consuming existing APIs or legacy databases?
- Yes: Model the external constraints with an ERD first.
- No: Design the Class Diagram to define your vision.
Final Thoughts on Modeling 📝
The choice between an ERD and a Class Diagram is not binary. It is a strategic decision based on where the complexity lies in your specific project. An ERD protects your data, while a Class Diagram protects your logic. Successful architecture often involves iterating between the two. As requirements change, the data model must evolve, and the object model must adapt.
By understanding the distinct strengths of each tool, you can create a system that is resilient, scalable, and easy to understand. Whether you are building a simple internal tool or a massive distributed system, these diagrams provide the necessary blueprint to navigate the complexities of software development.
Focus on clarity in your diagrams. A diagram that is easy to read is better than a diagram that is technically perfect but confusing. Use them to communicate with your team, document your decisions, and guide your implementation. This disciplined approach to modeling lays the foundation for a high-quality product.