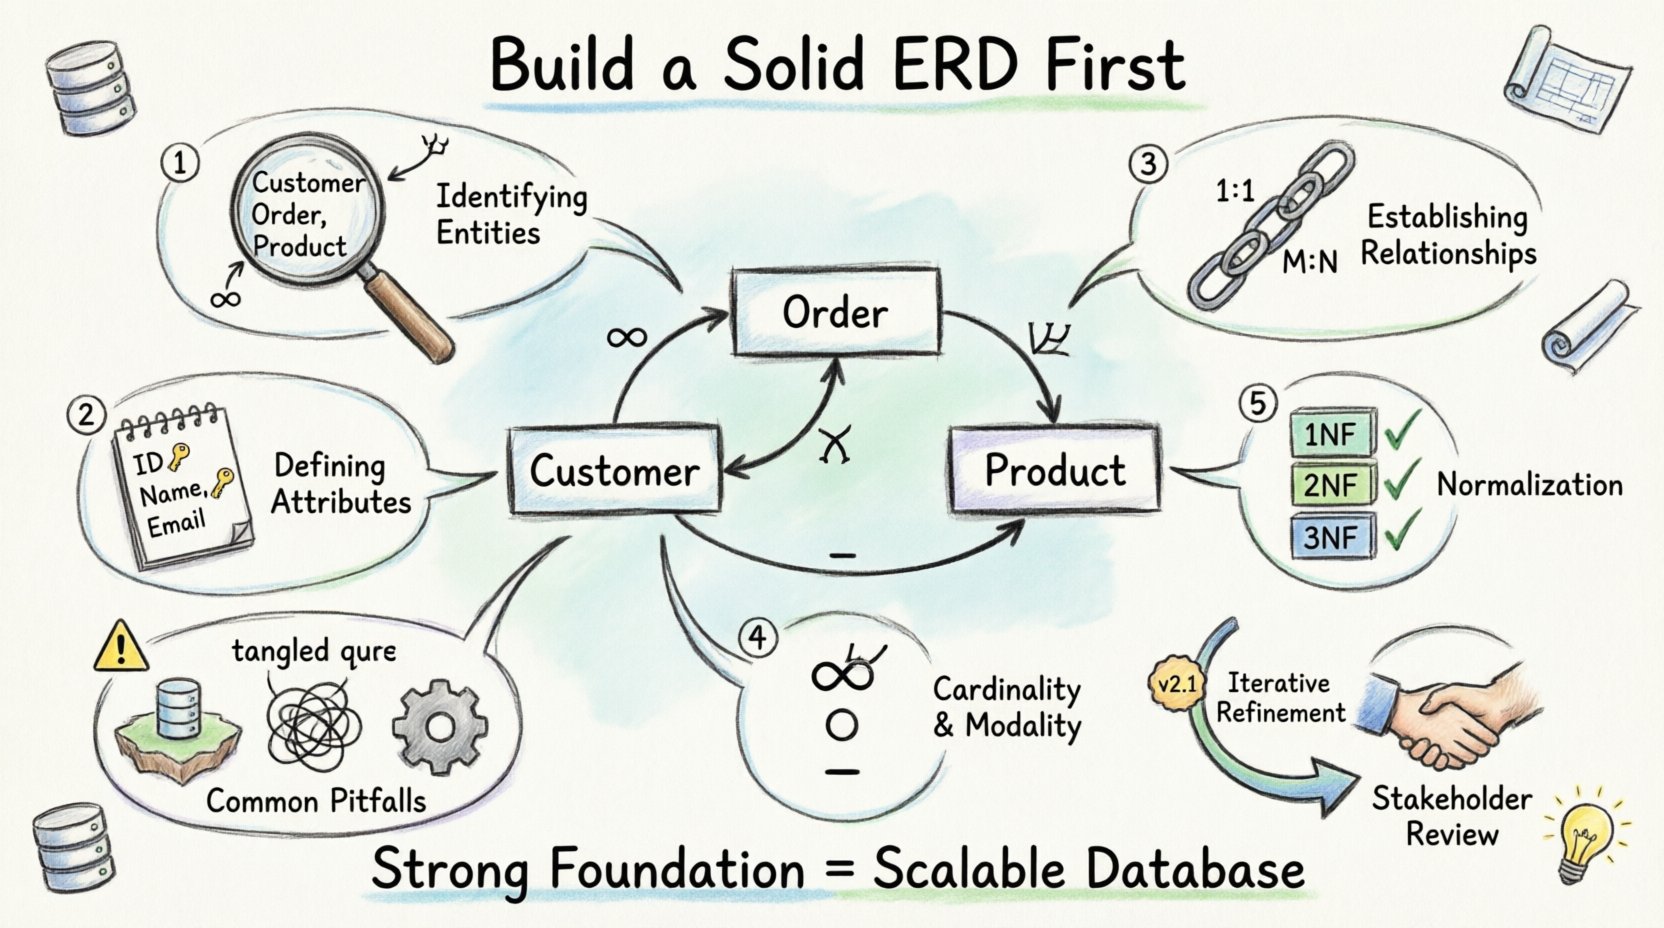
Designing a database is less about typing code and more about understanding relationships. Before a single line of script is written, a visual foundation must be laid. This foundation is the Entity-Relationship Diagram, commonly known as an ERD. Skipping this step is akin to building a skyscraper without a blueprint. The structure might stand for a while, but as data grows, the cracks will show. 🧱
This guide walks through the initial phase of database architecture. It focuses on the conceptual and logical models required to create a robust schema. Whether you are managing customer records, inventory, or complex transactional data, the principles remain the same. We will explore entities, attributes, relationships, and cardinality without relying on specific tools or proprietary software. The goal is to build a system that is scalable, efficient, and easy to maintain. 🚀
Understanding the Entity-Relationship Diagram 📐
An ERD is a visual representation of the data structures within a system. It maps out the “things” (entities) that need to be stored and how they interact with one another. Think of it as a map for the database engine. It does not define how data is stored physically on the disk, but rather how data is logically organized for the application.
Why Start Here? 🤔
Starting with a solid diagram prevents several common issues:
- Data Redundancy: Storing the same information in multiple places leads to inconsistencies.
- Integrity Errors: Relationships are defined clearly, preventing orphaned records.
- Scalability: A logical model can be adapted as the business grows without a total rebuild.
- Communication: Stakeholders can review the structure before development begins, ensuring requirements are met.
Without an ERD, developers often guess at relationships. This leads to complex joins later and performance bottlenecks. A well-defined diagram serves as the single source of truth for the entire project team. 🤝
Step 1: Identifying Entities 🏢
The building blocks of any database are entities. An entity represents a distinct object, concept, or person about which data is collected. In the context of a diagram, these are the nouns you identify in your requirements.
Real-World vs. Logical Entities
When analyzing a business process, you must distinguish between physical objects and logical concepts. For example, a “Product” is a logical entity. A specific “Widget” in a warehouse is a physical instance. The database stores the logical entity, tracking instances through unique identifiers.
Identifying Candidate Entities
To find entities, review the business rules and functional requirements. Look for:
- Nouns: Scan your requirements document for capitalized nouns.
- Core Functions: What actions are performed? Who is involved?
- Regulatory Needs: What data must be kept for compliance?
Common examples include:
- Customer: Who is buying or interacting?
- Order: The transaction record.
- Product: The item being sold.
- Employee: Who manages the system?
- Location: Where are shipments sent?
Entity Naming Conventions
Consistency is key for readability. Use singular, plural, or consistent naming standards across the diagram. Avoid abbreviations unless they are industry-standard. For example, use “Customer” instead of “Cust”.
| Aspect | Recommendation | Example |
|---|---|---|
| Case | PascalCase or snake_case | CustomerRecord or customer_record |
| Plurality | Use Singular for Tables | Use Customer, not Customers |
| Clarity | Avoid generic names | Use Invoice, not Document |
Step 2: Defining Attributes 📝
Once entities are identified, you must define what information is stored about them. These details are called attributes. Attributes describe the characteristics of the entity.
Types of Attributes
Attributes fall into several categories based on their role and behavior:
- Descriptive Attributes: Basic facts like a name, address, or phone number.
- Key Attributes: Unique identifiers. Every entity needs at least one key to distinguish it from others.
- Composite Attributes: Data that can be subdivided into smaller parts (e.g., an address can be split into street, city, zip).
- Derived Attributes: Values calculated from other data (e.g., Age derived from Date of Birth).
- Multivalued Attributes: Fields that can hold multiple values (e.g., Phone Numbers for a single person).
Primary Keys: The Anchor 🔑
The Primary Key (PK) is the most critical attribute. It must be unique for every record in the table. It ensures that no two rows are identical. Primary keys are often generated automatically by the system, such as an auto-incrementing integer or a UUID.
Considerations for choosing a key:
- Stability: The value should not change over time. Using a name is risky; using an ID is safer.
- Uniqueness: No duplicates allowed.
- Non-Nullability: A record cannot exist without a key.
Step 3: Establishing Relationships 🔗
Entities rarely exist in isolation. A Customer places an Order. An Employee works on a Project. These connections are relationships. Defining relationships is where the true power of the ERD lies.
Types of Relationships
There are three standard cardinalities used to describe how entities interact:
- One-to-One (1:1): One instance of Entity A relates to exactly one instance of Entity B.
- One-to-Many (1:N): One instance of Entity A relates to many instances of Entity B.
- Many-to-Many (M:N): Many instances of Entity A relate to many instances of Entity B.
Handling Many-to-Many Relationships
In a relational model, a direct Many-to-Many relationship is not supported physically. It must be resolved using an associative entity (also known as a bridge table or junction table). This new entity breaks the M:N relationship into two One-to-Many relationships.
For example, a Student can take many Courses, and a Course can have many Students. Instead of linking them directly, create a Enrollment entity. This table holds the Student ID and the Course ID, along with any specific data for that enrollment (like a grade).
Step 4: Cardinality and Modality 🔢
Cardinality defines the count of relationships. Modality defines the optionality (whether a relationship is mandatory or optional). These details ensure data integrity.
Cardinality Notation
Visual notation helps developers understand the constraints. Common symbols include:
- One: A single line or a dash (-).
- Many: A crow’s foot symbol (∞) or three prongs.
- Optional: A circle (○) indicating zero is allowed.
- Mandatory: A solid line indicating at least one is required.
Participation Constraints
Understanding participation is vital for application logic. Consider the following scenarios:
- Total Participation: Every Customer must have an Order. (Mandatory)
- Partial Participation: An Order may have a Shipping Address. (Optional)
Incorrect modality leads to database errors. If a system requires a mandatory relationship but the database allows nulls, the application logic will break when data is missing.
Step 5: Normalization Context 🔄
While the ERD is a logical model, it must align with normalization principles. Normalization reduces redundancy and improves data integrity. It involves organizing attributes into tables to minimize dependencies.
First Normal Form (1NF)
Ensure atomic values. A field should not contain a list of items. For example, instead of a “Hobbies” field containing “Reading, Hiking, Coding”, create a separate “Hobbies” table.
Second Normal Form (2NF)
Remove partial dependencies. All non-key attributes must depend on the whole primary key, not just part of it. This usually applies when a table has a composite key.
Third Normal Form (3NF)
Remove transitive dependencies. Non-key attributes should not depend on other non-key attributes. For example, in a “Employee” table, if you store “City” based on “OfficeID”, you should separate “OfficeID” and “City” into an “Office” table.
The ERD helps visualize these dependencies. If you see attributes grouped in a way that suggests repetition, the ERD needs adjustment before writing SQL. ⚙️
Common Pitfalls to Avoid ⚠️
Even experienced designers make mistakes during the initial phase. Recognizing these pitfalls early saves significant time during development.
| Pitfall | Consequence | Solution |
|---|---|---|
| Missing Relationships | Data becomes isolated islands | Review requirements for all connections |
| Over-Normalization | Queries become too complex | Balance integrity with read performance |
| Ignoring Data Types | Storage inefficiency and errors | Define types (Date, Number, Text) early |
| Hardcoded Values | System becomes rigid | Use lookup tables for static data |
| Weak Keys | Difficulty in tracking records | Ensure keys are unique and stable |
Documentation and Review 📄
The ERD is not a one-time drawing. It is a living document that evolves with the project. Once the initial design is complete, it must be reviewed.
Stakeholder Validation
Present the diagram to business analysts and subject matter experts. They can spot missing business rules that developers might overlook. For example, a rule that “A refund cannot be processed after 30 days” might not appear in a technical diagram but is crucial for logic.
Technical Feasibility
Review the design with the database administrators. They can assess if the proposed schema will perform well with the expected data volume. They might suggest indexing strategies or partitioning plans based on the relationships defined.
The Iterative Process 🔄
Database design is rarely linear. New requirements emerge. Business processes change. The ERD must be updated to reflect these changes.
Version Control for Schemas
Just like code, database schemas should be versioned. This allows teams to track changes over time. If a change breaks the system, you can revert to a previous version of the ERD and the corresponding script.
Change Management
When modifying the ERD, consider the impact on existing data. Adding a required field to an existing table might break reports. Adding a new relationship might require data migration. Always plan the migration strategy alongside the design update.
Tools vs. Pen and Paper 🖊️
While many software solutions exist for creating ERDs, the initial thinking process is best done without constraints. Using a whiteboard or pen and paper allows for rapid iteration. You can erase, redraw, and restructure without worrying about formatting or software limitations.
Once the logical structure is agreed upon, it can be translated into a formal diagramming tool. This ensures that the conceptual model is not distorted by the limitations of the software. The tool should serve the model, not dictate it.
Final Thoughts on Design 🌟
Building a database is a disciplined exercise in logic. The first step, creating a solid ERD, sets the trajectory for the entire project. It forces you to think about data relationships before writing code. This foresight reduces technical debt and creates a system that is resilient to change.
Focus on clarity. Use standard naming. Define keys strictly. Validate with stakeholders. Treat the diagram as the contract between the business needs and the technical implementation. By following these steps, you ensure that the foundation is strong enough to support the weight of your data. 🏗️