Starting your journey in software development often begins with a blank page. Whether you are drafting requirements, sketching architecture, or planning a database schema, the visual representation of your ideas is crucial. One of the most fundamental tools in this process is the Entity Relationship Diagram, commonly known as an ERD. This guide walks you through the creation of a robust ERD from the ground up, focusing on principles rather than specific tools.
Why the Entity Relationship Diagram Matters 🔍
Before drawing a single box or line, it is essential to understand the purpose of the diagram. An ERD is not just a picture; it is a blueprint for data storage and retrieval. It defines how data is structured and how different pieces of information relate to one another. Without a clear plan, databases become disorganized, leading to redundancy, inconsistencies, and difficult maintenance.
Clarity: It translates complex data relationships into a visual format that stakeholders can understand.
Communication: It serves as a common language between developers, database administrators, and business analysts.
Validation: It allows you to spot logical errors before writing any code.
Documentation: It provides a historical record of the system’s data architecture.
Core Components of an ERD 📦
To build a diagram, you must understand its building blocks. Every diagram consists of three primary elements: entities, attributes, and relationships.
1. Entities 🏢
An entity represents a distinct object or concept within the system. In a database context, this usually maps to a table. Entities can be concrete, like Customer or Product, or abstract, like Order or Subscription.
Identifiers: Every entity must have a unique way to be distinguished. This is often called a Primary Key.
Names: Use singular nouns for clarity (e.g., Book instead of Books).
Pluralization: Avoid pluralizing entity names in the diagram to maintain consistency.
2. Attributes 🏷️
Attributes describe the properties of an entity. They define what information is stored about that entity. For example, a Customer entity might have attributes like Name, Email, and Phone Number.
Data Types: Attributes have specific types, such as Text, Number, Date, or Boolean.
Constraints: Some attributes are mandatory (Not Null), while others allow empty values.
Keys: Distinguish between Primary Keys (unique ID) and Foreign Keys (link to another entity).
3. Relationships 🔗
Relationships define how entities interact. They describe the associations between data points. A relationship connects two entities, showing how they influence each other.
Direction: Relationships can be one-way or bidirectional, though databases often store them as directed links.
Cardinality: This defines the numerical relationship (e.g., one-to-many).
Participation: Determines if the relationship is mandatory or optional.
Understanding Cardinality ⚖️
Cardinality is the most critical aspect of an ERD. It dictates how many instances of one entity relate to another. Misunderstanding cardinality is the leading cause of database design flaws.
Type | Description | Example |
|---|---|---|
One-to-One (1:1) | A single instance of Entity A relates to exactly one instance of Entity B. | One Employee has one ID Card. |
One-to-Many (1:N) | A single instance of Entity A relates to multiple instances of Entity B. | One Customer places many Orders. |
Many-to-Many (M:N) | Multiple instances of Entity A relate to multiple instances of Entity B. | Many Students enroll in many Courses. |
When designing a database, Many-to-Many relationships are typically resolved by introducing an intermediate table, often called a junction or associative table. This breaks the M:N relationship into two 1:N relationships.
Notation Styles 🎨
There are several ways to visually represent an ERD. While the underlying logic remains the same, the symbols change.
Chen Notation
Entities: Represented by rectangles.
Relationships: Represented by diamonds.
Attributes: Represented by ovals connected to entities.
This style is very clear for beginners but is less common in modern database implementation tools.
Crow’s Foot Notation
Entities: Represented by rectangles.
Relationships: Represented by lines connecting entities.
Cardinality: Indicated by symbols at the end of the lines (e.g., a crow’s foot for “many”).
This is the industry standard for relational database design because it is compact and easy to read.
Step-by-Step Creation Process 🛠️
Creating an ERD is not a one-time event. It is a process that evolves as the project grows. Follow these steps to ensure a solid foundation.
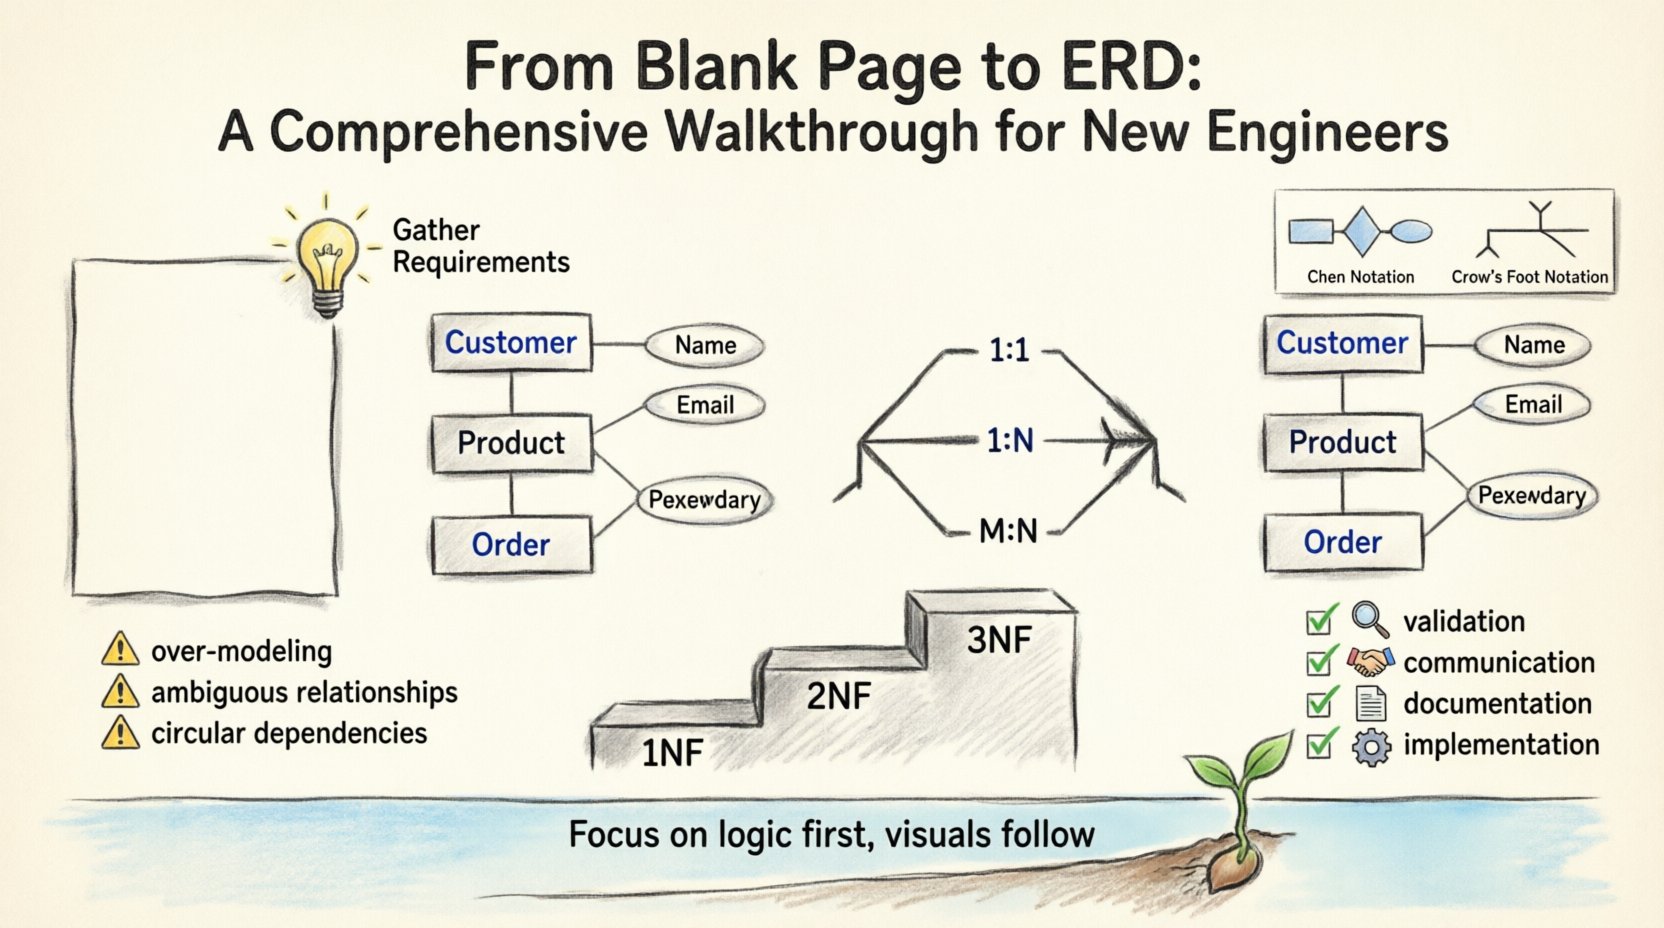
Step 1: Gather Requirements 📝
Before drawing, talk to the stakeholders. Understand what data needs to be captured. Ask questions like:
What information must be tracked?
Are there any regulatory constraints on data retention?
How will users search or filter this data?
What reports will be generated from this data?
Step 2: Identify Entities 🎯
Review the requirements and list every noun that represents a distinct object. For a library system, these might be Book, Author, Member, and Lending Record. Filter out generic terms that do not require storage.
Step 3: Define Attributes 🔑
For each entity, list the necessary details. Be careful not to over-model. If a field can be derived from another, store only the source. For example, store Date of Birth rather than Age.
Step 4: Establish Relationships 🔄
Draw lines between entities to show how they connect. Ask:
Does a Member borrow a Book?
Does a Book have multiple Authors?
Is an Author independent of the Books they write?
Mark the cardinality on each line. Ensure that every relationship is necessary for the business logic.
Step 5: Normalize the Data 🔍
Normalization reduces redundancy and improves data integrity. It involves organizing attributes and tables.
First Normal Form (1NF): Eliminate duplicate columns and ensure atomic values.
Second Normal Form (2NF): Remove partial dependencies (ensure all attributes depend on the whole primary key).
Third Normal Form (3NF): Remove transitive dependencies (ensure attributes depend only on the primary key).
Common Pitfalls to Avoid ⚠️
Even experienced engineers make mistakes. Being aware of common errors can save significant time later.
1. Over-Modeling
Creating too many tables for the sake of perfection can make the system rigid. Start simple. If a table is rarely used, it might not be needed.
2. Ambiguous Relationships
Do not leave lines without cardinality markers. Ambiguity leads to confusion during implementation. Always specify if a relationship is optional or mandatory.
3. Ignoring Data Types
While the diagram focuses on structure, keep data types in mind. Storing a phone number as text instead of a number can cause validation issues later.
4. Circular Dependencies
Avoid situations where Entity A depends on B, and B depends on A. This creates a deadlock during data insertion and complicates queries.
5. Inconsistent Naming
Use a consistent naming convention throughout the diagram. If you use UserID in one place, do not switch to User_ID in another.
Best Practices for Maintainability 🛡️
A diagram is a living document. It must be updated as the system evolves. Here are tips for keeping it relevant.
Version Control: Treat your diagrams like code. Save versions to track changes over time.
Documentation: Add notes to explain complex relationships or business rules that are not obvious from the lines alone.
Review Cycles: Schedule regular reviews with the team to ensure the design matches the current requirements.
Link to Code: Where possible, link the diagram to the actual database schema or migration scripts.
Handling Complex Scenarios 🧭
Sometimes, standard diagrams are not enough. You may encounter specialized cases.
Recursive Relationships
This occurs when an entity relates to itself. A common example is an Employee entity where one employee manages another. In the diagram, this looks like a line looping back to the same rectangle.
Inheritance and Subtyping
When entities share common attributes but have specific differences, use generalization. For example, Vehicle is a parent entity to Car and Truck. This can be represented using special symbols or separate tables depending on the implementation.
Weak Entities
A weak entity depends on another entity for its existence. It cannot be uniquely identified without the parent entity. In diagrams, these are often shown with double rectangles or specific line styles.
From Diagram to Implementation 🚀
Once the ERD is finalized, it becomes the source of truth for the database schema. The translation process involves:
Mapping Entities to Tables: Each entity becomes a table.
Mapping Attributes to Columns: Each attribute becomes a column with a defined data type.
Mapping Keys: Primary keys become unique identifiers; Foreign keys become references.
Mapping Relationships: One-to-many relationships usually result in a foreign key in the “many” table.
This phase requires attention to detail. A small error in the diagram can lead to a corrupted database. Always validate the generated schema against the diagram before deploying to production.
Reviewing Your Work 👁️
Before finalizing, perform a self-audit of the diagram.
Checklist Item | Pass/Fail |
|---|---|
Are all entities singular nouns? | ☐ |
Is every relationship labeled with cardinality? | ☐ |
Are there any circular dependencies? | ☐ |
Is the primary key for every table defined? | ☐ |
Are foreign keys consistent across tables? | ☐ |
Final Thoughts on Data Design 🌱
Designing an ERD is a skill that improves with practice. It requires a balance between theoretical knowledge and practical application. There is no single “perfect” diagram for every situation. The best diagram is the one that accurately reflects the business needs while remaining flexible enough to adapt to future changes.
Focus on the logic first, and the visuals will follow. Take your time during the initial stages. It is easier to move a line on a piece of paper than to alter a table in a live production environment. By following these structured steps and avoiding common pitfalls, you can build a solid foundation for any data-driven application.
Remember, the goal is not just to draw a diagram, but to create a clear, efficient, and maintainable structure for information. As you progress in your engineering career, you will find that the ability to visualize data relationships is one of the most valuable skills you can possess.
Keep learning, keep refining, and always prioritize clarity over complexity.