Building software is like constructing a skyscraper. You can start with a strong foundation, but if the blueprints are vague, the structure will eventually wobble. In the world of software development, data is the foundation. Without a clear plan, data accumulates into a tangled mess that slows performance, breaks features, and frustrates developers. This is where the Entity Relationship Diagram (ERD) steps in. An ERD is not just a drawing; it is the architectural blueprint for your information storage. It maps out how data connects, ensuring that as your application scales, your database remains stable and reliable.
When applications grow, the complexity of data relationships increases exponentially. A simple start might involve a single table for users, but soon you need orders, products, payments, and logs. Without a formalized structure, these tables become islands of information that do not talk to each other correctly. This leads to data redundancy, integrity errors, and slow query times. By utilizing an ERD early and maintaining it throughout the lifecycle, you create a single source of truth that guides every aspect of data management.
🧩 Understanding the Core Components of an ERD
To grasp how an ERD prevents chaos, one must understand what makes up the diagram. It is a visual representation of the database structure, translating abstract business needs into concrete technical constraints. Every diagram consists of three fundamental elements that work together to maintain order.
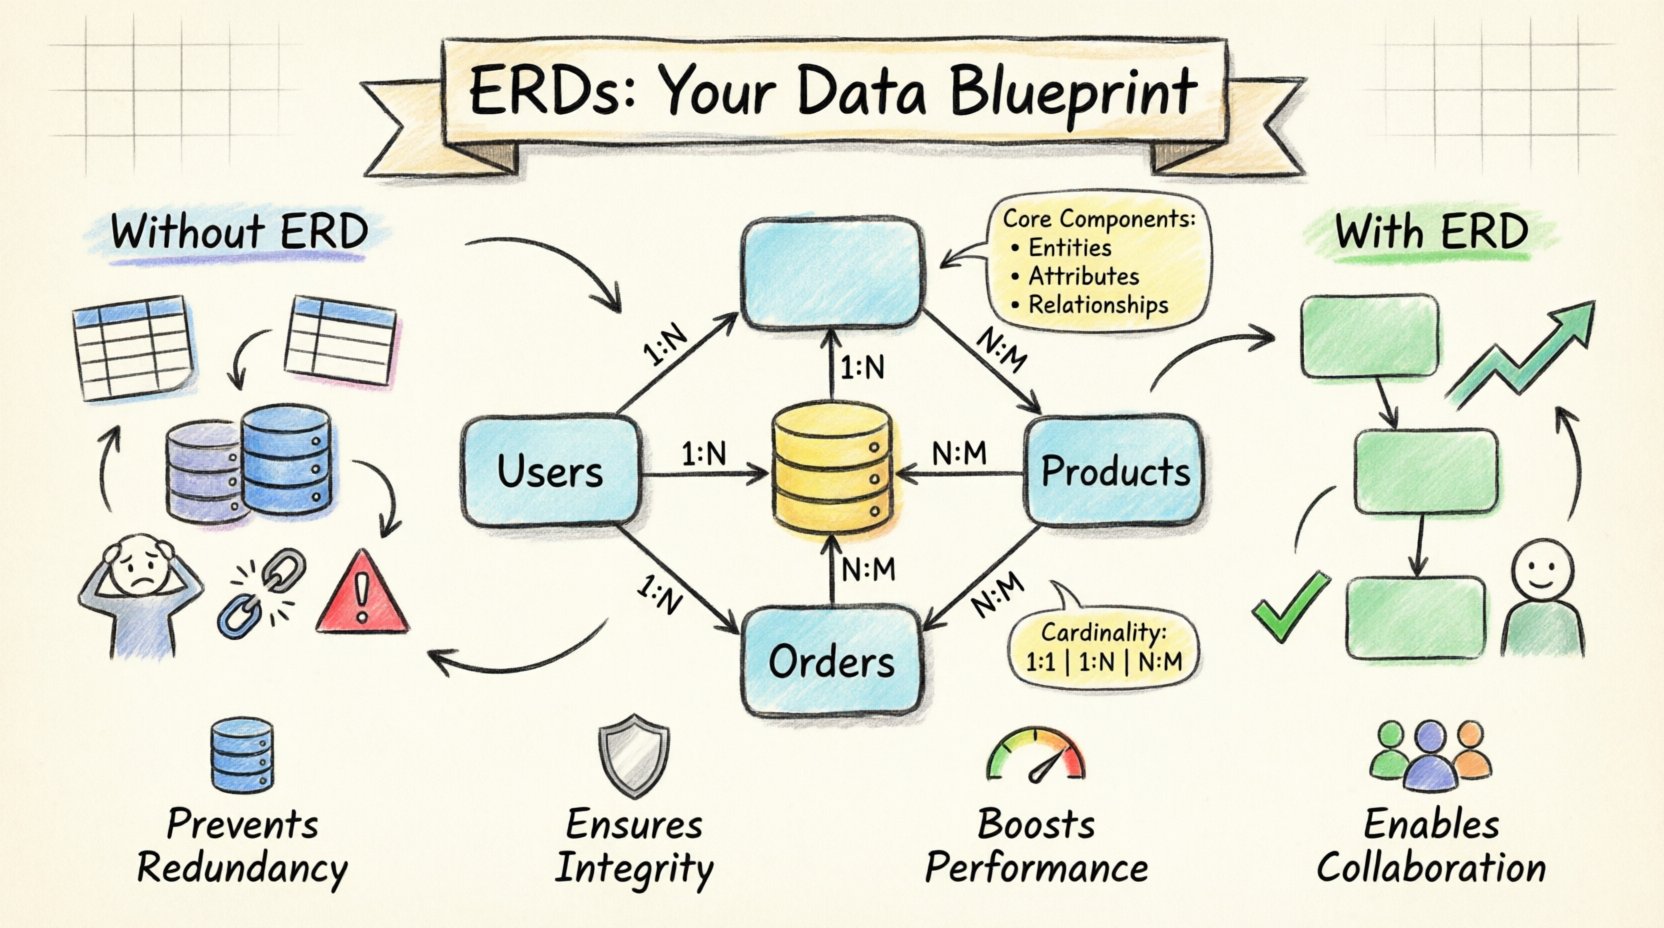
- Entities: These represent the real-world objects or concepts you are tracking. In a database, an entity typically becomes a table. Common examples include Users, Orders, and Products.
- Attributes: These are the specific details that describe an entity. For a User entity, attributes might include username, email, and created_at. Attributes become columns within the table.
- Relationships: This is the most critical part for preventing chaos. Relationships define how entities interact. A user places an order. An order contains products. These connections are represented by lines connecting the entities, often annotated with cardinality (e.g., one-to-many).
When these components are clearly defined before writing a single line of code, the development team avoids guessing games. Everyone knows exactly what data is required and how it relates to other data. This clarity reduces errors during the implementation phase significantly.
🌪️ The Mechanics of Data Chaos
What actually happens when you skip the ERD phase? It is easy to think, “I can just start adding tables as I need them.” In the short term, this feels efficient. However, in the long term, it creates a debt that compounds over time. Here is a breakdown of the specific issues that arise without a structured data model.
1. Redundancy and Duplication
Without a clear schema, developers often copy-paste data to make features work quickly. You might store a customer’s name in the orders table and also in the customers table. If that customer changes their name, you must update it in two places. If you miss one, your data becomes inconsistent. An ERD enforces normalization, ensuring data is stored in only one logical place.
2. Referential Integrity Violations
This occurs when a link between data points is broken. For example, an order exists in the database, but the user who placed it has been deleted. Without a foreign key constraint defined in the ERD, the database allows this orphaned record to persist. This leads to broken reports and confusing UI states where data points to nothing.
3. Query Performance Degradation
As data volume grows, the way you query it matters immensely. A poorly structured schema lacks indexes or logical grouping. Joins become expensive and slow down the entire application. An ERD helps you visualize where indexes should be placed based on how the data is accessed frequently.
4. Collaboration Friction
When the data structure is undocumented, developers spend hours trying to figure out what a column name means or why a specific table exists. This slows down onboarding and feature development. A diagram serves as a visual contract between the product team and the engineering team.
📐 Strategic Implementation: Building the Foundation
Creating an ERD is not a one-time event. It is a strategic process that evolves with the business. The goal is to balance flexibility with structure. Here is how to approach the creation of a robust schema.
- Start with Business Requirements: Before thinking about tables, think about the business. What are the core objects? Who are the actors? What transactions occur? This ensures the technical model aligns with real-world usage.
- Define Primary Keys: Every table needs a unique identifier. This is the anchor for all relationships. Decide whether to use natural keys (like an email) or surrogate keys (like an auto-incrementing ID). Surrogate keys are generally preferred for stability.
- Establish Cardinality: Determine the nature of the relationships. Is it One-to-One? One-to-Many? Or Many-to-Many? This dictates how you design the foreign keys and junction tables.
- Apply Normalization: Aim for Third Normal Form (3NF) where appropriate. This minimizes redundancy. Ensure that non-key attributes depend only on the primary key.
Consider the following common relationship types and how they are represented in a diagram.
| Relationship Type | Description | Implementation Strategy |
|---|---|---|
| One-to-One (1:1) | One record in Table A relates to exactly one record in Table B. | Place a foreign key in either table. |
| One-to-Many (1:N) | One record in Table A relates to many records in Table B. | Place a foreign key in Table B pointing to Table A. |
| Many-to-Many (N:M) | Many records in Table A relate to many records in Table B. | Create a junction table (bridge) containing foreign keys from both tables. |
🚀 Scaling with the ERD
Applications do not stay static. They grow. Features are added, user bases expand, and data volume increases. A static diagram might become obsolete, but a living ERD adapts. How does an ERD assist during the scaling phase?
- Identifying Bottlenecks: As you review the diagram, you might spot that a specific table is becoming the center of gravity. This signals a need for partitioning or sharding. The visual layout helps you see where the load is concentrated.
- Migration Planning: When you need to change a schema (e.g., splitting a table), the ERD shows you all the dependent relationships. You can plan the migration to ensure no foreign key constraints are violated during the transition.
- Architectural Decisions: Sometimes, the data requirements shift from relational to non-relational. An ERD helps you understand the core relationships that must be preserved, even if the underlying technology changes.
For instance, if you decide to introduce a caching layer, you need to know which data is read-heavy. The ERD highlights the entities that are central to the application, guiding you on what to cache and what to leave in the primary store.
🛠️ Maintenance and Evolution
Creating the diagram is only half the battle. The real value comes from keeping it up to date. A diagram that does not match the actual database is worse than no diagram at all, as it creates false confidence. Here are best practices for maintenance.
- Version Control: Treat the ERD like code. Store it in your repository. Commit changes when schema changes are made. This creates an audit trail of how the data model evolved over time.
- Review Cycles: Include schema review in your sprint planning. Before deploying a database migration, verify it against the diagram. This catches mismatches before they hit production.
- Documentation Standards: Use consistent naming conventions. Avoid cryptic abbreviations. If a table name is
tbl_usr, change it tousers. Consistency reduces cognitive load for anyone reading the diagram. - Automate Generation: Where possible, generate the diagram from the existing schema. This ensures the visual representation always matches the physical reality. Use tools that can reverse-engineer the database structure.
🚫 Common Pitfalls to Avoid
Even experienced teams fall into traps when modeling data. Being aware of these common mistakes helps you steer clear of future chaos.
- Over-normalization: While normalization is good, splitting data into too many tables can make queries incredibly complex and slow. Balance the need for structure with the need for query performance.
- Ignoring Soft Deletes: In modern applications, data is rarely hard-deleted. You need a
deleted_atflag. Ensure your ERD accounts for this logical deletion strategy early on. - Hidden Relationships: Do not hide relationships inside application logic. If Table A relates to Table B, make that explicit in the database schema. Relying on the application to enforce relationships is brittle.
- Denormalization without Purpose: Sometimes you intentionally duplicate data for speed. However, this must be a deliberate choice, not a result of poor planning. Document why you are denormalizing.
🤝 The Human Element of Data Modeling
Data is not just numbers; it represents people, products, and actions. An ERD bridges the gap between technical constraints and business logic. When a product manager proposes a new feature, the ERD allows them to see the data implications immediately. It prevents the “feature creep” that often breaks databases.
Consider a scenario where a business wants to track user preferences. Without an ERD, a developer might create a new column for every preference. This leads to a wide, sparse table that is hard to query. With an ERD, they recognize a pattern: keys and values. They create a preferences table. This structure is flexible and scalable.
Furthermore, the ERD facilitates better communication between departments. When the legal team asks about data retention, the data model shows exactly where that data lives. This transparency is crucial for compliance and security audits.
🔍 Deep Dive: Integrity Constraints
One of the most powerful features of a relational database is the ability to enforce rules at the database level. These are known as constraints. An ERD is the visual precursor to these constraints. It defines where they belong.
- NOT NULL: Ensures a field must have a value. Crucial for core identifiers like user IDs or email addresses.
- UNIQUE: Ensures no duplicate values exist in a column. Essential for preventing duplicate emails or usernames.
- CHECK: Allows for custom logic, such as ensuring a price is always greater than zero.
- DEFAULT: Provides a fallback value if one is not supplied. Useful for timestamps or status flags.
By defining these in the diagram, you ensure that the database itself protects the data, rather than relying on application code to validate inputs. This is a fundamental layer of defense against data corruption.
🔄 The Lifecycle of a Schema Change
Change is inevitable. You will need to add columns, rename tables, or split entities. The ERD guides this process safely.
- Visualize the Change: Update the diagram to show the future state.
- Analyze Impact: Trace the lines. Which tables will be affected? Which queries will break?
- Plan the Migration: Write scripts that handle the transition gracefully. Add the new column first, populate it, then switch the application to use it, and finally drop the old column.
- Update the Diagram: Once the migration is complete, update the ERD to reflect the new reality.
This process prevents the “schema drift” that occurs when code and database diverge over time. Keeping the diagram in sync is the key to long-term stability.
📈 Measuring the Impact
How do you know if your ERD strategy is working? Look for these indicators of health within your application.
- Fewer Data Errors: Reports show fewer inconsistencies or orphaned records.
- Faster Onboarding: New developers can understand the data structure quickly.
- Optimized Queries: Performance metrics show stable or improved query times as data grows.
- Clear Communication: Fewer meetings are needed to explain how data flows between systems.
These metrics demonstrate that the upfront investment in modeling pays dividends over the life of the application. It shifts the focus from fixing problems to preventing them.
🛠️ Tools and Techniques for Documentation
While you should avoid relying on specific vendor tools, the practice of documentation is universal. Whether you use pen and paper, digital whiteboards, or dedicated modeling software, the principle remains the same. The goal is clarity.
Ensure your diagrams include:
- Table names in bold.
- Primary keys marked clearly.
- Foreign keys labeled with their relationship type.
- Descriptions for complex tables.
Some teams use a “Read-Only” diagram for the frontend developers and a “Write-Optimized” diagram for the backend team. This separation of concerns keeps the complexity manageable. Always ensure the final source of truth is the database schema itself, but keep the ERD as the reference for understanding.
🔗 Integrating with DevOps
In modern workflows, the database is treated as code. The ERD fits into this pipeline. When a developer commits a change to the schema, the CI/CD pipeline should validate it against the expected diagram. If the actual schema drifts from the design, the build can fail. This automated enforcement ensures that the blueprint is always followed.
This integration prevents the accidental deletion of tables or the creation of unstructured fields. It enforces discipline at the automation level, ensuring that the chaos is blocked before it ever reaches production.
🧠 Final Thoughts on Data Architecture
Data chaos is not a mystery; it is a predictable result of unstructured growth. By investing time in Entity Relationship Diagrams, you build a system that can withstand the pressure of scaling. It is about creating order out of complexity. It ensures that every piece of data has a home and a purpose.
The discipline required to maintain an ERD pays off in reliability. Your application becomes a stable platform rather than a fragile prototype. As you continue to build, remember that the diagram is a living document. It grows with you, guiding your decisions and protecting your investment. The path to a robust application is paved with clear, well-defined data relationships.