In the world of software engineering and system design, clarity is paramount. While class diagrams provide the blueprint for a system, object diagrams offer the snapshot of a specific moment in time. This distinction is critical for students transitioning from theoretical concepts to practical implementation. This article details a real-world student project case study that utilized object diagrams to resolve ambiguity, improve communication, and streamline the development process. We will explore the methodology, the specific challenges faced, and the tangible benefits gained through this modeling approach.
Understanding the object diagram case study context helps clarify why static structure diagrams are not just academic exercises but practical tools. By examining a Library Management System developed by a university team, we can see how UML object diagrams function in a live environment. This guide breaks down the process, the decisions made, and the outcomes observed, providing a roadmap for others facing similar modeling tasks.
Project Background: The Library Management System 📚
The student project in question was a semester-long assignment requiring the design and implementation of a digital library management system. The team consisted of four students with varying levels of programming experience. Their goal was to create a system capable of handling book inventory, member registration, and loan tracking.
Initially, the team relied heavily on class diagrams to define the structure. While useful for defining attributes and methods, the class diagrams did not adequately represent the runtime state of the application. This led to confusion during the coding phase regarding how specific instances would interact.
Key Project Goals:
- Track book availability in real-time.
- Manage member borrowing limits.
- Generate overdue notices automatically.
- Ensure data integrity across multiple transactions.
The challenge arose when the team attempted to map the class definitions to actual database records. They struggled to visualize how a single book instance could be associated with multiple loan instances simultaneously. This is where the decision to introduce object diagrams became necessary.
Why Choose Object Diagrams for This Stage? 🤔
Object diagrams, also known as instance diagrams, represent a specific snapshot of the system. Unlike class diagrams, which define the template, object diagrams define the actual data existing at a given time. For a student project, this distinction is vital for several reasons.
1. Clarifying Relationships
Class diagrams show the potential for a relationship (e.g., a Book can have many Loans). Object diagrams show the actual relationship (e.g., Book ID 123 is currently linked to Loan ID 55). This concrete visualization prevents logical errors in the code logic.
2. Debugging Data Flow
When the system failed to update stock levels correctly, the team could draw an object diagram of the failing state. This allowed them to see exactly which object instances held the conflicting data, rather than guessing based on class definitions.
3. Communication with Stakeholders
In academic settings, professors often ask about the “state” of the system. Object diagrams provide a clear visual answer. They show the data as it exists, not just how it could exist.
The Modeling Process: Step-by-Step 🔧
The team adopted a structured approach to integrating object diagrams into their workflow. They did not create a diagram for every single moment but focused on critical states. Here is the process they followed.
Step 1: Identify Active Classes
The first step was to list the classes that required active instance tracking. They chose the following:
- Book: The physical or digital item being managed.
- Member: The user borrowing the item.
- Loan: The transaction record linking the two.
- Fine: The penalty record for overdue items.
Step 2: Define Instance Names
For each class, the team assigned unique identifiers. This mimics the primary keys used in a database. For example, instead of just “Book”, they used “Book_001”. This naming convention made it easier to reference specific objects in discussions.
Step 3: Establish Links
Links were drawn between instances to show associations. A link from Book_001 to Loan_005 indicated that this specific book was currently on loan. The multiplicity was noted on the link to ensure the count was valid.
Step 4: Attribute Validation
Each instance had specific attribute values filled in. For a Member_010 instance, the status was set to “Active” and the borrowed_count was set to “2”. This ensured the data model matched the expected logic before coding began.
Case Study Details: Analyzing the Snapshot 📊
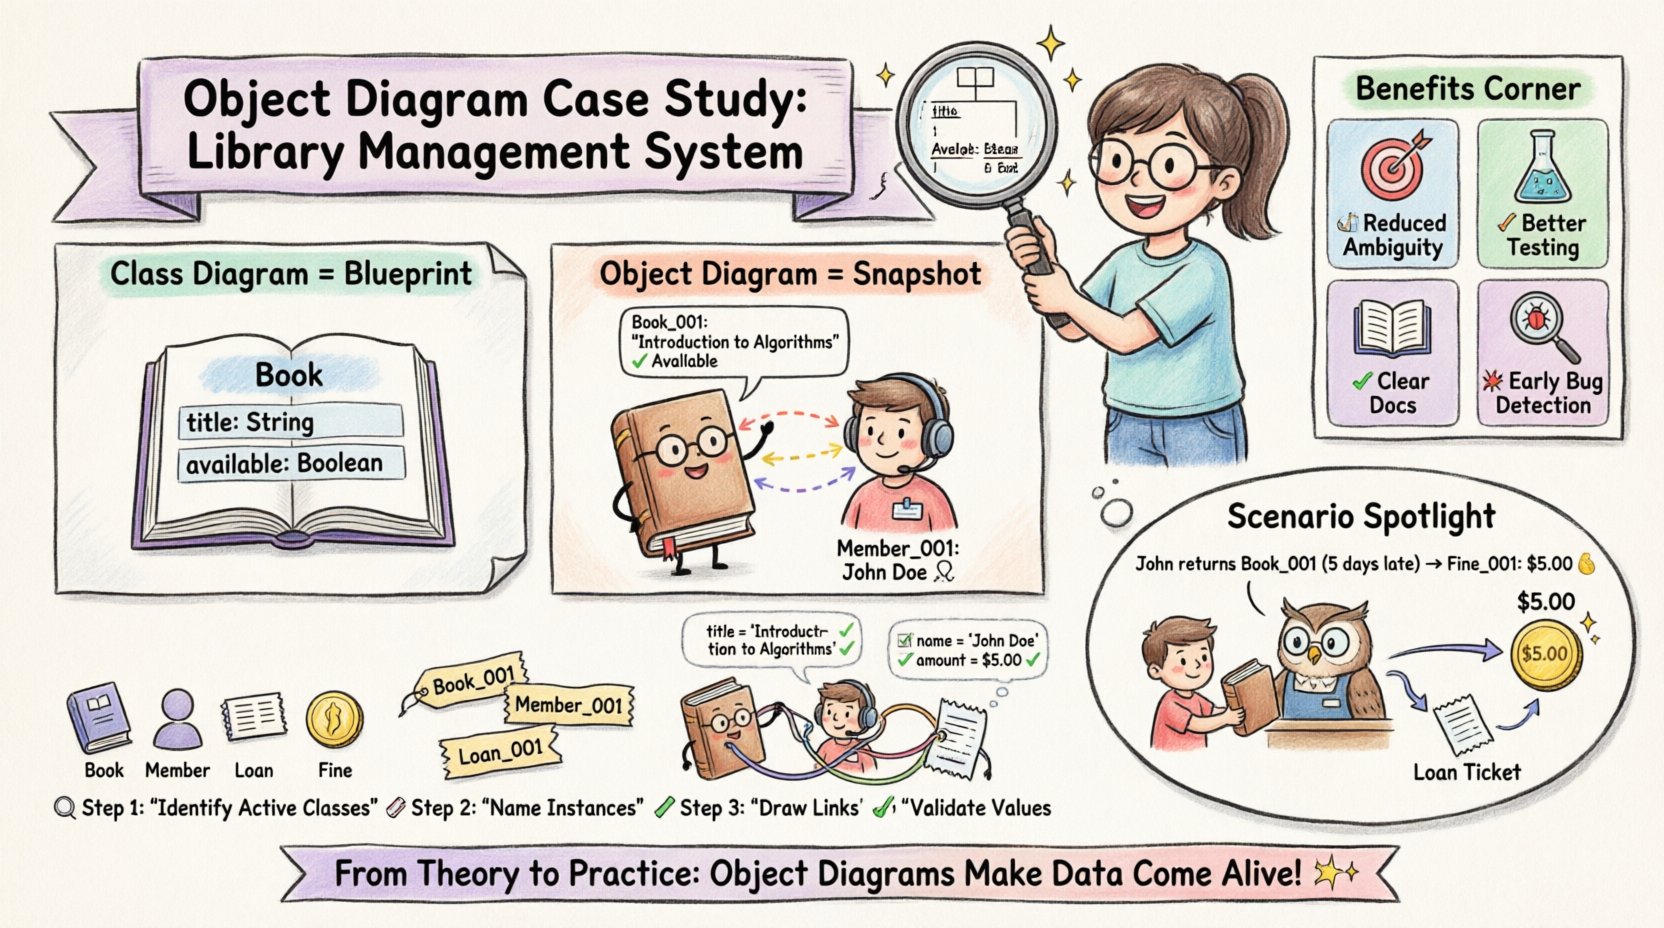
Let us look at a specific scenario from the project. The team needed to model a scenario where a member returned a book but had an outstanding fine.
Scenario: Member John Doe returns “Book_001”. The book was overdue by 5 days. The system calculates a fine of $5.00.
Object Diagram Representation:
- Instance: Member_001
- Name: John Doe
- Status: Active
- TotalFines: $5.00
- Instance: Book_001
- Title: “Introduction to Algorithms”
- Availability: Available
- Condition: Good
- Instance: Loan_005
- MemberRef: Member_001
- BookRef: Book_001
- DueDate: 2023-10-01
- Status: Returned
- Instance: Fine_001
- Amount: $5.00
- Reason: Overdue
- LinkedTo: Loan_005
This breakdown allowed the developers to see exactly how the data flowed. The Loan instance changed status, which triggered the creation of a Fine instance. This logic was much harder to deduce from a class diagram alone.
Comparison: Class Diagram vs. Object Diagram
To fully understand the value of the object diagram case study, it is helpful to compare it directly with the class diagram approach used earlier in the project.
| Feature | Class Diagram | Object Diagram |
|---|---|---|
| Focus | Blueprint / Template | Snapshot / Instance |
| Timeframe | Static (Always True) | Dynamic (Specific Moment) |
| Names | Class Names (e.g., Book) | Instance Names (e.g., Book_001) |
| Attributes | Data Types (e.g., String) | Values (e.g., “Harry Potter”) |
| Use Case | Designing Structure | Validating Data State |
| Complexity | Lower (Fewer Elements) | Higher (More Specifics) |
As shown in the table, the object diagram adds a layer of specificity that the class diagram lacks. While the class diagram told the team what a Book was, the object diagram told them what specific books were doing in the system.
Benefits Observed During Development 🚀
The integration of object diagrams into the project workflow yielded several tangible benefits. These outcomes demonstrate why this modeling technique is valuable for student projects and professional environments alike.
1. Reduced Ambiguity in Requirements
Before using object diagrams, requirements were often open to interpretation. “The system must handle loans” was vague. With object diagrams, the team defined exactly what a loan instance looked like, reducing misinterpretation.
2. Improved Testing Accuracy
Test cases were written based on the object instances. Instead of testing “a book”, they tested “Book_001” returning “Member_001”. This made unit testing more precise and easier to reproduce.
3. Better Code Documentation
The object diagrams served as documentation for the codebase. New team members could look at an instance diagram to understand the current state of data without reading every line of code.
4. Early Detection of Logic Errors
During the modeling phase, the team realized they had not accounted for a scenario where a book is lost. The object diagram process highlighted gaps in the data model before a single line of code was written.
Common Pitfalls Students Make ⚠️
Even with a clear case study, students often encounter difficulties when creating object diagrams. Identifying these common pitfalls can help avoid wasted time and effort.
- Over-Complication: Creating too many instances. Focus on critical states, not every possible variation.
- Inconsistent Naming: Using different names for the same object type. Stick to a clear convention like Type_ID.
- Ignoring Multiplicity: Drawing links without considering cardinality. Ensure the number of links matches the business rules.
- Static Attributes: Forgetting that object diagrams show current values. Attributes should reflect a specific state, not just types.
- Lack of Context: Creating a diagram without explaining the scenario. Always include a text description of the moment in time.
Best Practices for Academic Modeling 📝
To maximize the utility of UML object diagrams in academic settings, the team established a set of best practices. These guidelines ensure consistency and clarity across the project.
1. Maintain a Legend
Always include a legend explaining the symbols and naming conventions used. This ensures that anyone reading the diagram understands the context immediately.
2. Version Control
Just like code, diagrams should be versioned. If the data structure changes, the object diagram must be updated to reflect the new state. This keeps the documentation aligned with the code.
3. Focus on Critical Paths
Do not attempt to diagram every single user interaction. Focus on the critical paths where data integrity is most at risk, such as transactions or status changes.
4. Collaborative Review
Review diagrams with peers before implementation. Another set of eyes can spot logical errors that the primary designer might miss due to familiarity.
5. Link to Code
Where possible, link the object instances to the actual database records or code variables. This bridges the gap between design and implementation.
Impact on Final Code Quality 💻
The final outcome of the project demonstrated the value of the modeling phase. The codebase was cleaner and more maintainable than previous projects by the same team. The database schema was normalized effectively because the object diagram clarified the relationships.
Specific improvements included:
- Reduced Bug Count: Fewer errors related to data linking.
- Faster Debugging: Issues could be traced back to specific object states.
- Clearer API: The interface exposed data structures that matched the object diagrams.
- Scalability: The model allowed for easy addition of new object types without breaking existing logic.
Final Thoughts on UML Modeling 🌟
This case study illustrates that object diagrams are more than just academic requirements. They are practical tools that enhance understanding and reduce risk in software development. For students, the discipline of creating these diagrams forces a deeper engagement with the data model.
The transition from class diagrams to object diagrams represents a shift from theoretical design to practical reality. It forces the developer to consider the actual data that will exist in the system, rather than just the potential data.
By following the steps outlined in this guide, future projects can benefit from the clarity and precision that object diagrams provide. Whether for a university assignment or a professional product, the investment in modeling pays dividends in the quality of the final software.
Remember, the goal is not to create perfect diagrams for their own sake. The goal is to create diagrams that solve problems, clarify requirements, and guide the implementation process. When used effectively, object diagrams become an indispensable part of the development toolkit.