Understanding the structure of a software system requires more than just knowing what classes exist. It requires seeing how specific instances interact at a particular moment in time. This is where the object diagram becomes an essential tool in software design and modeling. While class diagrams define the blueprint, object diagrams provide a snapshot of the actual data and relationships within that blueprint during execution.
This guide breaks down the mechanics of object diagrams, their relationship to class diagrams, and how they fit into the broader context of Unified Modeling Language (UML). We will explore the syntax, the semantic meaning of links, and practical scenarios where these diagrams provide clarity without the need for complex software tools.
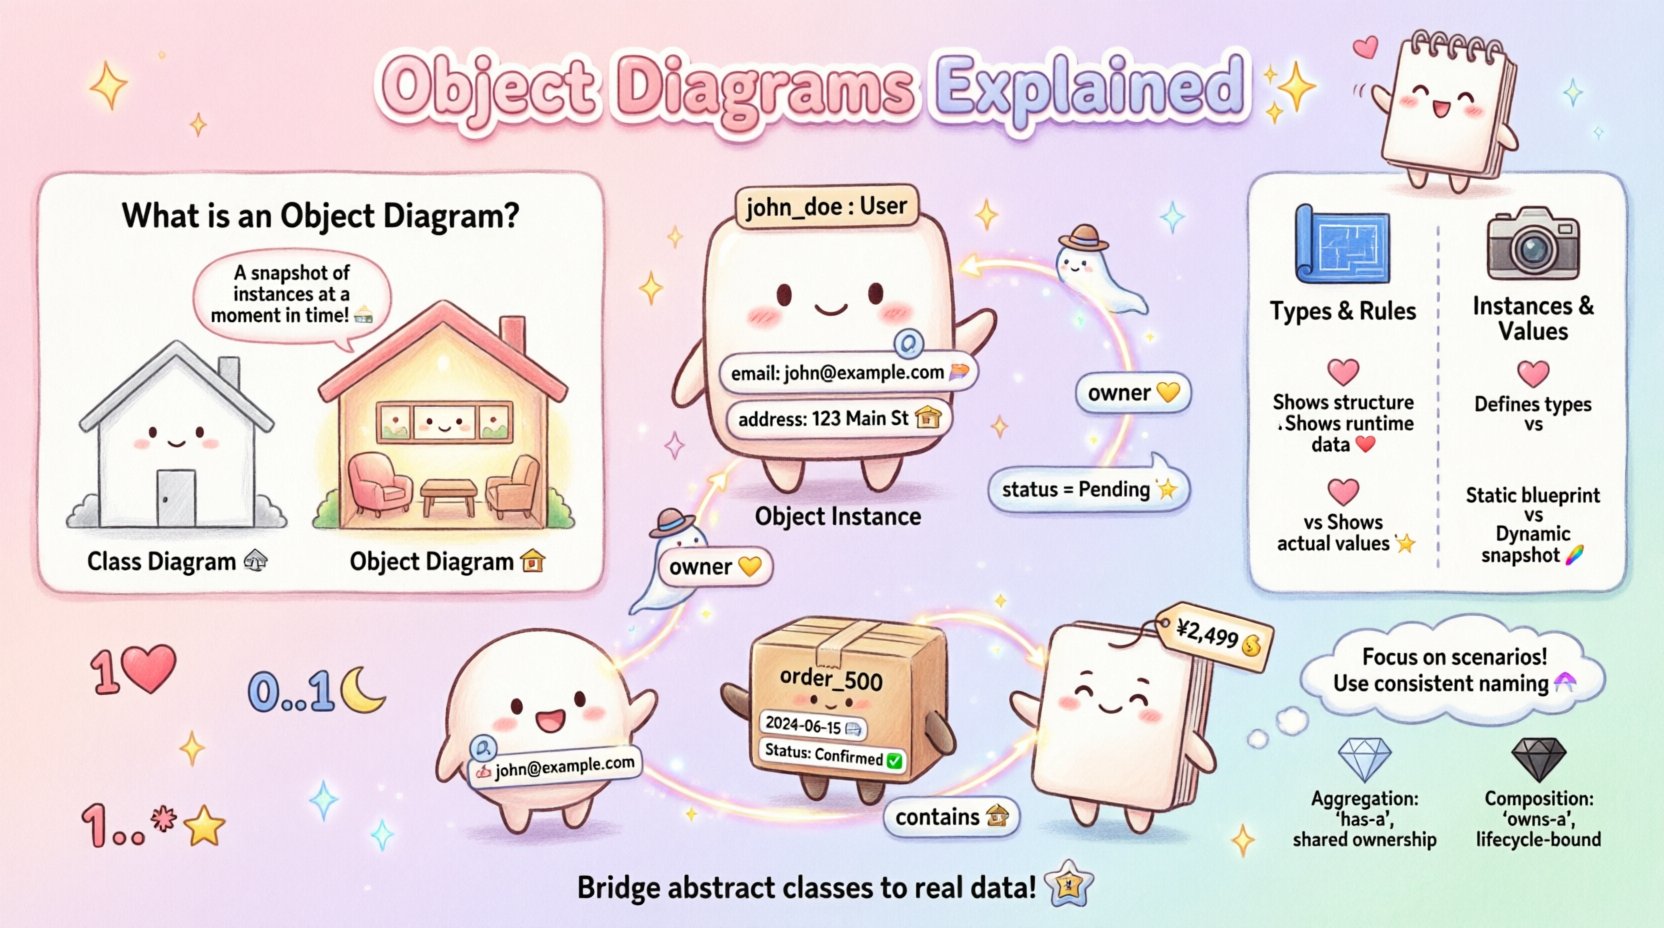
🧠 What Is an Object Diagram?
An object diagram is a static structure diagram that describes the structure of a system by showing the system’s objects and their relationships. It is essentially a snapshot of instances of classes at a specific point in time. If a class diagram is like a blueprint for a house, an object diagram is a photograph of the house with furniture placed inside, showing exactly where the chairs and tables are located.
In the context of software engineering, object diagrams represent the state of the system. They are particularly useful for:
- Validating Class Diagrams: They help verify that the classes defined in a class diagram can actually form valid relationships.
- Debugging: They allow developers to trace the flow of data through specific instances.
- Database Design: They can represent the actual data records before implementation.
- Testing: They serve as a reference for expected states during unit or integration testing.
🔍 Core Components of an Object Diagram
To construct a meaningful object diagram, one must understand the specific visual elements used to represent instances. Each component carries specific semantic weight regarding how the system behaves.
1. Object Instances
Unlike class diagrams which show a generic type, object diagrams show specific occurrences. An object is typically represented by a rectangle divided into two or three sections.
- Top Section: Contains the name of the object instance. This is often written as objectName : ClassName.
- Middle Section: Lists the attribute values for that specific instance. Unlike a class definition, this shows actual data (e.g., id = 101 or status = Active).
- Bottom Section: Lists operations or methods available to the object. Often omitted in object diagrams if the focus is purely on state.
2. Links
Links are the connections between object instances. They represent relationships that exist between specific objects. While a class diagram shows an association (a general rule), an object diagram shows a link (a specific connection).
- Directionality: Links can be unidirectional or bidirectional. An arrowhead indicates the direction of navigation.
- Role Names: Links often have labels indicating the role an object plays in the relationship (e.g., “owner” or “item”).
- Multiplicity: While often inferred from the class diagram, object diagrams can explicitly show how many instances are connected.
3. Attributes and Values
One of the distinct features of an object diagram is the visibility of attribute values. In a class diagram, you define types (e.g., String name). In an object diagram, you see the value (e.g., name = “Alice”). This distinction is crucial for understanding the runtime state.
📊 Object Diagram vs. Class Diagram
Confusion often arises between class diagrams and object diagrams. Both are static structure diagrams, but they serve different purposes. The following table clarifies the distinctions.
| Feature | Class Diagram | Object Diagram |
|---|---|---|
| Scope | General type definition | Specific instance at a point in time |
| Focus | Structure and rules | State and data |
| Relationships | Associations (Potential) | Links (Actual) |
| Attributes | Data types only | Actual values |
| Stability | Stable over time | Changes frequently |
🛠 How to Create an Object Diagram
Creating an object diagram is a methodical process. It does not require proprietary software; it requires a clear understanding of the system’s logic. Follow these steps to build an accurate representation.
- Identify the Classes: Start with your existing class diagram. You cannot create objects without defining the classes they belong to.
- Select Relevant Instances: Decide which objects are necessary for the scenario you are modeling. You do not need to draw every single object in a large system. Focus on the active elements.
- Name the Instances: Use the naming convention identifier : ClassName. For example, user01 : User.
- Define Attribute Values: Populate the middle section of the object box with realistic data values. This grounds the diagram in reality.
- Draw the Links: Connect the objects using lines. Ensure these lines match the associations defined in the class diagram.
- Label the Relationships: Add role names to the links to clarify the nature of the connection.
- Verify Multiplicity: Ensure the number of links connected to an object matches the multiplicity constraints defined in the class model.
🌐 Real-World Example: E-Commerce System
To illustrate how these concepts come together, consider an online store system. The class diagram defines that a User can place many Orders, and an Order contains many Products.
Scenario: A Single Transaction
Imagine a specific moment where a user named “John” places an order for a “Laptop”. An object diagram for this scenario would look like this:
- Object 1: john_doe : User
- email: “[email protected]”
- address: “123 Main St”
- Object 2: order_500 : Order
- date: “2023-10-25”
- status: “Pending”
- Object 3: laptop_x1 : Product
- price: 1200
- stock: 5
Links would connect john_doe to order_500 (indicating John placed the order) and order_500 to laptop_x1 (indicating the order contains the laptop). This visual representation makes it immediately clear who owns what and the current status of the transaction.
🔗 Understanding Relationships and Multiplicity
Multiplicity is a critical concept in object modeling. It dictates how many instances of one class relate to how many instances of another. In object diagrams, this is often visible through the number of lines connected to a single object.
Common Multiplicity Notations
- 1: Exactly one instance.
- 0..1: Zero or one instance (optional).
- 1..*: One or more instances (mandatory).
- 0..*: Zero or more instances (optional).
- 1..3: Between one and three instances.
When drawing links, it is important to respect these constraints. If a class diagram specifies that a Customer must have at least one Account (1..*), the object diagram should not show a Customer object with no links to an Account object. Violating these rules creates an inconsistent model that cannot function correctly.
🚀 When to Use Object Diagrams
While powerful, object diagrams are not always necessary for every project. Knowing when to deploy them saves time and reduces documentation clutter.
Ideal Use Cases
- Complex Data Structures: When the system involves complex nested data that is hard to understand through class definitions alone.
- Debugging Sessions: When a bug occurs, drawing the state of the objects involved can pinpoint the source of the error.
- Database Schema Validation: Before writing SQL, visualizing the data instances helps ensure constraints are met.
- API Documentation: Showing a sample response object structure to API consumers can be clearer than a class definition.
- Legacy System Analysis: Understanding how data flows in an existing system often requires looking at instance data rather than code structure.
⚠️ Common Mistakes to Avoid
Even experienced designers can fall into traps when creating object diagrams. Awareness of these pitfalls ensures the diagrams remain useful.
- Over-Complexity: Trying to draw the entire system state. Object diagrams should focus on a specific scenario or interaction, not the entire database.
- Mixing Levels: Combining class definitions and object instances in the same box. Keep the distinction clear: class diagrams define types; object diagrams define values.
- Ignoring Multiplicity: Drawing links that violate the cardinality rules defined in the class diagram.
- Static Data in Dynamic Contexts: Using object diagrams to show time-based behavior. For sequences of events, use Sequence or State diagrams instead.
- Missing Role Names: Failing to label links can make it unclear which object is acting upon which other object.
🔗 Integration with Other UML Diagrams
Object diagrams do not exist in isolation. They are part of a cohesive set of models that describe the system from different angles.
Sequence Diagrams
Sequence diagrams show the flow of messages over time. An object diagram often serves as the starting point for a sequence diagram, defining the objects that will exchange messages. Once the objects are identified in the object diagram, you can map their interactions in the sequence diagram.
State Machine Diagrams
State diagrams show how an object changes state. An object diagram provides the context for these states. For example, an object diagram might show a specific order in a “Shipped” state, while a state diagram explains how it transitioned from “Processing” to “Shipped”.
Activity Diagrams
Activity diagrams model the workflow. Object diagrams can clarify the input and output data for specific activities within the workflow. They act as the data context for the process flow.
📝 Best Practices for Clarity
To ensure your object diagrams are effective communication tools, adhere to these guidelines.
- Use Consistent Naming: Stick to a naming convention for objects. Use prefixes like u_ for users or o_ for orders to distinguish them from classes.
- Keep it Readable: Avoid cluttering the diagram with too many objects. If a system has millions of records, show a representative sample.
- Highlight Changes: If comparing two states, use different colors or line styles to highlight what has changed between the snapshots.
- Include Context Notes: Add a text box describing the scenario (e.g., “Snapshot taken at checkout time”) so the viewer understands the temporal context.
- Verify Against Code: If the system is already implemented, verify the object diagram against the actual code to ensure accuracy.
🧩 Advanced Concepts: Aggregation and Composition
Object diagrams can also visualize stronger forms of relationships, specifically aggregation and composition. These relationships define how dependent the lifecycle of one object is on another.
Composition
In a composition relationship, the part cannot exist without the whole. In an object diagram, this is often shown with a filled diamond. For example, a House is composed of Rooms. If the House object is destroyed, the Room objects cease to exist. This relationship is strict and immutable in the model.
Aggregation
Aggregation implies a “has-a” relationship where the part can exist independently. A Library has Books, but the books can exist outside the library. In the object diagram, this is shown with an empty diamond. This distinction helps developers understand data ownership and cleanup logic.
📈 The Role in Database Design
Object diagrams are particularly relevant in the transition from design to database implementation. They help map object-oriented concepts to relational database structures.
- Primary Keys: The object identifier in the diagram maps to the primary key in the database table.
- Foreign Keys: The links between objects map to foreign key constraints in the database schema.
- Data Integrity: By visualizing the links, designers can spot potential integrity issues before writing SQL scripts.
For instance, if an object diagram shows a Link between Order and Product, the database designer knows to create a junction table or a foreign key column. This visualization reduces the cognitive load during the coding phase.
🛑 Limitations of Object Diagrams
While valuable, object diagrams have inherent limitations that must be acknowledged.
- No Behavior: They do not show how objects interact or change over time. They are static snapshots.
- Scalability: They become difficult to manage in large systems with thousands of objects. They are best suited for specific subsystems or scenarios.
- Maintenance: Because they represent specific states, they can become outdated quickly if the system changes. They require maintenance alongside the code.
- Abstraction Loss: By focusing on specific values, they may obscure the general rules of the system that are better captured in class diagrams.
❓ Frequently Asked Questions
Q: Can I use object diagrams for real-time monitoring?
A: Yes. Because they represent runtime state, they can be used to visualize the current status of a system. However, for live monitoring, dynamic visualization tools are often more practical than static diagrams.
Q: Do I need to draw every single attribute?
A: No. Include only the attributes relevant to the scenario. Omitting irrelevant data keeps the diagram readable and focused.
Q: How do I represent inheritance in an object diagram?
A: Inheritance is typically shown via the class diagram. In an object diagram, instances are typed by their specific class. If a subclass object is used, it is labeled with the subclass name, implying the inheritance relationship.
Q: Are object diagrams part of the standard UML?
A: Yes. Object diagrams are a standard part of the Unified Modeling Language specification. They are classified as static structure diagrams.
Q: Can I create an object diagram without a class diagram?
A: Technically, you can, but it is not recommended. The class diagram provides the rules and types that the object diagram follows. Creating objects without defining their classes leads to an inconsistent model.
🎯 Summary of Key Takeaways
Object diagrams are a vital component of software modeling. They bridge the gap between abstract class definitions and concrete runtime data. By focusing on instances, values, and links, they provide a clear view of system state.
- Definition: A snapshot of instances and relationships.
- Components: Objects, links, and attribute values.
- Purpose: Validation, debugging, and data visualization.
- Best Practice: Focus on specific scenarios, not the entire system.
- Integration: Works best alongside class, sequence, and state diagrams.
Mastering the use of object diagrams enhances the ability to communicate complex data structures. It ensures that the logic defined in design documents aligns with the reality of the data being processed. Whether for new development or legacy analysis, this tool provides clarity where class diagrams alone may fall short.