When we talk about software architecture, the conversation often starts with class diagrams. They are the blueprints, the static definitions of what a system should look like on paper. However, there is a distinct difference between the theoretical structure of a class and the actual living, breathing state of objects when code executes. This is where the object diagram becomes an essential artifact in professional software engineering. Unlike the classroom where diagrams are often simplified for educational purposes, real-world object diagrams capture the dynamic nature of data at a specific moment in time.
Understanding how to represent runtime states is crucial for debugging complex systems, documenting data migrations, and ensuring data integrity across distributed services. An object diagram is a snapshot. It shows instances, their specific attribute values, and the links connecting them at a precise point during execution. This guide explores the practical application of these diagrams, moving past theory into the nitty-gritty of production environments.
🧩 Defining the Object Diagram in a Production Context
In the world of Unified Modeling Language (UML), an object diagram is a type of static structure diagram. While a class diagram defines the template, the object diagram defines the instance. Think of it this way: if a class diagram is the architectural plan for a house, the object diagram is the photo of the house with specific furniture placed in specific rooms.
In a professional setting, these diagrams serve several critical functions that go beyond simple documentation:
- Runtime State Visualization: They help developers understand what data exists in memory during a specific operation.
- Debugging Aid: When a bug occurs involving null references or unexpected object states, a diagram clarifies the relationships.
- Communication: They provide a visual shorthand for non-technical stakeholders to understand data flow.
- Validation: They ensure that the actual data structure matches the intended design constraints.
Unlike class diagrams which remain relatively constant throughout the lifecycle of a project, object diagrams are transient. They represent a momentary slice of the system’s life. This transience is what makes them powerful yet challenging to maintain in live projects.
🔍 Key Components of a Real-World Object Diagram
To construct a meaningful object diagram in a production environment, one must understand the specific elements that differentiate it from a standard class diagram. Every element serves a purpose in describing the state of the system.
1. Instances and Object Names
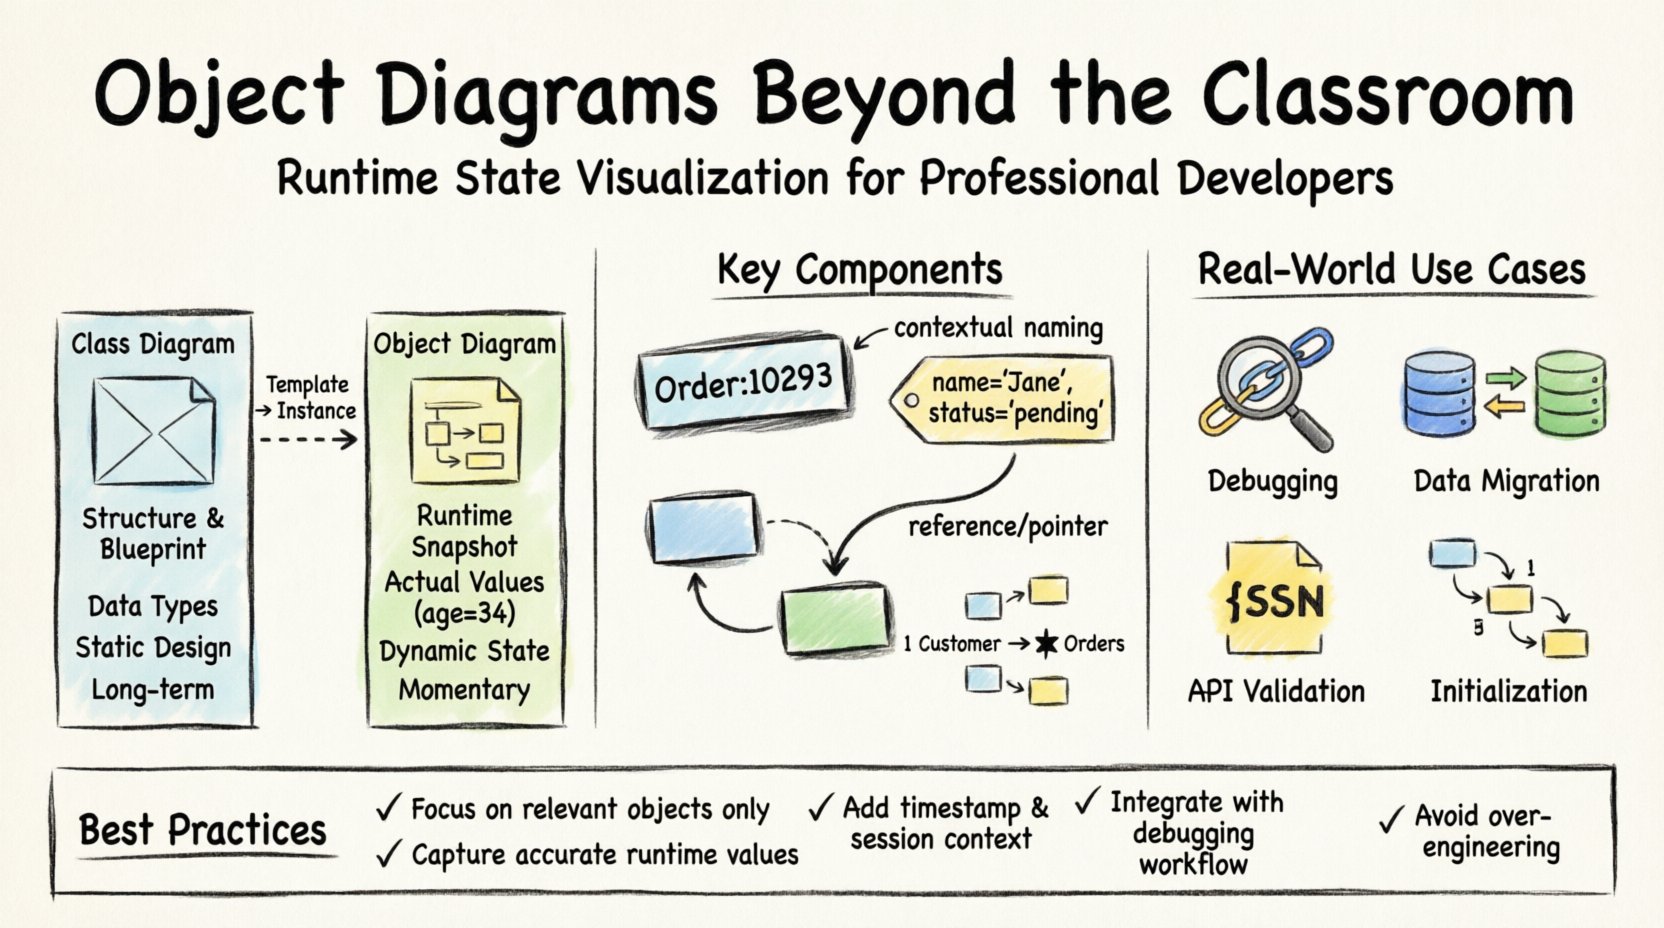
Every rectangle in the diagram represents a specific instance of a class. The naming convention is vital. In a classroom example, you might see obj1 or user1. In a real project, names should reflect context or identifiers found in the logs or database.
- Instance Name: Often follows the format
ClassName:instanceName. - Contextual Naming: For debugging, you might name an instance based on a specific ID, such as
Order:10293orSession:Active_882.
2. Attribute Values
Class diagrams show data types (e.g., int age). Object diagrams show actual values (e.g., age = 34). This distinction is the primary value of the object diagram. It answers the question: “What is the data actually holding right now?”
3. Links and Associations
Links represent the connections between objects. In a class diagram, this is a general relationship. In an object diagram, this is a specific pointer or reference. It shows that Order:10293 is linked to Customer:JaneDoe.
4. Multiplicity
Multiplicity constraints still apply. If a class diagram states that one Customer can have many Orders, the object diagram must show the specific number of Order objects linked to that Customer instance at that moment.
📊 Class Diagram vs. Object Diagram: A Practical Comparison
Confusion often arises between these two diagram types. Below is a breakdown of how they differ in a professional workflow.
| Feature | Class Diagram | Object Diagram |
|---|---|---|
| Focus | Structure and Template | Instance and State |
| Timeframe | Static (Design Phase) | Dynamic (Runtime Snapshot) |
| Names | Class Name (e.g., User) |
Instance Name (e.g., User:123) |
| Attributes | Data Types (e.g., String name) |
Actual Values (e.g., name = "John") |
| Use Case | System Design, Architecture | Debugging, Data Validation, Migration |
| Lifespan | Long-term (Changes rarely) | Short-term (Changes frequently) |
This table highlights why relying solely on class diagrams can be misleading when troubleshooting complex runtime errors. The class diagram tells you what could exist, while the object diagram tells you what does exist.
🛠️ Real-World Scenarios for Object Diagrams
When do engineers actually create these diagrams outside of academic assignments? There are specific scenarios where the overhead of creating an object diagram pays off significantly.
1. Debugging Memory Leaks and Garbage Collection
In memory-intensive applications, understanding which objects are holding references is critical. If a system is consuming excessive memory, an object diagram can map out reference chains.
- Scenario: A background service fails to release resources after processing.
- Diagram Utility: Visualize the chain of references from the Garbage Collector root to the orphaned objects.
- Outcome: Identify the specific link that prevents memory reclamation.
2. Data Migration and ETL Processes
Moving data between legacy systems and modern architectures requires strict mapping. An object diagram serves as a visual contract for the migration script.
- Scenario: Migrating customer data from a relational database to a NoSQL document store.
- Diagram Utility: Show how a single
Customerinstance with nestedAddressandOrderobjects flattens into a new structure. - Outcome: Ensures no data relationships are lost during the transformation.
3. API Response Validation
When designing RESTful APIs, developers often define JSON schemas. An object diagram can represent the expected payload structure.
- Scenario: A frontend team needs to know what data to expect from a new endpoint.
- Diagram Utility: Display the instance structure returned by the service.
- Outcome: Reduces integration errors and clarifies nested data expectations.
4. Complex Initialization Sequences
Some systems require objects to be created in a specific order to function correctly. Dependency injection frameworks often handle this, but edge cases occur.
- Scenario: A service depends on another service that hasn’t initialized its internal state yet.
- Diagram Utility: Trace the creation sequence of objects.
- Outcome: Pinpoint the exact moment a null reference is created.
🚧 Common Pitfalls in Production
Even with the right tools and intent, creating object diagrams in live projects presents challenges. Engineers often fall into traps that reduce the value of the diagram.
1. Over-Engineering
Creating a diagram for every single object in a system is impossible. The goal is to document the relevant objects.
- Bad Practice: Diagramming every user session in a high-traffic app.
- Best Practice: Diagramming the specific user session that triggered a bug.
2. Stale Documentation
Because object diagrams represent runtime state, they become obsolete the moment the system moves to the next request. If stored in documentation, they must be clearly labeled as snapshots.
- Rule: Always include a timestamp or session ID in the diagram title.
- Rule: Do not treat object diagrams as permanent architectural artifacts.
3. Ignoring Polymorphism
Objects often inherit behavior. An object diagram should clearly show the specific type of the instance, not just the parent class.
- Example: If you have a
Paymentclass andCreditCardandPayPalsubclasses, the diagram should show the specific instance type.
4. Lack of Context
A diagram without context is useless. Knowing an object has an ID of 555 is meaningless without knowing what that ID refers to.
- Requirement: Include metadata such as the thread name, execution time, or trigger event.
🔄 Integrating Diagrams into Workflow
How do these diagrams fit into the daily routine of a development team? They should not be an afterthought but integrated into the debugging and design process.
Automated Extraction
While manual drawing is common, modern tooling allows for the automatic generation of object structures from running applications. This reduces the human error of misrepresenting the state.
- Memory Dumps: Analyzing heap dumps often produces visual graphs that function as object diagrams.
- Logging Tools: Structured logging can capture object states at specific log levels.
Collaborative Review
During code reviews for complex logic, sharing a snapshot of the object state can be more effective than reading lines of code.
- Scenario: Explaining a race condition to a team member.
- Method: Show two object diagrams side-by-side: one before the lock and one after.
Version Control for Diagrams
Just as code is versioned, important diagnostic diagrams should be saved in the issue tracking system associated with a bug report.
- Benefit: Creates a historical record of the system state when the bug occurred.
- Benefit: Helps future engineers understand why a fix was implemented in a specific way.
📉 The Role of Object Diagrams in Legacy Systems
One of the most valuable uses of object diagrams is in the context of legacy code. When a system is poorly documented, reverse engineering the structure is difficult.
Reverse Engineering State
By analyzing the database or memory, engineers can reconstruct the object diagram. This helps in understanding the implicit rules of the old system.
- Step 1: Identify the core entities in the database.
- Step 2: Map the foreign keys to object links.
- Step 3: Visualize the actual data relationships.
Identifying Technical Debt
Legacy systems often accumulate complex object relationships that were not designed with scalability in mind. An object diagram reveals these tangles.
- Pattern: Circular references that complicate garbage collection.
- Pattern: Deep nesting of objects that makes serialization difficult.
📝 Summary of Findings
Object diagrams are more than academic exercises. They are practical tools for understanding the dynamic state of software systems. While class diagrams define the skeleton, object diagrams define the flesh and blood of the application at runtime.
Key takeaways for implementing this in your projects include:
- Focus on Relevance: Only diagram objects that are relevant to the specific problem or feature being discussed.
- Capture State: Ensure attribute values are accurate to the moment of execution.
- Context is King: Always annotate diagrams with timestamps and session identifiers.
- Integrate with Debugging: Use diagrams as part of the troubleshooting workflow, not just for documentation.
- Avoid Hype: Recognize that these diagrams have a short lifespan and should not be over-engineered.
By adopting a disciplined approach to object diagrams, development teams can improve their debugging speed, reduce data inconsistencies, and maintain a clearer understanding of how their code behaves in the wild. The transition from static design to dynamic visualization is a mark of mature engineering practice.
🚀 Moving Forward
As systems become more distributed and asynchronous, the need to visualize state increases. Object diagrams provide a clear, standardized way to communicate complex runtime interactions. Whether you are troubleshooting a memory leak, planning a data migration, or onboarding a new developer to a complex codebase, the ability to visualize instances and their links is a high-value skill.
Start small. When you encounter a confusing bug, try to draw the state of the objects involved. You will likely find that the visual representation clarifies the logic faster than reading the code alone. This practical application is the true value of the object diagram in the modern software landscape.