Entering the software development industry brings a steep learning curve. You quickly move from writing simple scripts to managing complex systems where components interact in intricate ways. One of the most common hurdles for beginners is understanding the static structure of a system at a specific moment in time. While class diagrams show you the blueprint, they do not show you the house as it stands today. This is where the object diagram becomes essential.
For a developer in their first year, visualizing actual instances rather than abstract types can clarify confusion, reduce bugs, and improve communication with senior engineers. This guide explores how to leverage object diagrams effectively without relying on specific tools, focusing on the core concepts that make them a powerful asset in your design toolkit.
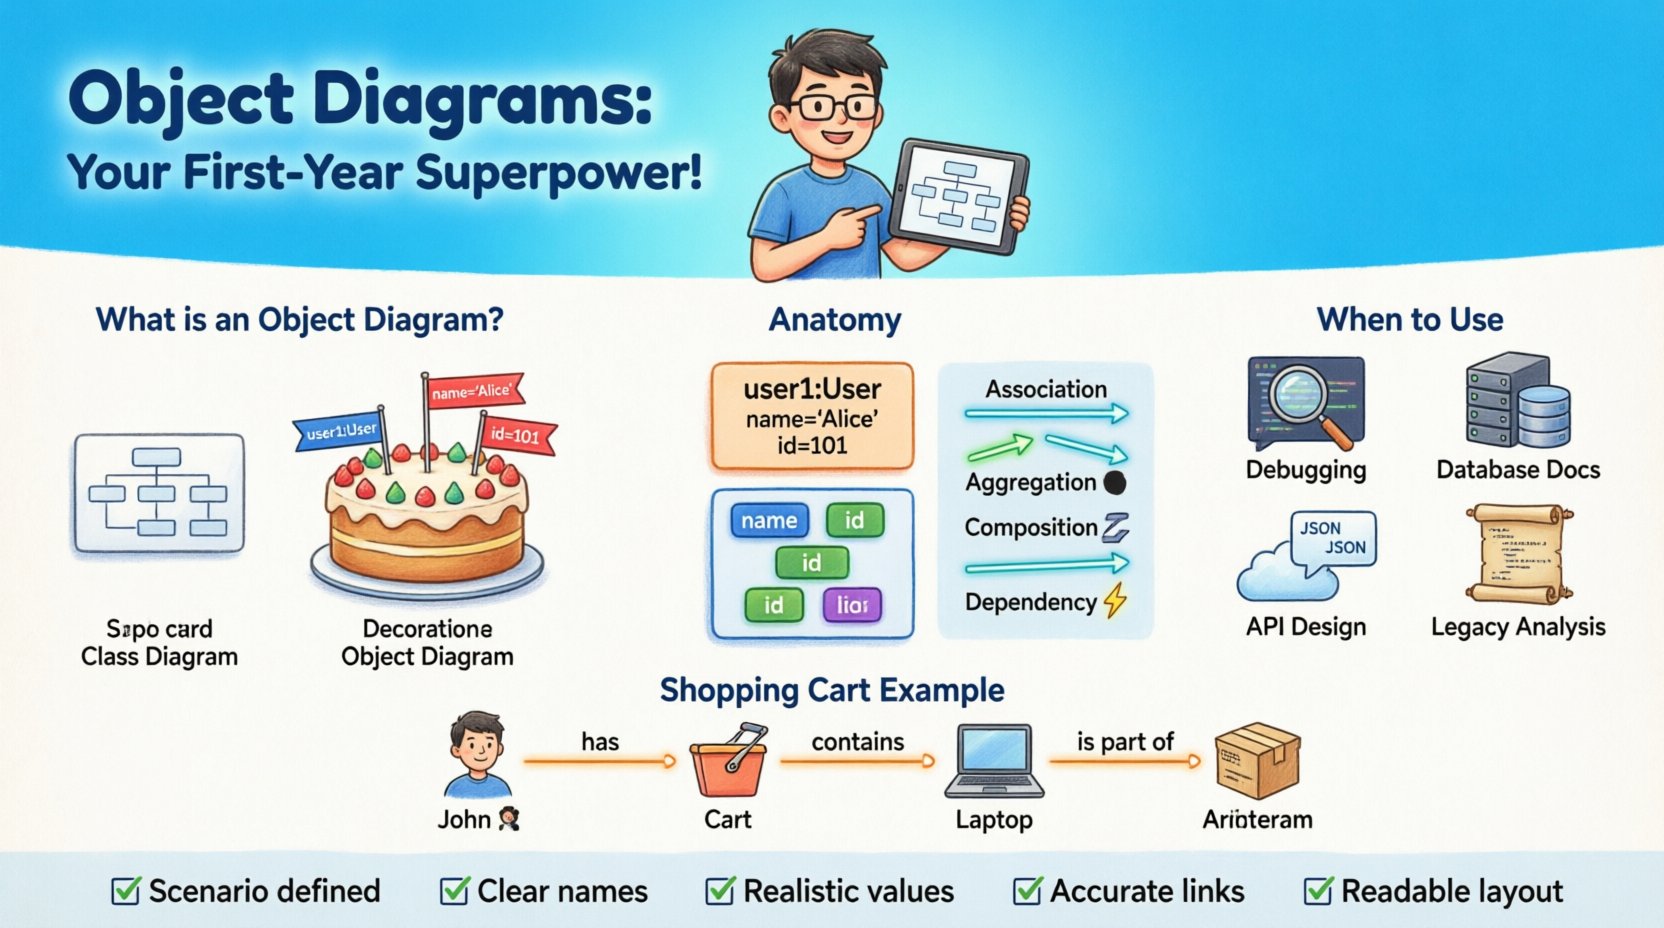
🤔 What Exactly Is an Object Diagram?
An object diagram is a type of static structure diagram in the Unified Modeling Language (UML). It depicts a snapshot of the details of the system at a particular point in time. Unlike a class diagram, which describes the types of objects and their relationships, an object diagram describes the instances of those objects.
Think of a class diagram as a recipe. It tells you the ingredients and the steps to make a cake. An object diagram is the actual cake sitting on the table, ready to be served. It shows specific values for attributes and specific links between instances.
Class Diagram: Defines the structure (e.g., a
Userclass with attributesnameandid).Object Diagram: Defines the state (e.g.,
user1is an instance ofUserwithname= “Alice” andid= 101).
For early-career developers, this distinction is vital. It bridges the gap between theoretical design and actual runtime behavior. When you look at code, you see objects being created and destroyed. The object diagram captures that fleeting moment, allowing you to analyze the system’s state before a bug occurs or a feature is implemented.
🏗️ Anatomy of an Object Diagram
To create a meaningful object diagram, you need to understand its fundamental building blocks. These elements mirror the class diagram but with a focus on concrete data.
1. Objects (Instances)
Each box in the diagram represents an object. The box typically has a bolded name at the top, followed by the class name in italics.
Object Name: Usually written as
objectNameorobjectName:ClassName.Class Name: Indicates the type (e.g.,
Order).
2. Attributes and Values
Inside the object box, you list the attributes of the class, but instead of just their types, you provide the actual values held at that moment.
Attribute: The property name (e.g.,
status).Value: The current data (e.g.,
"shipped").
3. Links (Relationships)
Lines connecting the objects represent associations. These links show that one object knows about another. In a class diagram, this is a relationship between types. In an object diagram, it is a specific link between instances.
Association: A generic relationship.
Navigation: Arrows indicate directionality of the relationship.
Multiplicity: Shows how many instances are involved (e.g., 1 to many).
🔗 Understanding Relationships in Object Diagrams
Relationships define how objects interact. Misunderstanding these is a common source of architectural debt. Let’s break down the specific relationship types you will encounter.
Association
An association represents a structural relationship between two objects. It implies that objects of one class are connected to objects of another class.
Example: A
Customerobject is associated with aOrderobject.Meaning: The customer placed the order. The order belongs to the customer.
Aggregation
Aggregation is a specific type of association that represents a whole-part relationship. However, the part can exist independently of the whole.
Example: A
Departmentobject containsEmployeeobjects.Meaning: If the department is dissolved, the employees still exist as independent entities.
Composition
Composition is a stronger form of aggregation. It represents a whole-part relationship where the part cannot exist independently of the whole.
Example: A
Houseobject containsRoomobjects.Meaning: If the house is destroyed, the rooms cease to exist in that context.
Dependency
A dependency indicates that a change in one object may affect another. It is often a temporary relationship.
Example: A
ReportGeneratorobject uses aDataLoaderobject.Meaning: If the
DataLoaderchanges, theReportGeneratormight break.
📅 When to Use Object Diagrams
Not every design phase requires an object diagram. Over-engineering can slow down progress. However, there are specific scenarios where they provide immense value for a junior developer.
1. Debugging Complex States
When a system behaves unexpectedly, it is often because the state of the objects has drifted from the design. Drawing an object diagram of the current state helps visualize the flow of data.
Scenario: A payment fails halfway through a transaction.
Benefit: You can map out which objects hold the transaction ID, which hold the status, and which are linked.
2. Database Schema Documentation
Database schemas are essentially object diagrams at rest. Using object diagrams to document the state of data helps new team members understand the data model.
Scenario: Onboarding a new backend engineer.
Benefit: Shows actual relationships between tables (objects) with sample data values.
3. API Contract Design
Before writing code, you can model the expected JSON response structure using object diagrams. This ensures the frontend and backend agree on the payload structure.
Scenario: Designing a new endpoint for user profiles.
Benefit: Visualizes nested objects and required fields.
4. Legacy System Analysis
When inheriting code written by others, the original design documents might be missing. Reverse-engineering an object diagram from the codebase helps understand the system’s current state.
Scenario: Maintaining a codebase with no documentation.
Benefit: Creates a visual map of dependencies and instance lifecycles.
🛠️ How to Create an Effective Object Diagram
Creating these diagrams is a manual process that requires discipline. You do not need expensive software to do this effectively; paper, whiteboards, or simple text-based tools work well.
Step 1: Identify the Scenario
Start with a specific use case. Do not try to model the entire system. Pick a single flow, such as “User Logs In” or “Item Added to Cart”.
Step 2: Select the Classes
Identify the classes involved in this specific scenario. Limit the scope to 5-10 objects to keep the diagram readable.
Step 3: Define Instances
For each class, create an instance. Give them unique names (e.g., user123, cart456). Assign realistic values to attributes.
Step 4: Draw Links
Connect the instances based on the relationships defined in your class diagram. Ensure the multiplicity constraints are respected (e.g., one user cannot have two active sessions at the exact same time).
Step 5: Review for Consistency
Check if the data types match. Ensure that links are bidirectional where necessary. Verify that no orphaned objects exist without a logical parent.
⚖️ Object Diagram vs. Class Diagram
Understanding the difference is crucial. Confusing the two leads to poor documentation. The table below highlights the key distinctions.
Feature | Class Diagram | Object Diagram |
|---|---|---|
Focus | Blueprint / Structure | Snapshot / State |
Elements | Classes | Instances (Objects) |
Attributes | Types (e.g., String) | Values (e.g., “Hello”) |
Timeframe | Static / Permanent | Dynamic / Temporary |
Use Case | Design Phase | Debugging / Documentation |
Complexity | High (System-wide) | Low (Scenario-specific) |
Using the right diagram at the right time prevents confusion. Class diagrams are for the architects; object diagrams are for the engineers working with the data.
🚫 Common Mistakes to Avoid
Even experienced developers make errors when modeling. For a first-year developer, avoiding these pitfalls will save you significant time during code reviews.
1. Overcomplicating the Diagram
Attempting to show every single object in the system makes the diagram unreadable. Focus on the relevant subset for the specific task at hand.
2. Ignoring Null Values
Objects often have attributes that are empty. Ignoring this leads to a false sense of completeness. Explicitly show null or default states where relevant.
3. Mixing Static and Dynamic
Do not try to show behavior (methods) in an object diagram. Keep it strictly to structure and state. Behavior belongs in sequence diagrams.
4. Inconsistent Naming
Ensure object names are consistent across the diagram. Using user1 in one place and customer for the same entity in another creates ambiguity.
5. Forgetting Lifecycle
Some objects are temporary. Ensure you are not showing an object that should have been deleted by the time of the snapshot.
💡 Best Practices for Beginners
Adopting good habits early sets you up for long-term success. Here are actionable tips to integrate object diagrams into your workflow.
Keep it Simple: Start with a single class and one instance. Add complexity only when necessary.
Use Consistent Notation: Stick to standard UML conventions. Do not invent your own shapes or colors.
Update Frequently: If the code changes, the diagram should ideally reflect the change. However, for object diagrams, this means updating the specific scenario, not the whole system.
Collaborate: Draw these diagrams on whiteboards during pair programming or meetings. They are excellent communication tools.
Focus on Relationships: The connections between objects are often more important than the attributes themselves.
🧩 Real-World Example: Shopping Cart
Let’s visualize a common scenario to solidify these concepts. Consider an e-commerce system.
Scenario: A customer adds an item to their cart and views it.
Instances:
cust001(Customer):name= “John”,email= “[email protected]”cart001(ShoppingCart):status= “active”,totalItems= 2prod001(Product):name= “Laptop”,price= 1200cartItem001(CartItem):quantity= 1,subtotal= 1200
Links:
cust001ownscart001(1-to-1 Association)cart001containscartItem001(Composition)cartItem001referencesprod001(Association)
This snapshot tells a story. It shows that John has an active cart, it contains one laptop, and the price is calculated. If the price of the laptop changes in the database, you immediately know which object needs to be updated. This clarity is the power of the object diagram.
🚀 Moving Forward with Design
As you progress in your career, you will encounter more complex systems. Microservices, distributed databases, and event-driven architectures add layers of complexity. Object diagrams remain a constant tool for grounding these abstract concepts into concrete reality.
They force you to think about the data. They force you to consider the lifecycle of your entities. They force you to validate your assumptions about how parts of the system fit together.
Start small. Pick a feature you are working on. Draw the objects involved. Check your links. Verify your values. This practice will sharpen your design intuition and make you a more effective developer.
📝 Summary Checklist
Before finalizing your design documentation, run through this quick checklist.
☑️ Have I defined the specific scenario or use case?
☑️ Are all objects named clearly and uniquely?
☑️ Are attribute values realistic for this state?
☑️ Do the links accurately reflect the relationships?
☑️ Is the diagram readable without excessive clutter?
☑️ Does it align with the class diagram definitions?
By mastering the use of object diagrams, you gain a deeper understanding of your codebase. You move beyond writing lines of code to designing systems that function correctly in the real world. This is a skill that separates good developers from great ones, and it starts with understanding the objects you create every day.
Embrace the diagram. It is a mirror reflecting the state of your system. Use it to find errors, communicate ideas, and build robust software from day one.