In the high-stakes environment of venture capital, engineering velocity is often misunderstood. Investors frequently conflate raw speed with sustainable growth. However, true scalability is not merely about how fast a team ships code today; it is about how that speed evolves as the team doubles in size, as the feature set expands, and as technical debt accumulates. For founders and CTOs, the ability to articulate engineering metrics that demonstrate predictability is as critical as the product roadmap itself.
This guide explores the specific velocity metrics that signal genuine scalability to venture capitalists. We move beyond the surface level of “points per sprint” to examine stability, flow efficiency, and throughput consistency. These indicators provide a clear window into the health of the engineering organization and its capacity to handle growth without breaking.
🧐 The Difference Between Output and Predictability
Before diving into specific metrics, it is essential to distinguish between output and predictability. A team can produce a high volume of work in a single sprint and then stall for the next three. This volatility is a red flag for investors. Scalability requires a predictable rate of delivery that can be forecasted with reasonable accuracy over quarters, not just weeks.
- Output: The total amount of work completed in a specific timeframe.
- Predictability: The consistency of that output over time.
- Scalability: The ability to maintain or increase predictability as resources increase.
Venture capitalists are risk-averse by nature. They invest in the future potential of a company. If the engineering team cannot forecast delivery dates reliably, the financial projections tied to product launches become speculative rather than calculated. Therefore, the metrics you present must demonstrate stability.
📊 Core Velocity Metrics for Due Diligence
When preparing data for investor due diligence, the following metrics carry the most weight. They should be presented not as isolated numbers, but as trends over time.
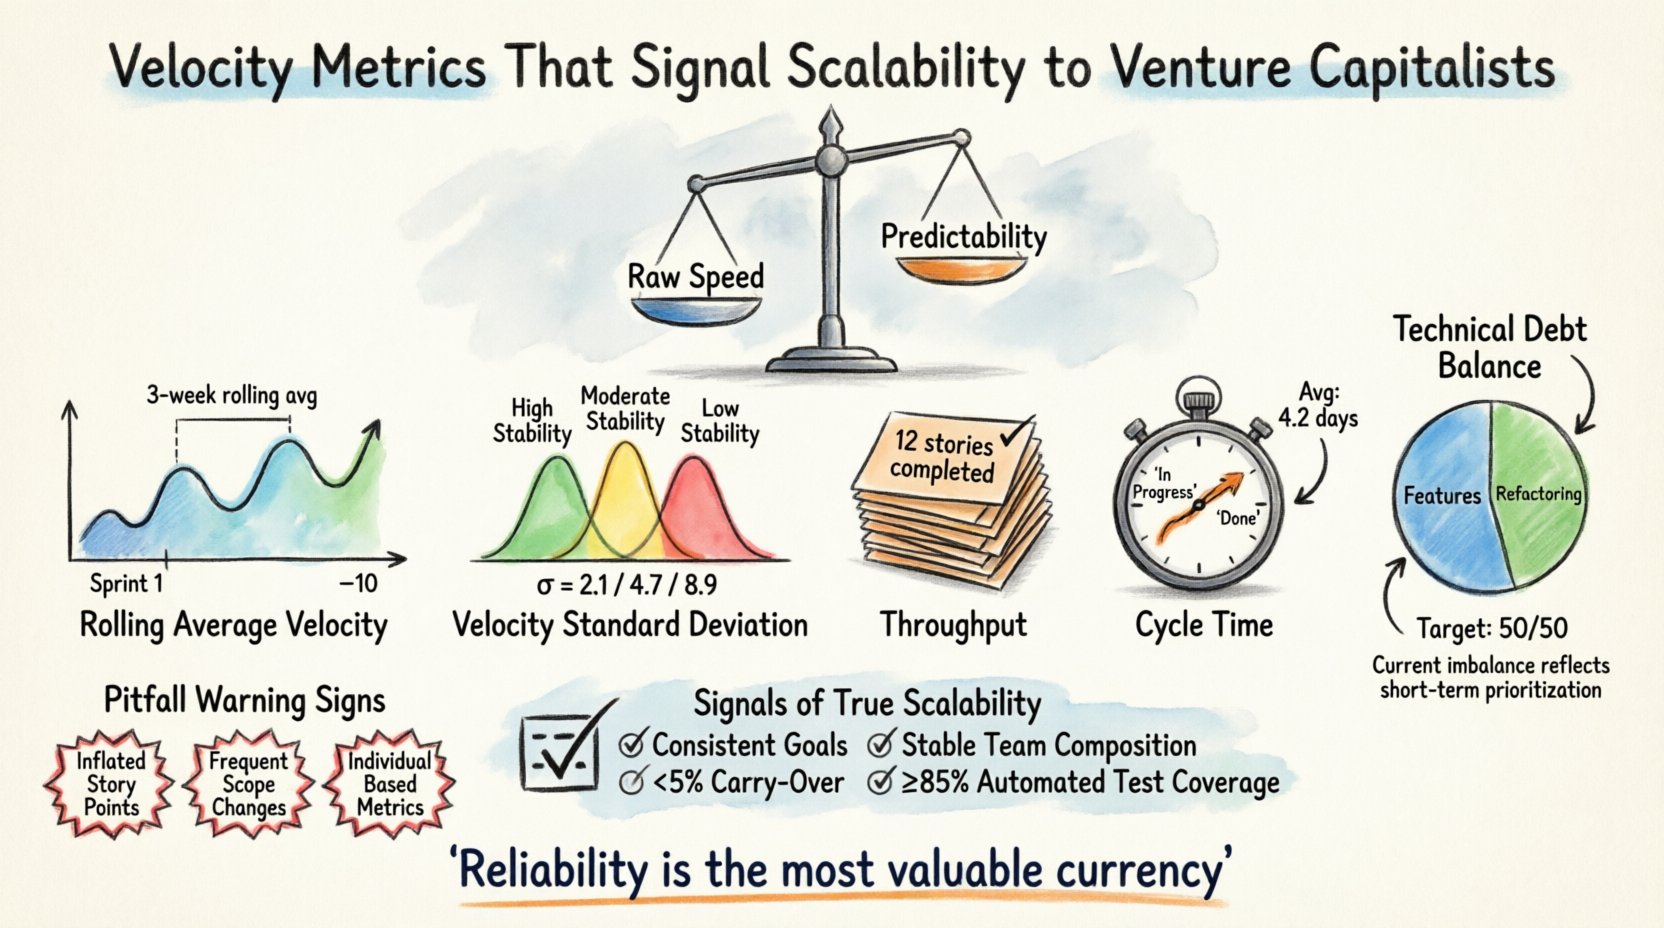
1. Rolling Average Velocity
Single-sprint velocity is noisy. A team might hit a record high due to a lucky break or low complexity, or a low point due to holidays and unplanned work. To get a true signal, use a rolling average of the last 5 to 10 sprints.
Why Investors Care: This metric smooths out anomalies. It shows the baseline capacity of the team. If the rolling average is flat while the product roadmap expands, it signals a bottleneck that needs addressing before growth can occur.
2. Velocity Standard Deviation
While the average tells you the center, the standard deviation tells you the spread. A low standard deviation indicates high stability. A high standard deviation indicates chaos.
Consider the following comparison table:
| Team Stability | Standard Deviation | Investor Perception |
|---|---|---|
| High Stability | < 10% of Average | Low Risk, Predictable Growth |
| Moderate Stability | 10% – 20% of Average | Manageable Risk, Monitor Closely |
| Low Stability | > 20% of Average | High Risk, Delivery Uncertainty |
3. Throughput (Stories Completed)
Velocity points are relative. One team’s “5 points” might be another team’s “8 points.” Throughput, measured as the count of completed user stories or tasks, is absolute. It removes the subjectivity of point estimation.
Tracking the number of stories delivered per sprint allows for a more granular analysis of complexity. If throughput is dropping while velocity points remain stable, it may indicate that story definitions are changing or that tasks are being split artificially to maintain point values.
4. Cycle Time
Cycle time measures how long it takes for a work item to move from “In Progress” to “Done.” This is distinct from lead time, which includes the wait time before work begins. For scalability, cycle time is critical because it reflects the efficiency of the development process.
As a company scales, cycle time should ideally remain stable or decrease. If cycle time increases linearly with team size, it suggests communication overhead is stifling progress. This is a classic sign of unscalable processes.
📈 Signals of True Scalability
Venture capitalists are looking for evidence that the engineering organization can handle a 10x increase in load. The following signals demonstrate that the team is built for scale.
- Consistent Sprint Goal Achievement: Did the team commit to a set of goals and deliver them? Consistency here builds trust.
- Low Carry-Over Rate: Work left unfinished at the end of a sprint indicates over-commitment or scope creep. A healthy team keeps carry-over below 5%.
- Stable Team Composition: Frequent turnover disrupts velocity. Investors prefer to see stable teams that have been working together for at least a year.
- Automated Testing Coverage: While not a velocity metric per se, the ability to ship quickly without breaking features relies on automation. A high rate of regressions kills velocity.
🛠️ Technical Debt and Velocity
One of the most critical areas of scrutiny during due diligence is technical debt. Velocity metrics often mask the accumulation of debt. A team might show high velocity while the codebase becomes increasingly brittle.
How to Track Debt Impact:
- Refactoring Ratio: Measure the percentage of sprint capacity dedicated to maintenance and refactoring versus new features. A healthy balance is often 20% to 30% for maintenance.
- Bug Rate Trends: Are bugs increasing over time? If velocity is up but bugs are up faster, the velocity is unsustainable.
- Build Times: As the codebase grows, build times should not increase exponentially. Long build times slow down the feedback loop, reducing effective velocity.
Venture capitalists understand that some debt is necessary to move fast initially. However, they need to see a plan to pay it down. If velocity metrics show a decline despite increased headcount, technical debt is likely the culprit.
🚫 Common Pitfalls in Reporting
When presenting these metrics, there are common mistakes that can undermine credibility. Avoid these practices to maintain authority.
- Don’t Inflate Points: Changing the scale of estimation to make velocity look higher is easily spotted by experienced investors. It destroys trust immediately.
- Don’t Ignore Scope Changes: If the scope of a sprint changes mid-cycle, velocity data becomes invalid. Always report on the committed scope versus the delivered scope.
- Don’t Use Velocity for Individual Performance: Using these metrics to judge individual developers creates a toxic culture and leads to gaming the system. Velocity is a team metric, not a personal one.
- Don’t Present Data Without Context: A number without context is meaningless. Explain *why* velocity dropped in a specific quarter. Was it due to a major architectural change or external factors?
📉 The Hockey Stick Fallacy
In pitch decks, founders often project a “hockey stick” growth curve for engineering output. Investors are skeptical of this. Engineering productivity does not scale linearly indefinitely. There are diminishing returns.
Reality Check:
- Brooks’ Law: Adding manpower to a late software project makes it later. This is a fundamental principle of software engineering that investors respect.
- Communication Overhead: As teams grow, the number of communication paths increases exponentially. This naturally slows down individual throughput unless processes are adapted.
- Focus Fragmentation: More features mean more context switching. This reduces the quality of output and can lower effective velocity.
When discussing scalability, acknowledge these limits. Propose solutions like dedicated feature squads, better architectural documentation, and investment in developer tooling. This shows a mature understanding of the trade-offs involved in scaling.
🔮 Presenting Data to Investors
The goal of presenting these metrics is not to show off engineering prowess, but to demonstrate operational maturity. The narrative should focus on risk reduction.
Key Narrative Points:
- Baseline Establishment: Show that you have established a baseline velocity over at least 6 months.
- Forecasting Accuracy: Demonstrate that your delivery forecasts match actual outcomes within a 10% margin of error.
- Growth Plan: Explain how you will maintain velocity as you hire. Will you add parallel teams? Will you invest in automation?
- Quality Assurance: Show that speed is not coming at the expense of stability. Include metrics on production incidents.
🌍 Global Trends in Engineering Metrics
Looking at industry benchmarks can help contextualize your data. While every organization is unique, there are general standards that top-tier venture firms expect to see.
- Deployment Frequency: Top performers deploy on demand. Mid-tier performers deploy weekly. Low performers deploy monthly.
- Lead Time for Changes: This should be measured in hours for high performers. If it takes weeks to deploy, scalability is limited.
- Mean Time to Recovery: When things break, how fast do you fix them? A low MTTR indicates a resilient system capable of scaling under pressure.
- Change Failure Rate: The percentage of deployments causing a failure in production. This should be low, ideally under 10%.
These metrics, often grouped under DevOps performance, complement traditional velocity metrics. They provide a holistic view of the engineering pipeline.
🛡️ Protecting the Culture
Metrics can be destructive if misused. A culture of fear will lead to inflated estimates and hidden problems. It is vital to ensure that the team understands these metrics are for improvement, not punishment.
Best Practices for Internal Use:
- Review Retrospectives: Use velocity data during sprint retrospectives to identify process improvements, not to assign blame.
- Focus on Flow: Encourage the team to focus on getting work done end-to-end rather than maximizing point counts.
- Transparency: Make the data visible to the whole team. When everyone sees the bottlenecks, they can work together to solve them.
When investors see that a team is using data responsibly to improve their own processes, it signals strong leadership. It shows that the engineering organization is self-correcting and adaptable.
🧩 Integrating Metrics into Funding Rounds
During funding rounds, the engineering section of the deck is often the most scrutinized by technical partners. Having a dedicated slide or appendix for velocity metrics can set you apart.
What to Include:
- A graph showing velocity stability over the last 12 months.
- A breakdown of how capacity is allocated (New Features vs. Tech Debt vs. Support).
- A chart showing the relationship between team size and output.
- A statement on the current health of the technical stack.
This level of detail demonstrates that you are not just building a product, but building a company. It shifts the conversation from “What are you building?” to “How well can you build it?”
🔄 Continuous Improvement Loops
Scalability is not a destination; it is a continuous process. The metrics discussed here are not static. They must be reviewed and adjusted as the organization matures.
Quarterly Review Cadence:
- Review velocity trends against financial burn rates.
- Assess if the current estimation model is still valid.
- Check if new hires are impacting the team average negatively.
- Evaluate if the definition of “Done” is still appropriate.
By maintaining a rigorous review cadence, you ensure that the metrics remain relevant. This discipline is exactly what venture capitalists look for in a management team.
🎯 Final Thoughts on Metrics
Velocity metrics are a tool for clarity, not a weapon for judgment. When used correctly, they provide a roadmap for sustainable growth. For venture capitalists, they serve as a proxy for the operational health of the company.
By focusing on stability, throughput, and cycle time, you demonstrate that your engineering organization is ready for the challenges of scaling. You show that you understand the complexities of software development and the realities of investor expectations.
The goal is not to achieve the highest possible number, but to achieve the most reliable possible outcome. In the world of venture capital, reliability is the most valuable currency of all.
Keep your data honest, your processes transparent, and your focus on value delivery. This approach will build trust with investors and create a foundation for long-term success.