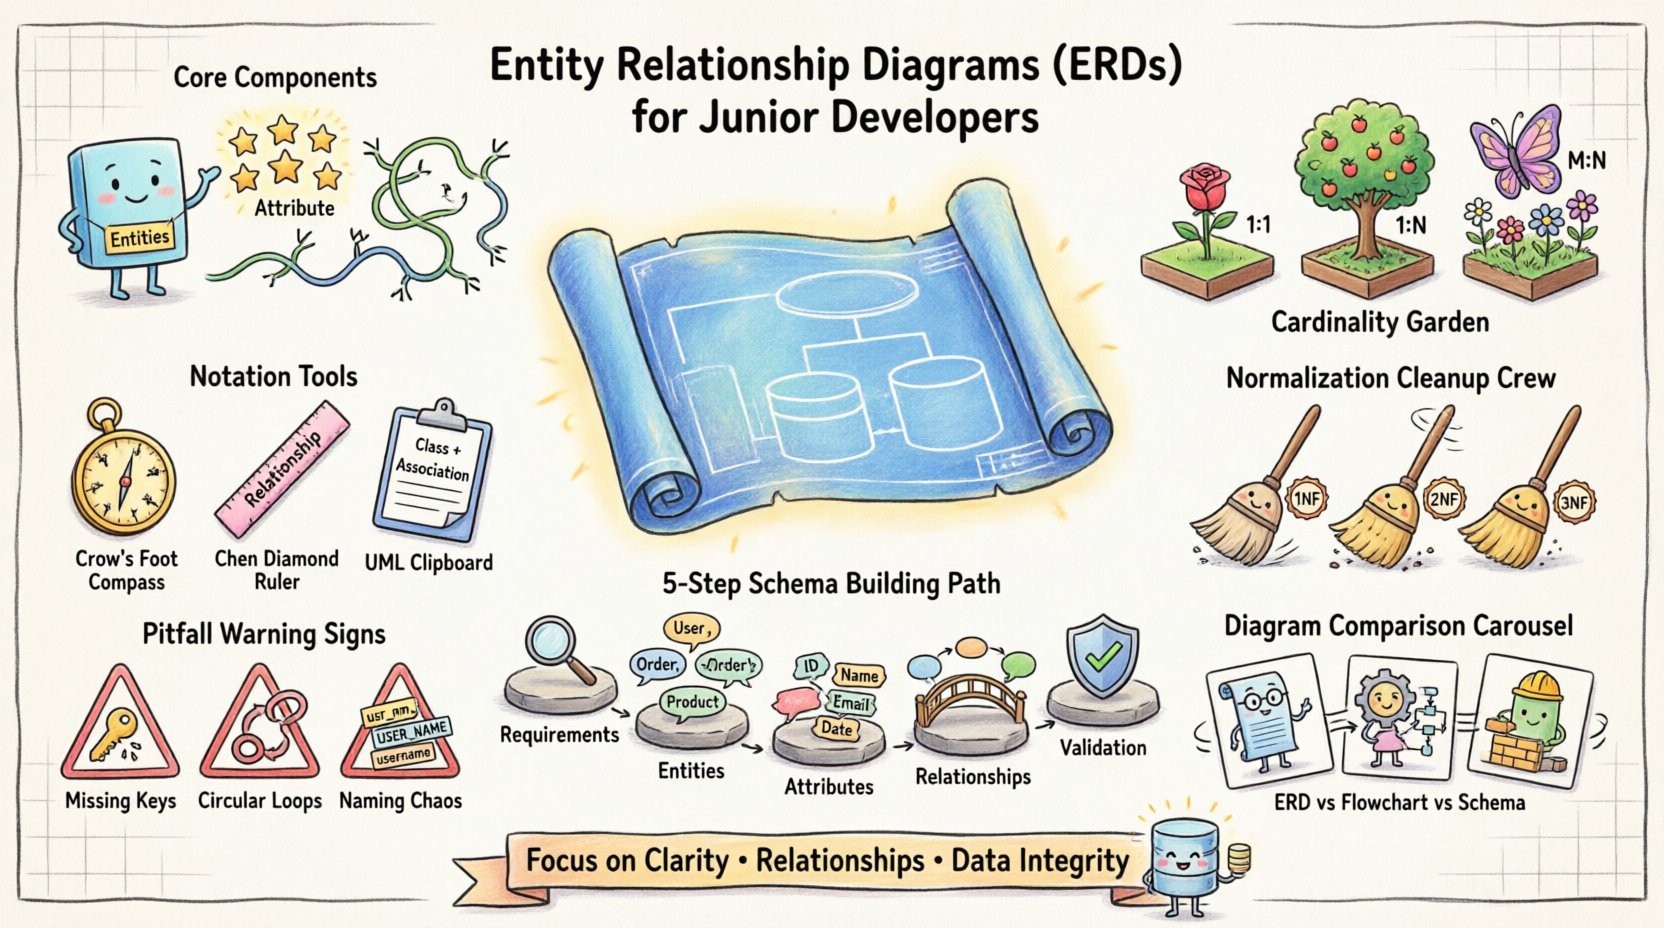
When building a software application, the foundation is rarely the user interface. It is the data. How you structure, relate, and store information dictates the performance, scalability, and maintainability of the entire system. At the heart of this structural planning lies the Entity Relationship Diagram, or ERD. For junior developers and database administrators, understanding this diagram is not optional; it is a fundamental skill.
An ERD is a visual representation of the data requirements for a system. It maps out the entities (tables), the attributes (columns), and the relationships (links) between them. This guide provides a comprehensive look at what an ERD is, how to read it, and how to design one effectively without relying on hype or marketing fluff.
The Core Components of an ERD 🔨
To understand the diagram, you must first understand the vocabulary. Every ERD is constructed from three primary building blocks. If you miss one, the structure becomes unstable.
- Entities: These represent the objects or concepts you are tracking. In a database context, an entity usually translates directly to a table. Examples include “Customer,” “Product,” or “Order.” Entities are typically drawn as rectangles.
- Attributes: These are the properties that describe an entity. They become the columns within a table. For a “Customer” entity, attributes might be “FirstName,” “LastName,” and “Email.” Attributes are often listed inside the rectangle or connected to it.
- Relationships: This is the most critical part. Relationships define how entities interact with one another. They establish the rules for data integrity. Relationships are represented by lines connecting the entities. These lines often carry labels indicating the type of connection.
Consider a simple scenario: An online store. You need to track items and people. Without relationships, your data is isolated. A customer record tells you nothing about what they bought. An order record tells you nothing about who placed it. The ERD bridges this gap.
Understanding Cardinality 🔄
Cardinality is the measure of how many instances of one entity relate to instances of another entity. It answers the question: “How many?” This is the logic engine behind your database constraints.
There are three main types of cardinality you will encounter in almost every diagram:
- One-to-One (1:1): A single instance of Entity A relates to exactly one instance of Entity B. Example: A person has one passport. A passport belongs to one person. This is less common in general applications but frequent in security or sensitive data separation.
- One-to-Many (1:M): A single instance of Entity A relates to many instances of Entity B. Example: One customer can place many orders. One order belongs to one customer. This is the most common relationship type in web applications.
- Many-to-Many (M:N): Many instances of Entity A relate to many instances of Entity B. Example: Many students can enroll in many courses. Many courses can have many students. This requires a junction table to resolve in a physical database.
Visualizing these relationships correctly prevents data duplication and query errors later. If you model a Many-to-Many relationship incorrectly as a One-to-Many, you will end up with redundant data or broken foreign key constraints.
Cardinality Reference Table
| Relationship Type | Real-World Example | Database Implementation |
|---|---|---|
| One-to-One (1:1) | Employee to ID Card | Foreign Key in one table |
| One-to-Many (1:M) | Department to Employees | Foreign Key in the “Many” table |
| Many-to-Many (M:N) | Authors to Books | Junction Table with two Foreign Keys |
Notation Standards 📐
Just as code has syntax, diagrams have notation. Different teams and tools may use different symbols to represent the same concepts. Knowing the common standards ensures you can collaborate effectively.
- Crow’s Foot Notation: This is the industry standard for most modern database tools. It uses lines and specific symbols at the ends of the relationships to indicate cardinality. A single line represents “one,” while a three-pronged symbol (resembling a crow’s foot) represents “many.”
- Chen Notation: This is an older style often used in academic settings. It uses diamonds to represent relationships and ellipses for attributes. It is less common in industry tools but still valuable to recognize in legacy documentation.
- UML Class Diagrams: Unified Modeling Language diagrams are used in software engineering. They are similar to ERDs but focus more on code structure than data storage. They include visibility symbols (+, -, #) which are less relevant for pure database design.
When starting a new project, agree on the notation early. Mixing styles can lead to confusion during code reviews or team handovers.
The Normalization Connection 🧹
Designing an ERD is not just about drawing boxes and lines. It is about organizing data to reduce redundancy and improve integrity. This process is called normalization. While you do not draw normalization rules on the diagram, the ERD reflects the outcome of these rules.
Here is a quick breakdown of the first three normal forms:
- First Normal Form (1NF): Ensure every column contains atomic values. Do not store lists in a single cell. Every record must be unique.
- Second Normal Form (2NF): Must be in 1NF. All non-key attributes must be fully dependent on the primary key. This prevents partial dependencies.
- Third Normal Form (3NF): Must be in 2NF. There should be no transitive dependencies. Non-key attributes should not depend on other non-key attributes.
If your ERD shows a “User” table with columns for “User_Name,” “User_Email,” and “Department_Name,” you might be violating 3NF. The department name depends on the department ID, not the user directly. You should create a separate “Department” entity and link them.
Creating a Schema from Scratch 🛠️
How do you move from a blank page to a structured diagram? Follow this logical progression to ensure nothing is missed.
1. Gather Requirements
Before drawing a single line, talk to the stakeholders. What data must be stored? What questions will users ask? If you need to report on “Total Sales per Region,” you need a “Region” entity and a “Sales” entity linked together.
2. Identify Entities
List every noun that represents a distinct object. Filter out adjectives or verbs. “Place Order” is a process, not an entity. “Order” is the entity.
3. Define Attributes
Assign properties to each entity. Decide which attributes are identifiers. A Primary Key (PK) is mandatory for every table to ensure uniqueness. A Foreign Key (FK) is required to establish relationships.
4. Establish Relationships
Draw the lines. Determine the cardinality. Decide if the relationship is mandatory or optional. For example, can an Order exist without a Customer? Usually no. Can a Product exist without a Category? Possibly, if you allow uncategorized items.
5. Validate the Model
Walk through the data flow. If a user signs up, where does the data go? If a user deletes an account, what happens to their orders? Does the diagram support these actions without data loss?
Common Pitfalls ⚠️
Even experienced engineers make mistakes. Being aware of common errors can save you significant refactoring time later.
- Missing Foreign Keys: Drawing a line on paper is easy. Implementing the constraint in code is harder. Ensure every line in your ERD has a corresponding database constraint.
- Circular Dependencies: Avoid chains where A links to B, B links to C, and C links back to A. This can cause infinite loops in queries and make data deletion difficult.
- Inconsistent Naming: Do not mix “User_ID” and “UserID.” Stick to a consistent convention. Underscores are standard for database columns, while camelCase is common in code.
- Over-Normalization: While normalization is good, too much of it can make queries slow. Denormalize strategically when read performance is more critical than write performance.
- Ignoring Data Types: An ERD is not just structure; it is data. A “Date” field is not the same as a “String.” Ensure the diagram implies the correct storage types.
ERD vs. Other Diagrams 🆚
It is easy to confuse ERDs with other technical diagrams. Knowing the difference ensures you use the right tool for the job.
- Flowcharts: These show the flow of logic or control. They use diamonds for decisions and rectangles for processes. They do not show data structure.
- Schema Diagrams: These are often the result of generating a diagram from an existing database. They are the physical implementation, often showing indexes and specific data types.
- Conceptual Models: These are high-level ERDs. They focus on business concepts rather than technical implementation details like data types or table names.
Use the ERD for the logical design phase. Use the Schema Diagram for the physical implementation phase.
Maintenance and Evolution 🔄
A database is not a one-time project. It evolves as the business changes. Your ERD must evolve with it.
- Version Control: Treat your diagrams like code. Save them in a repository. Track changes. If you add a column, document why.
- Documentation: The diagram is a visual aid, but comments explain the context. Add notes about complex logic or specific constraints.
- Review Cycles: Schedule regular reviews of the data model. Old assumptions may no longer hold true. A field that was “Optional” five years ago might be “Required” now.
Final Thoughts on Data Integrity ✅
The Entity Relationship Diagram is the blueprint of your data infrastructure. It is where you decide how information connects before you write a single line of SQL. A well-designed ERD leads to faster queries, easier maintenance, and fewer bugs.
For junior developers, investing time in learning this skill pays dividends. It shifts your perspective from writing isolated queries to designing cohesive systems. For DBAs, it is the primary tool for auditing and optimizing the underlying storage.
Focus on clarity. Focus on relationships. Focus on the rules that keep your data honest. That is the essence of database design.
Start by sketching your next project on paper. Identify the entities. Map the connections. Check your cardinality. If the diagram makes sense, the database will follow suit.