


Every business runs on data. Whether you are managing inventory, tracking customer relationships, or analyzing sales trends, information is the backbone of decision-making. However, when technical teams discuss how that data is stored and connected, the conversation often shifts into a language of acronyms, symbols, and abstract concepts. One of the most common tools you will encounter in this space is the Entity-Relationship Diagram, or ERD.
For those without a background in computer science or information technology, an ERD can look like a cryptic map. It uses boxes, lines, and strange shapes that seem to belong to a different world. The good news is that you do not need to become a database architect to understand what these diagrams represent. Understanding the underlying structure allows you to communicate more effectively with technical teams, identify potential issues before they arise, and ensure that the systems built align with actual business needs.
This guide breaks down the Entity-Relationship Diagram into plain language. We will explore the core components, explain the relationships between data points, and discuss why this visual representation matters for your organization. By the end, you will be able to look at a complex data model and understand the story it tells about your business operations.
🧩 What Exactly is an ERD?
An Entity-Relationship Diagram is a visual representation of how data is organized within a system. Think of it as an architectural blueprint for a building, but instead of walls and doors, it maps out tables and connections. It defines the structure of a database without specifying the actual data values.
When developers or data analysts create an ERD, they are essentially drawing a plan. They decide what information needs to be stored, how that information is grouped, and how different pieces of information relate to one another. This planning phase is critical. If the foundation is flawed, the entire system can become slow, inefficient, or prone to errors. For a non-technical stakeholder, understanding this blueprint helps you verify that the proposed solution matches the way your business actually works.
🔑 The Three Pillars of an ERD
To read an ERD effectively, you need to recognize the three main building blocks used to construct it. These elements appear repeatedly across almost every diagram you will encounter.
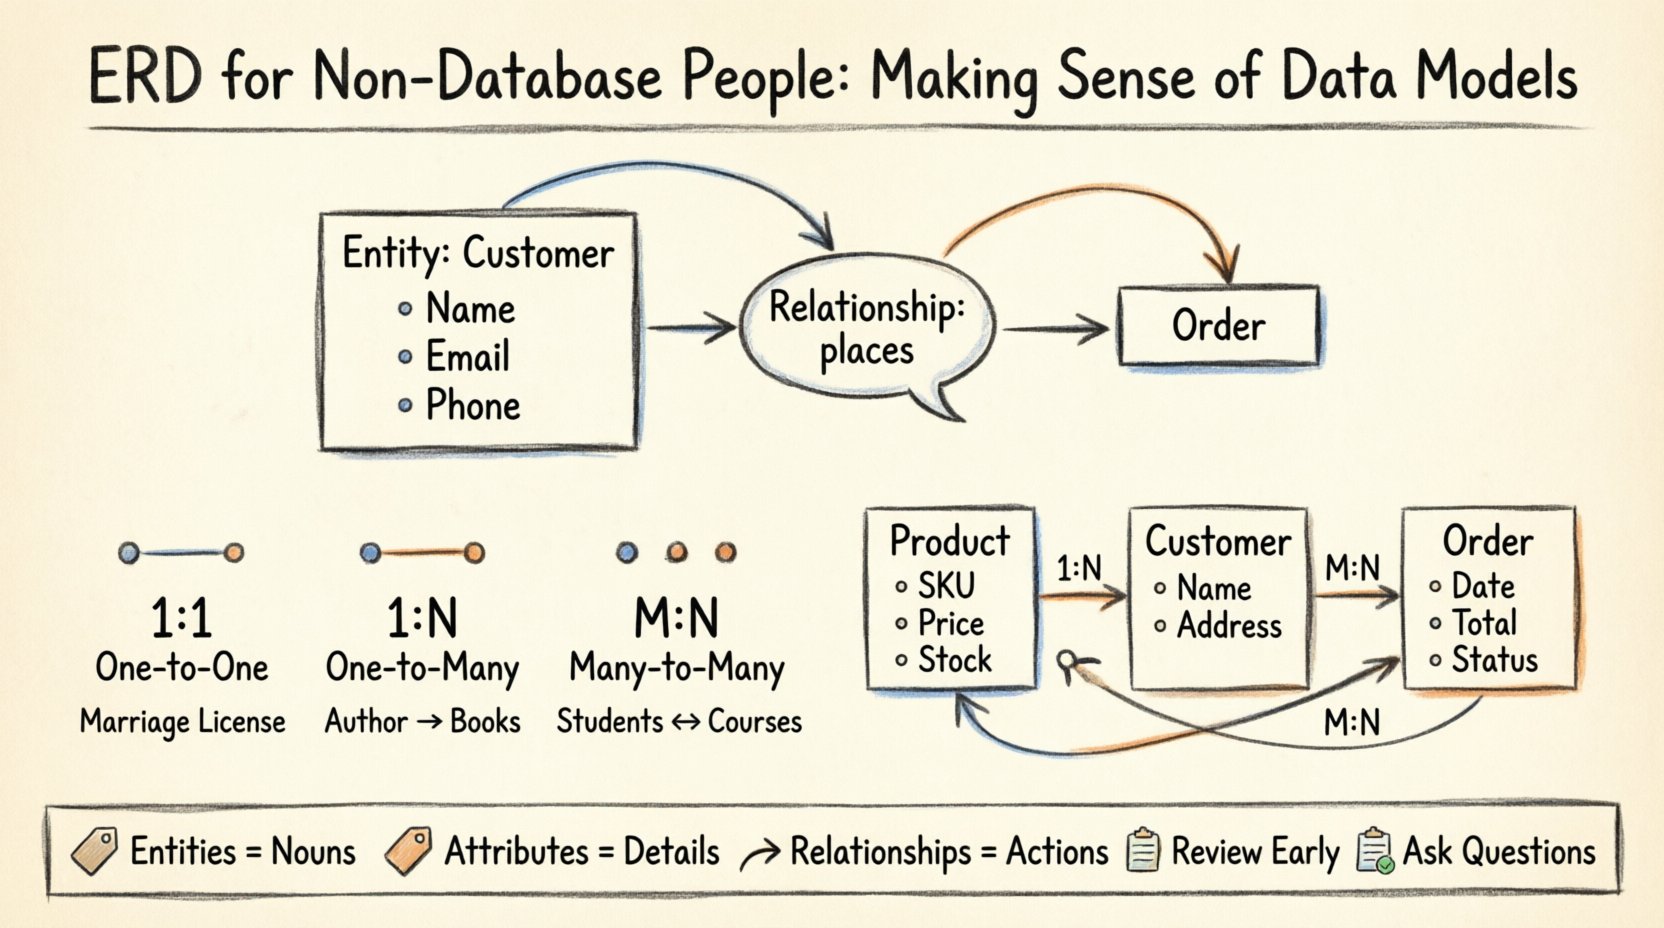
- Entities: These are the objects or concepts you are tracking. In a business context, an entity could be a “Customer,” a “Product,” an “Order,” or a “Supplier.” In the diagram, entities are typically represented by rectangles. They act as containers for information.
- Attributes: These are the specific details that describe an entity. If “Customer” is the entity, attributes might include “Name,” “Email Address,” “Phone Number,” or “Billing Address.” Attributes are usually listed inside the entity box or connected to it with lines.
- Relationships: This is the most crucial part for understanding data flow. Relationships show how entities interact with each other. For example, a “Customer” places an “Order.” This connection defines how many orders a single customer can make and how that data is linked.
Visualizing these components helps separate the “what” (the entity) from the “how many” (the relationship). When you look at a diagram, start by identifying the boxes (entities), then read the text inside them (attributes), and finally trace the lines connecting them (relationships).
📐 Understanding Cardinality and Notation
One of the most confusing aspects of ERDs for beginners is the notation used to connect entities. This notation is called cardinality. It defines the mathematical relationship between two entities. It answers the question: “How many instances of Entity A can relate to how many instances of Entity B?”
While there are various styles of drawing these connections, the most common approach uses specific symbols at the ends of the connecting lines. These symbols indicate the limits of the relationship.
Common Relationship Types
There are three primary types of relationships you will see in almost every data model. Understanding these is key to interpreting the logic of the system.
| Relationship Type | Description | Real-World Example |
|---|---|---|
| One-to-One (1:1) | One record in Table A relates to exactly one record in Table B. | One Employee has one Badge ID. |
| One-to-Many (1:N) | One record in Table A relates to many records in Table B. | One Department employs Many Employees. |
| Many-to-Many (M:N) | Many records in Table A relate to many records in Table B. | Many Students enroll in Many Courses. |
Let’s look deeper into how these work in practice. In a One-to-Many relationship, the “One” side is the parent, and the “Many” side is the child. This creates a hierarchy. For instance, a single Invoice can have multiple Line Items. You cannot have a Line Item without an Invoice. This ensures data integrity; you do not want orphaned data floating around without context.
The Many-to-Many relationship is often the trickiest. In a strict database structure, a direct Many-to-Many link is usually resolved by creating a third table, often called a junction or linking table. This table breaks the relationship into two One-to-Many connections. If you see this in a diagram, look for that middle table. It holds the foreign keys that link the two main entities together.
🏗️ Building a Mental Model: The E-Commerce Example
To make this concrete, let’s apply these concepts to a familiar scenario: an online store. Imagine you are reviewing the data model for this store’s backend system. You want to ensure the system can handle the business logic correctly.
1. The Product Entity
First, you see a box labeled “Product.” Inside, you see attributes like “SKU,” “Price,” “Description,” and “Stock Level.” This represents the core items you sell. Every time a user views a page, they are interacting with this entity.
2. The Customer Entity
Next, there is a “Customer” box. Attributes here might include “First Name,” “Last Name,” “Shipping Address,” and “Credit Card Token.” This tracks who is buying the items.
3. The Order Entity
Then, you see an “Order” box. This connects the Customer and the Products. An Order contains the “Order Date,” “Total Amount,” and “Status.” This is the transactional record.
4. The Relationships
Now, look at the lines connecting these boxes. The line between “Customer” and “Order” represents a One-to-Many relationship. One customer can place many orders over time, but a single order belongs to only one customer. The line between “Order” and “Product” represents a Many-to-Many relationship. An order contains many products, and a product can appear in many orders.
By tracing these lines, you can verify if the system supports your business rules. For example, if your business allows a customer to have multiple billing addresses, you would expect to see an additional relationship or attribute linking the Customer to multiple addresses. If the diagram shows only a single address field on the Customer entity, you might need to discuss a potential limitation with the technical team.
🧠 Why This Matters for Business Stakeholders
You might wonder why a non-technical person needs to spend time learning about data models. The answer lies in risk management and efficiency. When you understand the ERD, you can spot logical errors early in the planning phase. Catching a mistake during the diagram stage is significantly cheaper and faster than fixing it after the software has been built and deployed.
- Better Communication: Instead of saying “I need to track where this item goes,” you can say “I need a relationship between the Product and the Warehouse Location.” This precision reduces back-and-forth clarification.
- Scope Control: When new features are requested, you can look at the diagram and see if the current structure supports the new requirement. If not, you know immediately that a structural change is needed, not just a cosmetic update.
- Data Governance: Understanding entities helps you define data ownership. If “Customer” is a central entity, who is responsible for its accuracy? The ERD highlights the core data assets of the company.
- Integration Planning: When connecting two different systems, you need to know how the data maps. An ERD provides the map for integration. You can see which fields must match between systems to ensure data flows correctly.
⚠️ Common Pitfalls to Watch For
Even with a clear understanding of the basics, diagrams can contain traps. As a business stakeholder, keeping an eye out for these common issues can save your project from significant headaches later.
- Missing Attributes: Sometimes, the diagram shows the entities and relationships but leaves out critical attributes. For example, an “Order” entity might be missing a “Shipping Method” attribute. This omission often leads to workarounds later in the development process.
- Incorrect Cardinality: A One-to-Many relationship might be drawn as One-to-One by mistake. This would prevent the system from handling multiple instances of a child record, which could break functionality.
- Redundant Data: If the same information is stored in multiple places without a clear link, the data becomes inconsistent. If you update a phone number in one place but not the other, the system shows conflicting information.
- Complexity Overload: Some diagrams become so complex with too many entities that they are unreadable. A good model simplifies data into logical groups. If a box contains fifty attributes, it might be better to split it into two related entities.
🤝 Collaborating with Technical Teams
Once you understand the diagram, your role shifts to collaboration. You are no longer just a passive observer; you are a validator. Here is how to engage with the database architects and developers effectively.
- Ask for the Story: Don’t just ask “Is this right?” Ask “Can you walk me through how a customer transaction flows through this model?” This forces the team to explain the logic, revealing gaps in understanding.
- Focus on Edge Cases: Technical teams often design for the happy path (normal usage). Ask about the edge cases. “What happens if a customer cancels an order? Does the data stay? Does it get archived?” These scenarios often require specific relationships or flags in the model.
- Review the Keys: Every entity should have a unique identifier, often called a Primary Key. Ensure the team has defined how each record is uniquely identified. This is crucial for data integrity and preventing duplicate records.
- Validate Naming Conventions: While you don’t need to name the fields, ensure the names are clear. “tbl_cust_01” is less readable than “Customers.” Clear naming reduces confusion for everyone involved.
🛠️ Tools and Visualization
While we are not discussing specific software products, it is worth noting that ERDs are created using specialized tools. These tools allow teams to draw the boxes and lines, validate the logic, and even generate the database code automatically. When reviewing a diagram, pay attention to how it was created. Hand-drawn sketches are great for brainstorming but often lack the precision needed for implementation. Computer-generated diagrams are more reliable for technical accuracy.
When a diagram is shared with you, ensure it is the latest version. Data models evolve. As business requirements change, the ERD must change with them. Relying on an old version of a diagram can lead to building features on outdated assumptions.
📉 The Cost of Ignorance
Ignoring the data model is a common strategy, often driven by the belief that it is too complex to understand. However, this approach carries a hidden cost. When business requirements are not aligned with the data structure, the result is often “technical debt.” This is a metaphorical debt where the system becomes harder to maintain over time. Every time a new feature is added, developers must work around the existing structure, slowing down progress and increasing the risk of bugs.
Investing time in understanding the ERD is an investment in the longevity of the system. It empowers you to make informed decisions about what data is collected and how it is used. It ensures that the digital infrastructure supports the strategic goals of the organization, rather than hindering them.
🎓 Key Takeaways for Success
To wrap up, here are the essential points to remember when dealing with Entity-Relationship Diagrams:
- Entities are Nouns: Identify the main objects in your business (Customers, Orders, Products).
- Attributes are Adjectives: Identify the details describing those objects (Name, Price, Status).
- Relationships are Verbs: Identify how the objects interact (Buys, Sells, Contains).
- Cardinality Defines Limits: Understand if the relationship is One-to-One, One-to-Many, or Many-to-Many.
- Review Early: Catching errors in the diagram phase is much easier than fixing them in the code.
- Ask Questions: If a connection seems unclear, ask for clarification. Do not assume you understand.
Data is the lifeblood of modern business. By demystifying the Entity-Relationship Diagram, you ensure that this lifeblood flows smoothly through your organization. You do not need to write the code or design the tables, but you do need to understand the map. With this knowledge, you can contribute to the creation of systems that are robust, scalable, and aligned with your strategic vision.
Start by looking at the next diagram you receive. Find the boxes. Trace the lines. Ask the questions. You are closer to mastering the language of data than you might think.