


In software architecture, visualizing data is as critical as writing the code itself. While class diagrams provide the blueprint, they often fail to show what happens when the system is running. This is where the object diagram becomes indispensable. It captures a snapshot of the system at a specific moment, revealing the actual state of data and how instances connect. Creating a diagram that truly reflects reality requires precision. Vague representations lead to miscommunication between developers, stakeholders, and testers. This guide outlines the principles necessary to construct object diagrams that serve as reliable documentation and planning tools.
🔍 Understanding the Object Diagram
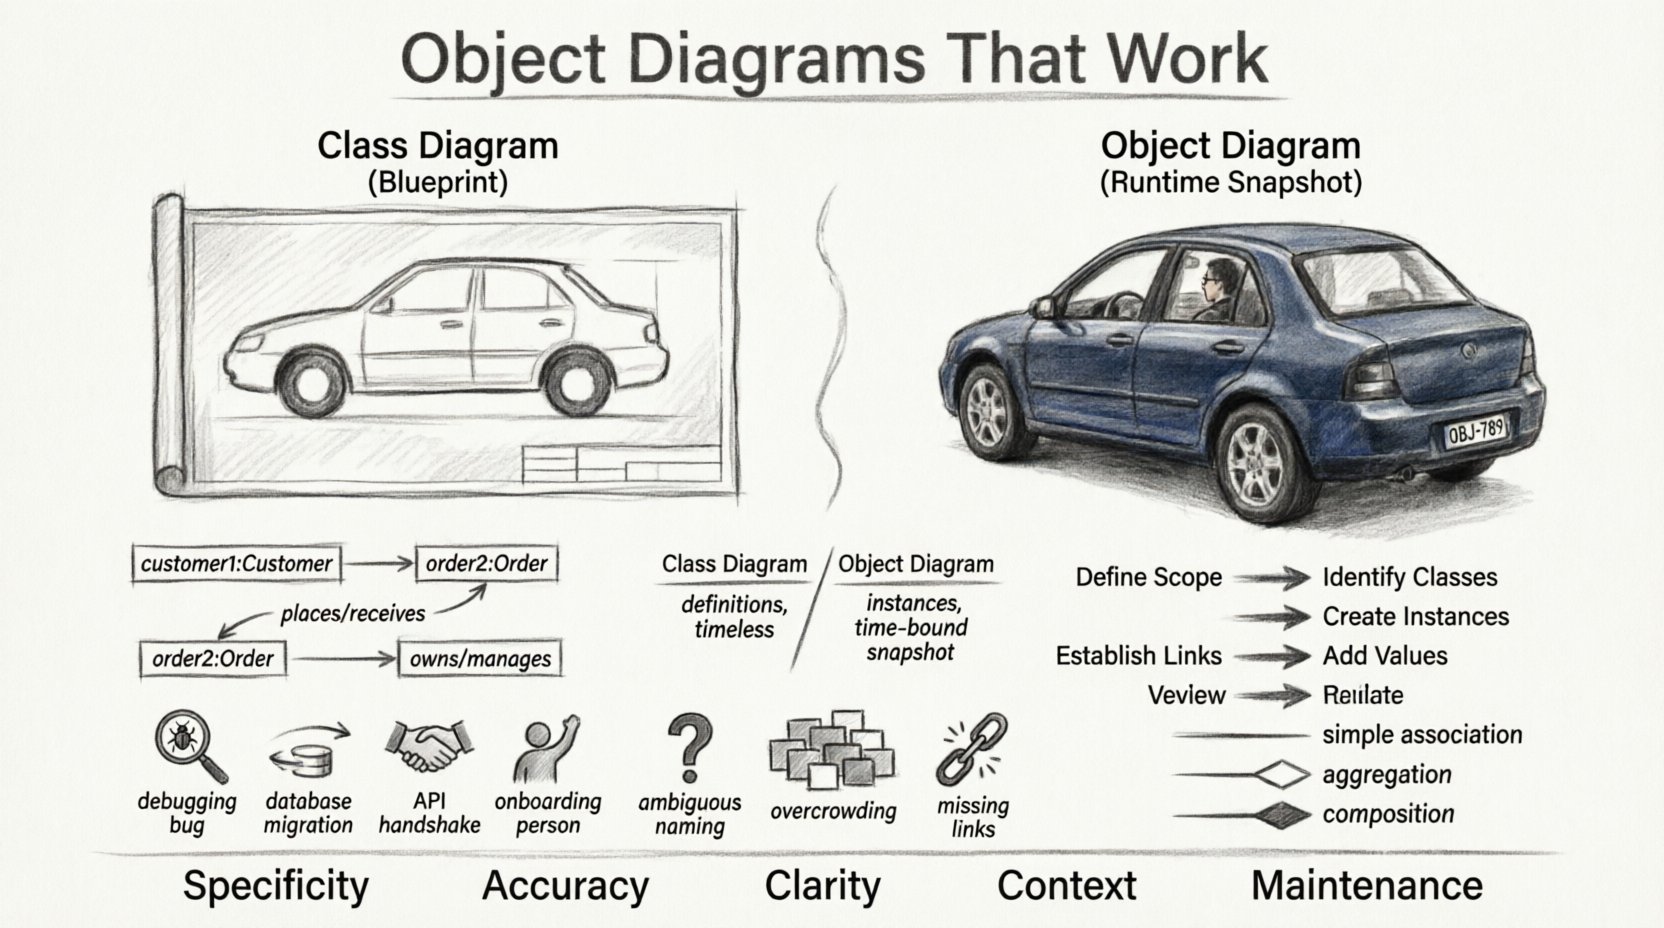
An object diagram is a static view of a system that focuses on instances rather than definitions. In the Unified Modeling Language (UML), this is often referred to as an instance diagram. It complements the class diagram by showing specific data populated within the structures defined by the classes. Think of a class diagram as a factory blueprint. It tells you what a car looks like, how many wheels it has, and what parts it contains. The object diagram is the car sitting on the assembly line. It is the specific instance with a license plate, a specific color, and a specific driver.
Why does this distinction matter? When debugging complex logic, knowing the class structure is not enough. You need to know how data flows between specific objects. If a database query fails, understanding the relationships between the actual rows (objects) helps identify constraints that the generic schema might hide. Accuracy here means representing the exact relationships and multiplicities that exist at runtime.
🧩 Anatomy of an Accurate Object Diagram
To ensure clarity, every element within the diagram must serve a purpose. Extraneous lines or labels confuse the reader. A well-constructed diagram adheres to standard conventions while remaining flexible enough to show unique system states.
1. Instances and Naming Conventions
Each box in the diagram represents an instance of a class. To maintain clarity, the naming convention must be consistent. Typically, an instance is named using the pattern instanceName:ClassName. For example, customer1:Customer or order7:Order.
- Instance Name: Often italicized to distinguish it from the class name.
- Class Name: Always capitalized, appearing after the colon.
- State: Some diagrams include state information within the box, showing property values like
status: "Active".
2. Links and Relationships
Links connect instances. They represent the association between two objects. Unlike class diagrams, which show potential relationships, object diagrams show active connections.
- Directionality: Arrows indicate navigability. If object A can access object B, the arrow points from A to B.
- Role Names: Labels on the link describe the relationship from the perspective of the connected objects (e.g., “places” vs “receives”).
- Multiplicity: While often implied by the presence of the link, it helps to verify that the number of connected objects matches the defined constraints (e.g., one-to-many).
3. Comparing Class vs. Object Diagrams
Understanding the difference is the first step toward accuracy. The table below highlights the key distinctions.
| Feature | Class Diagram | Object Diagram |
|---|---|---|
| Focus | Static structure and definitions | Runtime state and instances |
| Content | Classes, Attributes, Operations | Objects, Values, Links |
| Timeframe | General (Timeless) | Specific Snapshot (Time-bound) |
| Utility | Design and Planning | Debugging, Testing, Validation |
| Example | User: class |
john_doe: User |
📅 When to Deploy Object Diagrams
Not every project requires an object diagram for every component. Overusing them can clutter documentation. Use them strategically in scenarios where understanding the data state is paramount.
✅ Recommended Use Cases
- Debugging Complex Interactions: When a bug occurs, drawing the state of objects at the moment of failure helps trace the error source.
- Data Migration Planning: Visualizing how data moves from one system to another ensures no relationships are broken during the transfer.
- Database Schema Validation: Ensuring that the actual data structure matches the theoretical model before deployment.
- API Contract Verification: Showing how client requests map to server-side objects.
- Onboarding New Developers: Providing a concrete example of how the system looks in action, rather than just abstract definitions.
❌ When to Avoid
- High-Level Architecture: For executive summaries, a class diagram or component diagram is often sufficient.
- Frequently Changing Systems: If the data structure changes hourly, the diagram becomes stale quickly.
- Simple Systems: If the system has only a few classes, a single diagram might not be necessary.
⚠️ Common Pitfalls and How to Avoid Them
Even experienced modelers make mistakes. These errors reduce the utility of the diagram and can lead to implementation issues. Identifying these patterns early ensures the documentation remains trustworthy.
1. Ambiguous Naming
Using generic names like obj1 or item2 provides no context. If a developer sees item2, they do not know what kind of item it is.
- Solution: Use descriptive names that indicate the role of the object, such as
pendingOrder: Order.
2. Ignoring Multiplicity
Showing a link between two objects implies a relationship exists. However, if the model dictates a 1-to-1 relationship, but the diagram shows multiple instances linked to one, the diagram is inaccurate.
- Solution: Cross-reference the object diagram with the class diagram to ensure multiplicity constraints are respected.
3. Overcrowding the Visual Space
Trying to show the entire database state in one image makes the diagram unreadable. It becomes a wall of boxes and lines.
- Solution: Focus on a specific context. Create multiple object diagrams for different scenarios (e.g., “User Login Flow” vs. “Order Processing Flow”).
4. Missing Links
Objects that are logically connected in code are not linked in the diagram. This hides dependencies and makes the system appear decoupled when it is not.
- Solution: Review the code or logic flow to ensure all active dependencies are represented visually.
5. Static vs. Dynamic Confusion
Object diagrams are static snapshots. They do not show movement or logic flow. Confusing them with sequence diagrams leads to expectations about behavior that the object diagram does not support.
- Solution: Clearly label the diagram as a snapshot of state. Use sequence diagrams to show the flow of events.
🛠️ Building Accurate Diagrams Step-by-Step
Creating a diagram that holds up to scrutiny requires a disciplined approach. Follow this workflow to ensure consistency and accuracy.
- Define the Scope: Decide what part of the system you are modeling. Is it a specific user session? A transaction? A batch process?
- Identify the Classes: Look at the class diagram. Select the classes relevant to your scope.
- Create Instances: Instantiate objects based on real data or expected scenarios. Assign clear names.
- Establish Links: Draw connections between objects. Ensure the direction of the link matches the navigation path in the code.
- Add State Values: If relevant, add property values to the objects (e.g.,
balance: 500.00). This adds significant clarity. - Review Constraints: Check multiplicity and cardinality. Does the link count match the allowed limits?
- Validate with Stakeholders: Have a developer or tester review the diagram. Does it match their mental model of the system?
🔗 Relationships and Links in Detail
The links in an object diagram are more than just lines. They represent data integrity and referential integrity. Understanding how to represent them correctly is crucial.
Association Links
These represent the most basic connection. For example, a Customer object is linked to an Order object. The link shows that the customer owns the order.
- Labeling: Use role names like “owns” or “purchases” on the line.
- Visibility: Ensure the link is visible and not hidden behind other boxes.
Aggregation and Composition
These represent stronger forms of association. Composition implies that the child object cannot exist without the parent.
- Visual Cue: Often denoted by a filled diamond on the parent side.
- Implication: If the parent object is deleted, the child object is deleted as well.
Inheritance
Object diagrams can show inheritance, though it is less common than in class diagrams. If an object is an instance of a subclass, it inherits properties from the superclass.
- Clarity: It is often clearer to simply label the object with its specific class name rather than drawing inheritance lines, as the instance belongs to the specific class.
🔄 Maintenance and Evolution
A diagram that is not maintained is a liability. As the codebase evolves, the diagram must evolve with it. Neglecting this leads to documentation debt.
Version Control
Treat your diagrams as code. Store them in the same repository. This allows you to track changes over time and see how the data model has shifted.
Automation
Where possible, generate diagrams from code or database schemas. Manual drawing is prone to human error. Automated generation ensures the diagram reflects the current state of the system.
Regular Audits
Schedule periodic reviews. During sprint retrospectives, ask: “Does our documentation match the code we just wrote?” If discrepancies exist, update the diagram immediately.
🎨 Visual Best Practices
Visual design impacts readability. Even without CSS, the structure of the HTML and the arrangement of elements matter.
- Spacing: Leave enough white space between objects. Crowded diagrams are hard to parse.
- Alignment: Align related objects in a logical flow (e.g., left to right for data flow).
- Consistency: Use the same font size, line thickness, and box shapes throughout the document.
- Color (If Supported): If your tool allows color, use it to group related objects or highlight critical paths. However, ensure the diagram remains readable in black and white.
🧪 Testing the Diagram
Before finalizing the diagram, treat it as a test case. Walk through the scenario it represents.
- Trace the Flow: Start at one object and follow the links. Can you reach every necessary component?
- Check Data Types: Do the linked objects have compatible data types? (e.g., a string linked to an integer).
- Verify Nullability: Are optional links shown correctly? If a link is optional, ensure the diagram reflects that the connection might not exist.
📈 Impact on Development Workflow
When object diagrams are accurate, the development process becomes smoother. Teams spend less time guessing how data structures interact.
- Reduced Miscommunication: Developers and designers share a common visual reference.
- Faster Onboarding: New team members can grasp the data model quickly.
- Better Testing: QA engineers can create test cases based on the specific object states shown in the diagram.
- Improved Refactoring: Understanding dependencies helps in safely modifying code without breaking relationships.
📝 Summary of Key Principles
To summarize, creating effective object diagrams requires attention to detail and adherence to standard practices. Focus on the following core tenets:
- Specificity: Show actual instances, not just classes.
- Accuracy: Ensure links and multiplicities match the code.
- Clarity: Use clear naming and spacing.
- Context: Limit the scope to a manageable scenario.
- Maintenance: Keep the documentation synchronized with the code.
By following these guidelines, you create a resource that stands the test of time. The diagram becomes a living part of the project, guiding decisions and preventing errors. In the complex landscape of software development, clarity is a competitive advantage. Object diagrams, when done right, provide that clarity.
🚀 Next Steps
Start by selecting a small module in your current project. Draft an object diagram for a specific transaction. Compare it against the actual runtime data. Identify the gaps. Adjust the diagram. Repeat. Over time, this practice builds a robust visual vocabulary for your team. The effort invested in accurate modeling pays dividends in reduced bugs and improved system understanding.