Automating Library Management Models: Generate Professional ERDs with Visual Paradigm AI

Learn how to generate Entity Relationship Diagrams from text using Visual Paradigm AI. Automate your database design and library management models today.

Are you ready to revolutionize your database design workflow? Creating a professional Entity Relationship Diagram used to involve hours of manual shape dragging and meticulous connection drawing. Not anymore! With the AI-powered ERD maker integrated directly into Visual Paradigm, you can generate Entity Relationship Diagram models from simple text descriptions in mere seconds. Whether you are building a complex library system or a high-traffic retail inventory, this easy-to-use diagramming tool uses advanced intelligence to handle the heavy lifting, allowing you to focus on high-level architecture rather than manual formatting!

Key Takeaways for AI-Powered Modeling

  • Instant Model Transformation: Turn natural language requirements into precise database schemas.

  • Standards-Compliant Notation: Automatically use the correct Crow’s Foot or IDEF1X notation for entities and relationships.

  • Rapid Exploration: Test different architectural scenarios by simply adjusting your text prompt.

  • Full Editability: Every generated element is a native Visual Paradigm object, ready for manual refinement.

The Core Workflow: How to Generate Entity Relationship Diagrams with AI

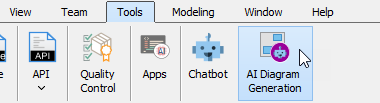
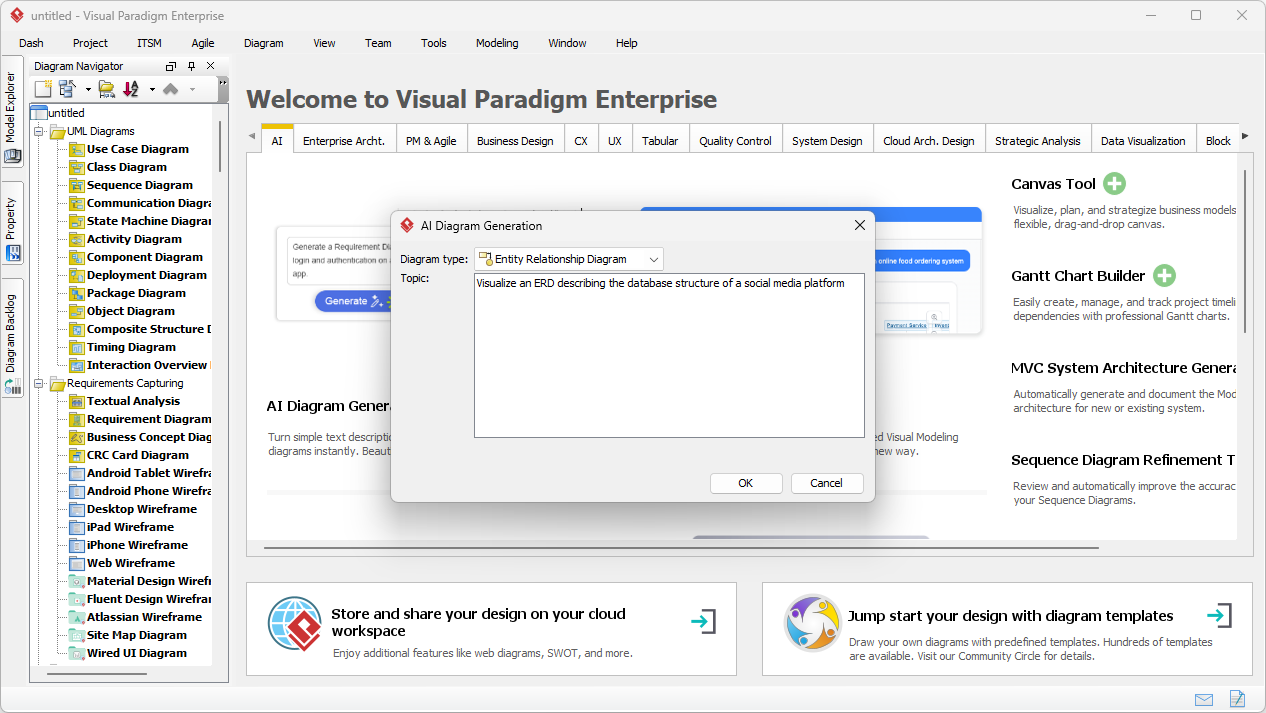
The journey to a perfect database model begins within the robust environment of Visual Paradigm Desktop. To initiate the magic, simply navigate to the main menu and select Tools > AI Diagram Generation. This opens a dedicated portal where your verbal descriptions are translated into structural blueprints. It is the ultimate starting point for any software engineer or data architect who values efficiency!

Gonna generate a Entity Relationship Diagram. Start by selecting Tools > AI Diagram Generation in Visual Paradigm Desktop - P

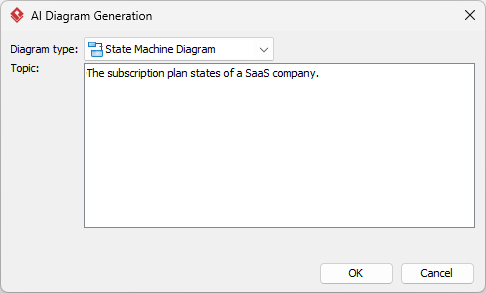
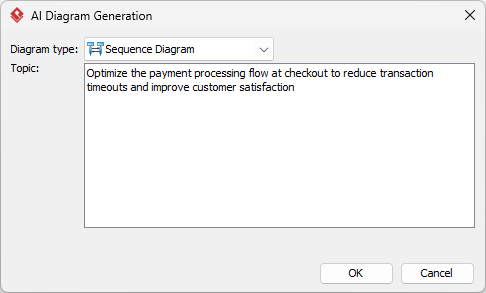
Once the generation window appears, you are presented with a streamlined interface designed for maximum productivity. First, ensure you have selected Entity Relationship Diagram from the Diagram Type dropdown menu. Next, enter your descriptive prompt into the Topic field. For our example, we provided a highly specific requirement: “A library management ERD that defines relationships between books, members, and loans.” This clarity allows the professional AI diagramming software to infer necessary entities like ISBNs, due dates, and membership types without further instruction!

Selected Entity Relationship Diagram as diagram type. Entered the topic:
A library management ERD that defines relationships

Analyzing the Intelligent Output

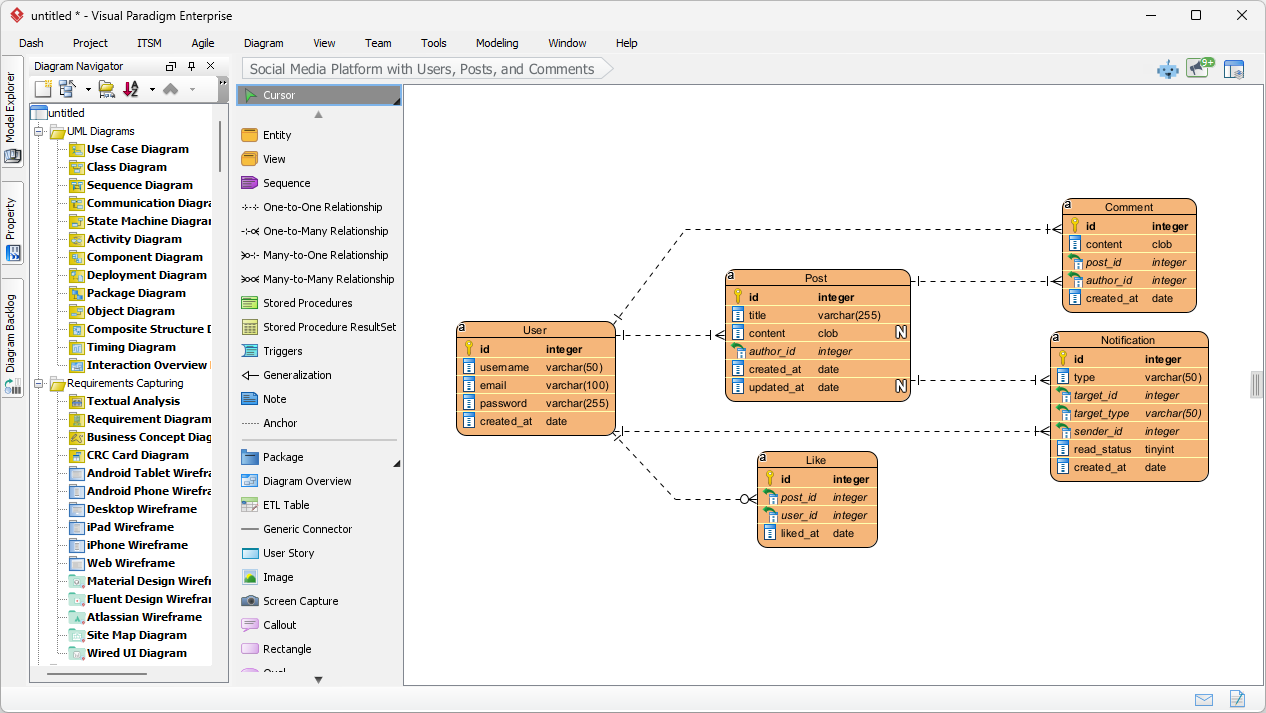
After clicking “OK,” the AI-powered design tool performs a deep analysis of your text and constructs a comprehensive model. In our library management scenario, the AI successfully identified and created entities such as CatalogEntry, Book, BookCopy, Member, and Loan. It even intelligently suggested supporting tables like Fine, Payment, Staff, and OverdueRecord to ensure a complete system logic. Every primary key, foreign key, and cardinality connection is placed with precision, providing a rock-solid foundation for your database documentation.

This is the Entity Relationship Diagram generated by AI - Professional online diagram maker tool

One of the most powerful aspects of this feature is that the result is not a static image, but a fully integrated and editable model. You can perform immediate “touch-ups” to tailor the diagram to your specific project needs. Whether you need to rename an attribute, add a new entity, or modify a relationship type—such as changing a connection to a One-to-One Relationship—the intuitive interface allows for seamless manual adjustments using the resource catalog and editor tools.

I can touch up the generated diagram by adding additional entities, renaming, etc - Professional online diagram maker tool

Conclusion: Elevate Your Design Strategy

By choosing to generate Entity Relationship Diagram models with Visual Paradigm’s cutting-edge AI, you are not just saving time; you are ensuring that your documentation follows industry best practices from the very first click. This professional AI-powered ERD tool bridges the gap between conceptual requirements and technical execution, making it the best easy-to-use software for modern development teams. Experience the future of visual modeling today and let your creativity lead the way!

Ready to transform your workflow?

Unlock the full potential of your design process by downloading the latest version of Visual Paradigm. Follow the link below to get started with the world’s most advanced AI diagramming application.

Download Visual Paradigm Desktop: https://www.visual-paradigm.com/download/

Related Links

Entity-Relationship Diagrams (ERD) are foundational tools for database design and data modeling, used to visualize the static structure of information systems by defining entities, attributes, and their interactions. Visual Paradigm provides an extensive suite of ERD tools—available both on desktop and in the cloud—that support various standards, including Chen notation, to facilitate precise schema development. Modern advancements in the platform now include AI-powered features that can instantly generate editable ERDs from natural language descriptions or through reverse engineering existing databases, significantly streamlining the implementation workflow.

  1. What is an Entity-Relationship Diagram (ERD)? – Visual Paradigm Guide: A comprehensive resource covering the components, notation, and significance of ERDs in modern database modeling.

  2. Visual Paradigm ERD Tool – Create Entity-Relationship Diagrams Online: Details on a powerful web-based editor designed for intuitive drag-and-drop design of complex database schemas.

  3. How to Model a Relational Database with ERD – Visual Paradigm Tutorial: A practical, step-by-step tutorial guiding users from conceptual data modeling to final implementation.

  4. Database Design with ERD Tools – Visual Paradigm Guide: Explores best practices for building scalable, robust databases and synchronizing models across different development stages.

  5. New Diagram Types Added to AI Diagram Generator: DFD & ERD: Information on the latest AI capabilities that enable users to create structured ERDs automatically from simple text prompts.

  6. Streamlining Entity-Relationship Modeling with Visual Paradigm: A detailed look at how to effectively move from initial data concepts to implementation using visual modeling tools.

Supercharge State Machine Diagram Creation with AI: The Modeling Subscription Plan State Transitions Example

You already know modeling state machine diagrams takes time – blank-page syndrome, numerous iterations, and a struggle to visualize complex states. In the fast-moving world of SaaS, tracking states like trial, active, grace, suspended, and canceled can be overwhelming. Here’s how AI transforms this challenge into a streamlined process. This case study illustrates how a SaaS company effectively accelerated their management of subscription plans, revealing invaluable insights during the design phase and improving outcomes across the board.

The Real-World Bottleneck in Modeling Subscription Plan State Transitions

In the competitive landscape of a SaaS company selling tiered subscription plans, managing state transitions is crucial. The company faced significant challenges in tracking various subscription states effectively. Key issues included:

  • Frequent manual rework due to evolving requirements.
  • Inconsistencies in visual representation of subscription states.
  • Difficulty in communicating active statuses among teams.
  • Time-consuming iterations that slowed down feature deployment.

The reliance on traditional modeling methods created a bottleneck, leading to missed opportunities and frustrating delays. As the team sought a solution, they recognized that adopting AI-powered diagramming could provide the swift clarity they desperately needed in visualizing their subscription states.

AI as Your Modeling Accelerator for State Machine Diagrams

  • AI eliminates blank-page syndrome by offering starting points tailored to your needs.
  • Generate multiple variants rapidly, allowing for immediate exploration of ideas.
  • Seamlessly integrate AI-generated diagrams with existing models for a cohesive workflow.
  • Reduce the risk of error-prone manual notation through precise automation.

Experienced modelers can especially benefit from the AI capabilities when facing tight deadlines, complex refinements for team reviews, or iterative design changes. Visual Paradigm’s suite of professional tools complements AI features, enabling teams to elevate their diagramming accuracy and efficiency.

One-Click Generation Workflow in Visual Paradigm Desktop

  1. Launch Visual Paradigm Desktop Professional or Enterprise Edition.
  2. Go to menu Tools → AI Diagram Generation.

  3. In the AI Diagram Generation window, choose State Machine Diagram in the Diagram Type dropdown.
  4. In the Topic field, write a clear description in plain English.
    Recommended prompt example for this case (copy-paste friendly):
    “The subscription plan states of a SaaS company.”

  5. Click Generate.

Instant, editable results await, ready for professional-level tweaks that meet your team’s specifications.

Fine-Tuning & Scaling the Model

Assuming familiarity with basic functionality, let’s focus on acceleration techniques that enhance your model’s effectiveness.

Typical Cleanup Moves

To refine the AI-generated state machine diagram, consider:

  • Applying custom stereotypes to differentiate between types of subscription states.
  • Optimizing the diagram layout for clarity and cohesive flow.
  • Adding annotations to elaborate on complex transitions for team communication.

Turning Diagram into Living Asset

Transform your generated diagram into a living resource through various advanced uses. For instance:

  • Traceability: Link your diagram to code components for real-time updates on state changes.
  • Code Generation: Use the diagram to automate boilerplate code for state management functions.
  • Simulation: Conduct simulations that track user progression through different subscription states, enhancing insights and identifying bottlenecks.
  • Stakeholder Communication: Provide a visual aid during meetings to convey complex ideas effectively, ensuring alignment and understanding.

By embedding the diagram into practitioners’ workflows, it becomes more than just a static document—it evolves into a crucial asset that drives decision-making and strategic updates.

Outcome Comparison: Manual vs AI+Refine

  • Time Saved: AI-generated diagrams often cut initial drawing time by up to 50%.
  • Quality Gains: Consistent representation of state transitions minimizes inconsistencies.
  • Scalability: Ability to modify diagrams rapidly as business needs evolve ensures that models remain relevant.

The metrics illustrate a significant transformation, with teams reporting a sharp decline in time-to-market for new features. Between manual adjustments and AI-assisted creation, organizations can achieve results at an unprecedented pace without sacrificing quality.

Next Modeling Project? Try This Approach

Ready to elevate your workflow? Download Visual Paradigm Desktop to harness the power of AI acceleration in your modeling tasks.

AI-Generated Sequence Diagram Case Study: Optimizing Payment Processing Flow at Checkout

Imagine an online retailer specializing in electronics, struggling with frequent timeouts and failed transactions during peak shopping periods. This problem not only led to frustrated customers but also resulted in significant revenue losses. Traditional methods of visualizing the payment processing flow were time-consuming and complex. With Visual Paradigm’s AI Diagram Generation feature, this company transformed their approach. The process that once took hours or even days was reduced to mere seconds. In this article, you’ll learn how Visual Paradigm AI not only simplified diagram creation but also significantly improved the efficiency of their payment processing flow. The result? Enhanced customer satisfaction and increased sales.

What is a Sequence Diagram?

A Sequence Diagram is a type of interaction diagram that illustrates how processes operate with one another and in what order. It shows the sequence of messages exchanged between objects necessary to carry out a functionality within a system over time. Sequence Diagrams are commonly used in software development and systems engineering, particularly in the modeling of specific functionalities. They help developers visualize the flow of control and data in applications, making them essential for understanding complex processes.

Some typical use cases for Sequence Diagrams include:

  • Modeling user interactions with a system during various functional scenarios.
  • Visualizing the workflow of processes such as payment processing, order management, and user authentication.

For example, in a payment processing system, a Sequence Diagram can clearly depict each step from customer selection to payment confirmation, highlighting the interaction between various system components like the user interface, payment gateway, and database.

The Optimizing Payment Processing Flow at Checkout Project at a Glance

In the world of online retail, timely and efficient checkout processes are crucial. For an electronics retailer, frequent timeouts and payment failures during peak shopping seasons spurred the need for improvement. The company realized their existing payment processing flow was poorly designed, leading to customer frustration and lost sales opportunities. They required a Sequence Diagram to visualize and optimize this vital process, but the manual development of such diagrams was cumbersome and often delayed critical improvements.

Key challenges included:

  • Frequent system timeouts during busy hours, leading to transaction failures.
  • A lack of clear visualization of the payment flow made it hard to identify bottlenecks.
  • The time-consuming nature of manual diagram design hampered rapid response to issues.
  • Difficulty in aligning team members and stakeholders around the existing flow for effective communication.

Why Generate Sequence Diagrams with AI?

  • Instantly create diagrams that accurately represent complex processes.
  • Save time by swiftly generating a base diagram that can be refined later.
  • Facilitate easier understanding and alignment among team members and stakeholders.
  • Support a rapid prototyping culture, allowing for swift iterations of business processes.

AI generation of Sequence Diagrams provides immense value during early ideation stages, rapid prototyping, and stakeholder alignment workshops. With Visual Paradigm, teams can quickly explore alternatives, create robust starting points for refinement, and maintain a focus on cost-sensitive projects without compromising quality. The combination of immediate AI generation and a full professional modeling platform fosters a seamless workflow, enhancing overall project efficiency.

How to Generate a Sequence Diagram in Seconds with Visual Paradigm Desktop

  1. Launch Visual Paradigm Desktop Professional or Enterprise Edition.
  2. Go to menu Tools → AI Diagram Generation.
  3. In the AI Diagram Generation window, choose Sequence Diagram in the Diagram Type dropdown.
  4. In the Topic field, write a clear description in plain English.
    Recommended prompt example for this case:
    “Optimize the payment processing flow at checkout to reduce transaction timeouts and improve customer satisfaction.”

  5. Click OK.

The AI produces a clean, editable diagram in seconds.

Reviewing and Refining Your AI-Generated Diagram

AI gives an excellent starting point — refinement is where professional modeling tools shine.

Quick Visual & Structural Touch-ups

To enhance the AI-generated Sequence Diagram, consider simple yet effective tips such as repositioning shapes for clarity, utilizing the auto-layout feature to streamline the visual flow, changing color themes to align with your brand, adding notes or comments for context, and straightening lines to improve presentation. These adjustments ensure that the final diagram is not only functional but also aesthetically pleasing.

Leveraging Full Modeling Power for This Sequence Diagram

The generated Sequence Diagram can evolve into a comprehensive modeling tool, making it the heart of ongoing process improvement. For instance, after refining the initial diagram, teams can:

  • Create nested sub-diagrams to represent more granular payment steps or error handling protocols.
  • Link the diagram to a requirements traceability matrix, ensuring all payment processing requirements are tracked through development.
  • Generate code stubs for developers from the diagram, enabling seamless integration with existing software components.
  • Conduct simulations to visualize how changes may affect customer interactions during high traffic periods.

By integrating these elements, the Sequence Diagram transforms from a static visual into a dynamic resource, fostering collaboration and shared understanding among teams while driving continuous improvement in the payment processing workflow.

Results & Key Takeaways

  • The optimization led to a **30% reduction in transaction failures**, significantly boosting customer satisfaction.
  • Time spent on designing and revising diagrams was reduced by over **80%**, allowing teams to focus on strategic improvements.
  • Clearer communication around payment processes improved team collaboration and alignment.

The transformation from outdated manual processes to AI-driven generation not only addressed immediate challenges but also established a foundation for ongoing enhancements. The broader lesson here is the value of integrating advanced tools like Visual Paradigm AI to optimize workflows, underpinning the success of digital businesses in a competitive market.

Conclusion

The speed and professional depth offered by Visual Paradigm‘s AI Diagram Generation feature are game-changers for businesses needing efficient modeling solutions. Download Visual Paradigm Desktop today and create your first AI-generated diagram in under 60 seconds!

Building a Blockchain Supply Chain on Azure: How AI Cloud Architecture Studio Makes It Easy

Discover how AI Cloud Architecture Studio turns ideas into professional cloud diagrams for blockchain supply chains on Azure in seconds.

Ever wished you could turn a complex business idea into a detailed cloud architecture in seconds? With Visual Paradigm‘s AI Cloud Architecture Studio, that’s not just a dream—it’s reality. This powerful, AI-powered tool takes your high-level vision and transforms it into a professional, production-ready cloud diagram, instantly. Take this example: a blockchain-based supply chain tracking system built on Azure. The AI didn’t just draw a diagram—it understood the requirements, mapped out the components, and delivered a complete, enterprise-grade architecture in a matter of minutes. This isn’t just a diagram; it’s a full technical blueprint, ready for review, discussion, and implementation.

Quick summary

  • AI Cloud Architecture Studio turns natural language into professional cloud diagrams in seconds.

  • It supports complex use cases like blockchain supply chain systems on Azure.

  • Features like AI Modify and real-time reporting help teams collaborate faster.

  • Users can explore and refine designs without needing deep cloud expertise.

Let’s dive into how this tool works and why it’s a game-changer for architects, developers, and product teams.

From Idea to Diagram: How the AI Does the Heavy Lifting

The journey starts with a simple statement. In this case, the user entered: “A blockchain-based supply chain tracking system.” That’s it—no technical jargon, no prior cloud knowledge required. The AI Cloud Architecture Studio immediately kicks into gear, using its deep understanding of Azure services to generate a full architecture. The tool doesn’t just guess; it analyzes the requirement and applies best practices for security, scalability, and compliance.

As seen in the screenshot, the generated diagram is rich with detail. It includes key Azure components like Azure Kubernetes Service (AKS) for the application layer, Azure Key Vault for secure key management, and Azure Active Directory for authentication. It also highlights critical elements like Application Insights for monitoring and Azure Policy for compliance enforcement. The AI has structured everything into logical layers—Security & Governance, Application & Data Layer—making it easy for stakeholders to understand the flow.

What’s especially impressive is how the tool handles complexity. A blockchain system requires secure data storage, real-time tracking, and robust identity management. The AI didn’t just list services—it connected them in a way that reflects real-world architecture. For example, it linked the data sync process to the blockchain layer, ensuring data integrity across the system.

This is a screenshot of Visual Paradigm's AI Cloud Architecture Studio, showing a cloud architecture diagram generated by AI

Real-Time Editing and Stakeholder Alignment

One of the most powerful features of this AI-powered tool is the ability to modify the diagram in real time using natural language. Imagine you’re in a meeting with your team, and someone says, “Can we add a CDN for faster content delivery?” Instead of going back to the drawing board, you simply type that request into the AI Modify bar. The tool instantly redraws the architecture, adding a CDN and updating the connections.

This capability transforms the feedback loop. In traditional workflows, a single change request could take days to implement. With AI Cloud Architecture Studio, it happens in seconds. The result? Faster decisions, fewer miscommunications, and more momentum in your project.

Automated Documentation: No More Documentation Rot

A great architecture diagram is only half the battle. You also need clear, role-specific documentation to guide your team. That’s where the reporting feature shines. The AI automatically generates multiple report types—Executive Summary, Security, Cost Optimization, and more—based on the same architecture. The CTO gets a high-level overview, the security team gets a detailed compliance report, and the engineers get a technical implementation guide—all from one source.

This eliminates the “documentation rot” problem that plagues so many teams. Instead of outdated or missing documentation, you have a living, up-to-date record of your system’s design. It’s like having a smart architect who never forgets a detail.

Why This Matters for Your Team

The AI Cloud Architecture Studio isn’t just a tool—it’s a productivity multiplier. It removes the “blank canvas paralysis” that often slows down projects. Instead of spending weeks researching services and debating designs, your team can go from idea to review in minutes. It also democratizes technical design, allowing non-experts to contribute meaningfully to the architecture process.

And with features like customizable architecture strategies (Low Cost, High Availability, Enterprise Grade), you can ensure your design matches your business goals and budget. Whether you’re a startup or a large enterprise, this tool helps you build the right system—not just any system.

Ready to see what your team can do with AI-powered architecture? Try Visual Paradigm’s AI Cloud Architecture Studio today and experience the future of cloud design. Start your free trial now.

Posted on Categories AI

Mastering Visual Paradigm’s AI-Powered Textual Analysis: A Comprehensive Guide to Rapid UML Modeling (2025–2026)

In today’s fast-paced software development landscape, speed, accuracy, and clarity are paramount. Traditional UML modeling can be time-consuming—especially during early design phases—requiring hours of analysis, brainstorming, and iteration. Enter Visual Paradigm’s AI-Powered Textual Analysis Tool, a revolutionary feature that transforms a high-level idea into a structured, AI-generated UML Class Diagram in minutes.

This comprehensive guide walks you through every step of using this powerful AI-driven tool, based on the latest video tutorial (circa September 2025) and official Visual Paradigm documentation. Whether you’re a software engineer, system designer, business analyst, or student learning UML, this tool streamlines your workflow and accelerates project kickoff.


🔧 Overview: What Is AI-Powered Textual Analysis?

AI-Powered Textual Analysis is an intelligent feature within Visual Paradigm that leverages advanced natural language processing (NLP) and large language models (LLMs) to analyze a plain-text problem description and automatically generate:

  • Candidate UML classes

  • Class attributes and operations

  • Relationships between classes (e.g., association, inheritance, aggregation)

  • A fully editable UML Class Diagram

This capability allows developers and analysts to jump from idea to visual model without writing a single line of code—ideal for rapid prototyping, requirements analysis, and educational use.

✅ Ideal for:

  • Early-stage domain modeling

  • Agile sprint planning

  • Teaching UML to beginners

  • Reverse engineering from documentation

  • Integrating AI into SDLC workflows


📌 Prerequisites: Getting Started

Before diving in, ensure you have the following:

Requirement Details
Software Visual Paradigm Desktop (Professional or Enterprise edition recommended)
Download Free 30-day trial: https://www.visual-paradigm.com/download
Internet Connection Required (AI processing runs on cloud servers)
Access Path Tools > Apps → Select Software Development category → Find Textual Analysis
Optional Integration Visual Paradigm Online (for collaboration, export, and advanced editing)

💡 Pro Tip: Use the cloud integration to save your work and continue editing in the browser-based environment.


🔄 Step-by-Step Workflow: From Idea to Class Diagram

Follow this structured, iterative process to generate accurate and meaningful UML models using AI.


Step 1: Launch the AI Textual Analysis Tool

  1. Open Visual Paradigm Desktop.

  2. Navigate to:
    Tools > Apps → Select Software Development tab.

  3. Scroll to page 2 (or use the search bar) to locate Textual Analysis (AI-powered).

  4. Click Start Now.

🖥️ The interface opens with a clean, intuitive layout:

  • Left panel: Input fields and controls

  • Right panel: Real-time results and visual feedback


Step 2: Generate or Refine the Problem Description

The AI begins by generating a detailed problem description based on your initial prompt.

🔹 Enter a Domain Prompt

Input a concise name or goal:

  • "Online Shopping Platform"

  • "Student Registration System"

  • "Hospital Patient Management"

🔹 Click: Generate Problem Description

The AI instantly produces a paragraph (100–150 words) summarizing the system’s purpose, stakeholders, core features, and constraints.

✅ Example Output:
“The Online Shopping Platform enables customers to browse products, add items to a shopping cart, and complete purchases via secure payment gateways. Administrators manage inventory, view order history, and generate sales reports. Each customer has a profile with personal details and shipping address. Products are categorized, with attributes like name, price, stock quantity, and description. Orders are linked to customers and contain multiple line items. The system must support user authentication, role-based access control, and an analytics dashboard for administrators.”

✅ Critical Best Practice: Edit the Generated Text

The AI-generated description is a starting point, not a final version.

🔧 Enhance it with domain-specific details:

  • Add: “The system must include an analytics dashboard for administrators to view usage statistics and sales trends.”

  • Add: “Users must be able to reset passwords via email verification.”

  • Add: “Orders are categorized into pending, shipped, and delivered statuses.”

✅ Why It Matters: Small edits significantly improve the quality of class extraction, attribute suggestions, and relationship detection.


Step 3: Identify Candidate Classes

Click Identify Candidate Classes.

The AI scans the text and extracts potential domain entities (nouns) and concepts.

📋 Output: List of Candidate Classes

Each entry includes:

  • Class Name (e.g., CustomerProductOrder)

  • Reason for Selection (e.g., “appears 5 times in the description”, “central to the domain”)

  • Brief Description (e.g., “Represents a user who buys products”)

🧠 Example:

  • Customer: “Frequent noun; represents a user of the system”

  • PaymentGateway: “Mentioned in context of transaction processing”

  • Inventory: “Key component for managing product availability”

✅ Review & Refine

  • Deselect irrelevant entries (e.g., generic terms like “system”, “data”).

  • Add missing ones manually (e.g., ShoppingCartOrderStatus).

🛠️ Tip: Use this step to correct AI hallucinations—if it missed a key entity, add it now.


Step 4: Identify Class Details (Attributes & Operations)

Click Identify Class Details.

For each class, the AI proposes:

  • Attributes (data fields): e.g., name: Stringemail: Stringprice: Double

  • Operations (methods): e.g., placeOrder()calculateTotal()updateStock()

📊 Example Output for Order:

Attribute Type Description
orderId String Unique identifier
orderDate Date Date when order was placed
status OrderStatus Current state of the order
Operation Parameters Returns
addLineItem(item: Item, quantity: int) Item, int void
calculateTotal() Double
updateStatus(newStatus: OrderStatus) OrderStatus void

✅ Review Tips:

  • Confirm data types (e.g., use LocalDateTime instead of Date for precision).

  • Adjust method names to match coding conventions (e.g., getTotal() vs calculateTotal()).

  • Add missing operations like cancelOrder() or applyDiscount().


Step 5: Identify Class Relationships

Click Identify Class Relationships.

The AI analyzes interactions, dependencies, and ownership patterns in the text and proposes relationships such as:

Relationship Type Description
Association A general link between two classes (e.g., Customer places Order)
Aggregation “Has-a” relationship (e.g., ShoppingCart contains Product)
Composition Stronger “owns” relationship (e.g., Order contains LineItem)
Generalization (Inheritance) Admin extends User
Dependency One class uses another (e.g., PaymentService depends on PaymentGateway)

📋 Example Output:

Source Target Type Explanation
Customer Order Association “Customer places multiple orders”
Order LineItem Composition “Order contains line items”
Admin User Generalization “Admin is a type of user”
PaymentService PaymentGateway Dependency “Uses gateway to process payments”

✅ Verify Accuracy:

  • Ensure composition is used for exclusive ownership.

  • Use inheritance only when is-a relationships exist.

  • Replace weak associations with more specific roles (e.g., Order → Customer via placedBy).


Step 6: Generate the Class Diagram

Click Generate Diagram.

The tool assembles all elements into a clean, readable UML Class Diagram.

✅ Features of the Generated Diagram:

  • Auto-layout: Intelligent placement of classes and relationships

  • Expandable Details: Click any class to view attributes and operations

  • Editable: All elements can be modified directly in the editor

  • Color-coded: Differentiates between entities, interfaces, and abstract classes

🎯 You now have a fully functional, AI-generated class diagram ready for:

  • Further refinement

  • Code generation

  • Integration with other diagrams (e.g., Use Case, Sequence)

  • Documentation and team sharing


Step 7: Iterate and Refine (Recommended)

One of the most powerful aspects of this tool is its iterative design capability.

🔁 How to Iterate:

  1. Go back to the Problem Description tab.

  2. Modify the text:

    • Add: “The system must support user roles: Customer, Admin, and Support Agent.”

    • Add: “Customers can rate products after purchase.”

  3. Re-run:

    • Identify Candidate Classes

    • Identify Class Details

    • Identify Class Relationships

    • Generate Diagram

🔄 Result: The diagram updates dynamically, reflecting new entities (UserRoleReview) and relationships (Customer → ReviewAdmin → SupportAgent).

🎯 Use Case: You’re designing a learning management system and realize you need to model courses, enrollments, and grades—just edit the prompt and regenerate.


Step 8: Export & Further Edit in Visual Paradigm Online

To unlock full editing power and collaboration:

📤 Export to Visual Paradigm Online

  1. In the generated diagram, click the cloud icon (top-left corner).

  2. Choose Save to Visual Paradigm Online.

  3. Log in or create an account if needed.

  4. The diagram is saved to your online workspace.

🔄 Import Back to Desktop

  1. Return to Visual Paradigm Desktop.

  2. Go to: Team > Import from Web Diagram

  3. Select your saved diagram from the list.

  4. Click Import.

✅ Now you can:

  • Use advanced layout tools

  • Add notes, constraints, and stereotypes

  • Generate code (Java, C#, Python, etc.)

  • Reverse engineer from existing code

  • Integrate with Use Case, Sequence, or Component diagrams


🌟 Benefits & Advantages

Benefit Explanation
⚡ Speed From idea to class diagram in under 5 minutes
🤖 Intelligence AI explains why a class or relationship was selected
🔁 Iterative Design Easily refine based on feedback or new requirements
🎓 Learning Aid Great for students to understand UML structure and domain modeling
🔄 Seamless Integration Works with other VP AI tools (e.g., AI Use Case Generator, AI Chatbot)
📊 Explainability Transparent reasoning behind AI choices improves trust

🛠️ Best Practices & Pro Tips

  1. Start Simple: Begin with a clear, focused prompt like "ATM System" or "Hotel Booking App".

  2. Be Specific: Add key verbs and nouns (e.g., “withdraw money”, “reserve a room”).

  3. Use Realistic Scenarios: Include roles, workflows, and constraints.

  4. Review Every Output: AI is assistive—never assume correctness.

  5. Combine with Other AI Tools:

  6. Save Iterations: Export each version to track evolution of your model.

  7. Use Sample Prompts:

    • "E-commerce Platform with User Roles, Shopping Cart, and Payment Processing"

    • "University Course Registration System with Timetables and Grades"

    • "Fitness Tracker App for Monitoring Workouts and Health Metrics"


📘 Use Case Example: Building a Library Management System

Let’s walk through a quick example.

📌 Prompt:

“Library Management System”

📝 Enhanced Description:

“The Library Management System allows librarians to manage books, borrowers, and loans. Each book has a title, ISBN, author, and availability status. Borrowers are registered users who can borrow up to 5 books at a time. Loans are tracked with due dates and late fees. The system must support searching by title, author, or keyword. Librarians can add, update, or remove books. A borrower can return a book, and the system calculates late fees if overdue.”

📌 AI Output Highlights:

  • ClassesBookBorrowerLoanLibrarianSearchEngine

  • AttributesdueDate: DateisOverdue: BooleanlateFee: Double

  • OperationscalculateLateFee()checkAvailability()searchByKeyword()

  • Relationships:

    • Borrower → Loan (association)

    • Book → Loan (composition)

    • Librarian → Book (manages)

✅ Result: A complete, production-ready class diagram in minutes.


🌐 Additional Resources

Resource Link
Official AI Tools Hub https://ai.visual-paradigm.com
Textual Analysis Feature Page https://www.visual-paradigm.com/features/ai-textual-analysis
Video Tutorial (YouTube) VisualParadigm YouTube Channel
Community Forum & Support https://forum.visual-paradigm.com
Free Learning Modules https://learn.visual-paradigm.com

✅ Conclusion: Empower Your Design with AI

Visual Paradigm’s AI-Powered Textual Analysis Tool is not just a novelty—it’s a game-changer for software design.

By turning plain-language descriptions into structured UML models, it:

  • Saves hours of manual effort

  • Reduces modeling errors

  • Accelerates collaboration

  • Demystifies UML for beginners

Whether you’re a solo developer prototyping a startup idea, a business analyst capturing requirements, or a professor teaching software engineering, this tool empowers you to think faster, model smarter, and build better.

🚀 Start today: Download the 30-day free trial and turn your next idea into a UML diagram in minutes.

Visual Paradigm AI Chatbot: A Professional Guide to AI-Powered Visual Modeling

Overview

The Visual Paradigm AI Chatbot is an AI-driven visual modeling assistant developed by Visual Paradigm, a leading provider of UML, enterprise architecture, and diagramming solutions. Designed specifically for visual modeling workflows, this intelligent tool excels at generating, refining, explaining, and analyzing diagrams—particularly UML diagrams (e.g., Sequence, Class, Use Case, Activity, State Machine, Component, Deployment), as well as other industry-standard models such as ArchiMateSysMLC4 ModelMind MapsSWOT/PESTLE frameworks, and more.

Unlike general-purpose AI assistants (e.g., ChatGPT), the Visual Paradigm AI Chatbot is purpose-built for diagram-centric design and documentation, with deep expertise in:

  • UML notation and semantics

  • Interaction fragments (altoptloopref)

  • Lifelines, message flows, activation bars

  • Conditional logic and error handling

It transforms natural language descriptions into clean, accurate, and professionally rendered diagrams in seconds, supporting iterative refinement through conversational feedback.


✅ Key Features

Feature Description
Instant Diagram Generation Describe a business process or system interaction in plain English → receive a fully rendered UML diagram within seconds.
Conversational Refinement Iteratively improve diagrams via follow-up prompts: add branches, rename participants, adjust logic, or restructure layout—no need to restart.
Explain & Understand Ask “Explain this diagram” → receive a clear, step-by-step breakdown of flows, messages, decision points, and control logic.
Multi-Diagram Support Fully supports: Sequence, Class, Use Case, Activity, State, Communication, Object, Package, Deployment, Component, and more.
Smart Error & Flow Handling Automatically applies altoptloop, and ref fragments to represent success paths, exceptions, retries, and validations.
Seamless Integration with Visual Paradigm Export or import diagrams directly into Visual Paradigm Online or Desktop for advanced editing, collaboration, versioning, and documentation.
PlantUML Source View Toggle to view or edit the underlying PlantUML code—ideal for developers, version control, and automation.
Multi-Language Support Accepts prompts and generates diagrams in multiple languages (English, Chinese, Spanish, French, German, Japanese, Korean, etc.).

🛠️ Step-by-Step Guide: How to Use the Visual Paradigm AI Chatbot

1. Access the Chatbot

✅ No login needed for basic use. Sign-in enables saving chats and exporting to your workspace.


2. Start a New or Continue an Existing Chat

  • Click + New Chat to begin fresh.

  • Or continue from an existing conversation for ongoing modeling tasks.

The interface includes:

  • Chat history (for context retention)

  • Diagram preview (rendered in real-time)

  • TabsDiagram | PlantUML Source

  • Zoom controls and export options


3. Generate a Diagram (Core Prompt)

Enter a clear, descriptive natural language prompt. Examples that work best:

Visual Paradigm AI Chatbot: A Professional Guide to AI-Powered Visual Modeling

📌 “Draw a detailed sequence diagram for a car rental process involving Customer, Rental Service, Car Inventory, Payment Gateway, and Customer Profile.”

📌 “Generate a UML sequence diagram for online flight booking: user selects flight → checks seat availability → proceeds to payment → confirms or fails.”

📌 “Create a sequence diagram: user places order → shopping cart validates items → order service checks inventory → payment gateway processes charge → confirmation sent.”

💡 Tip: Be specific about participants, message order, conditions, and outcomes.

👉 Result: The AI generates a fully formatted diagram in 5–15 seconds, complete with:

  • Proper lifelines

  • Solid lines for synchronous messages

  • Dotted lines for return messages

  • Activation bars for active processing

  • altopt, and loop fragments for branching logic

🔍 Example Output: Your car rental diagram includes conditional branches for:

  • Success (car available + rating ≥ 3.0)

  • No cars available

  • Low rating (< 3.0)
    All handled using alt fragments — demonstrating intelligent error and flow management.


4. Refine Iteratively (Conversational Power)

Use follow-up prompts to evolve your diagram:

Prompt Effect
“Add an alternative path when payment is declined.” AI adds a new alt branch with error message and retry option.
“Include model year and color in the car confirmation message.” Updates message text dynamically.
“Change the rating threshold from 3.0 to 4.0.” Adjusts condition in alt fragment.
“Add a loop for up to 3 attempts to select a car.” Introduces loop fragment around selection process.
“Explain the ‘Customer rating too low’ branch.” Returns a detailed explanation of the logic and impact.

✅ No re-generation needed—changes are applied instantly in context.


5. Analyze & Explain Diagrams

Use these prompts to deepen understanding:

  • "Explain this sequence diagram step by step."

  • "What does the 'alt' fragment represent here?"

  • "Summarize the success path from start to confirmation."

  • "Identify all error conditions and how they’re handled."

This feature is especially valuable for:

  • Students learning UML

  • Teams reviewing system interactions

  • Documentation and onboarding


6. Export & Integrate into Projects

Once satisfied, export or integrate your diagram:

Option Use Case
Export as PNG/SVG/PDF For reports, presentations, or sharing.
View PlantUML Source Copy code for version control, embedding in Markdown/docs, or reuse in other tools.
Import to Visual Paradigm Fully edit in the desktop or online IDE—add constraints, stereotypes, links to other diagrams, or generate code.

🔄 Pro Tip: Use the exported PlantUML code in CI/CD pipelines, documentation generators (e.g., MkDocs, Docusaurus), or collaborative wikis.


🌟 User Experience: Why Teams Love It

“It’s like having a senior architect in the chat.” – Software Architect, Global Tech Firm

✅ Real-World Benefits

Benefit Impact
Speed & Productivity What once took 20–60 minutes of manual diagramming now takes 1–5 minutes of conversation. Ideal for prototyping, sprint planning, and design sprints.
Beginner-Friendly No need to memorize UML syntax—just describe the process naturally. The AI enforces correct notation automatically.
Low-Friction Iteration Refine logic, add conditions, or adjust flow in real time—no context loss.
Accurate Complex Logic Handles real-world scenarios: inventory checks, payment failures, rating validations, retry loops—with proper alt/loop usage.
Learning Accelerator Explaining diagrams back to users helps solidify understanding of UML concepts.
Error Resilience AI anticipates common pitfalls (e.g., missing error paths) and includes them proactively.

⚠️ Note: While highly accurate, extremely complex or highly customized layouts may still benefit from final manual adjustments in Visual Paradigm Desktop/Online.


📌 Best Practices for Optimal Results

  1. Be Specific: Include participants, actions, conditions, and expected outcomes.

  2. Use Clear Language: Avoid vague terms like “something happens” → say “the system validates the user’s credentials.”

  3. Break Down Complex Scenarios: Start with the main flow, then add branches (e.g., success, failure, retry).

  4. Leverage Follow-Ups: Don’t hesitate to iterate—each prompt refines the model.

  5. Use PlantUML Mode for Code Integration: When working in documentation or automation, switch to PlantUML Source to extract clean code.


🏁 Conclusion: The Future of Visual Modeling is Conversational

The Visual Paradigm AI Chatbot redefines how professionals approach visual modeling. By turning natural language into precise, structured diagrams—complete with intelligent flow control, error handling, and real-time refinement—it bridges the gap between business requirementstechnical design, and development execution.

Whether you’re a developersystem architectbusiness analyst, or student, this tool empowers you to:

  • Design faster

  • Communicate clearer

  • Learn better

  • Collaborate smarter

🎯 Final Thought: Visual modeling is no longer a barrier—it’s a conversation.


🔧 Need Help? Try This Prompt!

“Generate a UML sequence diagram for a user login process: user enters email/password → system validates credentials → if valid, redirect to dashboard; if invalid, show error message and allow retry up to 3 times.”

👉 Paste this into the chatbot and see how quickly you get a polished, production-ready diagram.


📬 Have a Scenario in Mind? Let’s Build It Together

If you’d like help crafting the perfect prompt for your use case—whether it’s for banking systemse-commerce workflowsIoT device interaction, or enterprise architecture modeling—just share your idea, and I’ll help you write the optimal input for the Visual Paradigm AI Chatbot.


📞 Explore Nowhttps://chat.visual-paradigm.com
📚 Learn Morehttps://www.visual-paradigm.com
💬 Join the Community: Thousands of users worldwide use the AI Chatbot daily for faster, smarter modeling.


Visual Paradigm AI Chatbot – Where Ideas Become Diagrams, Instantly. 🚀

A Case Study: Modeling an E-Commerce Order Submission Process with UML Sequence Diagrams Using Visual Paradigm’s AI Chatbot

Introduction to UML and Sequence Diagrams

The Unified Modeling Language (UML) is a standardized modeling language used in software engineering to visualize, specify, construct, and document systems. Among UML’s 14 diagram types, sequence diagrams belong to the interaction diagrams category. They emphasize the dynamic behavior of a system by illustrating how objects (or actors and components) interact over time through message exchanges.

Sequence diagrams are particularly valuable for capturing the order of operations, message flows, conditional logic (e.g., alternatives or loops), and error handling in use cases. Unlike class diagrams (which show static structure), sequence diagrams focus on runtime interactions, making them ideal for scenarios involving multiple participants, such as user flows, API calls, or microservices communication.

Key Concepts in Sequence Diagrams

Here are the core elements of a UML sequence diagram:

Understanding Sequence Diagram Notation in UML - Visual Paradigm Guides

  • Lifelines: Vertical dashed lines representing participants (objects, actors, or systems) over time. Time flows from top to bottom.
  • Messages: Horizontal arrows indicating communication. Solid arrows typically denote synchronous calls (with expected return), dashed arrows show asynchronous messages or returns.
  • Activation Bars (Execution Specifications): Thin rectangles on lifelines showing when a participant is active (processing a request).
  • Actors: External entities (e.g., User) initiating interactions, often shown with a stick figure.
  • Combined Fragments: Boxes for control structures, such as:
    • alt (alternative) for if-else conditions.
    • opt for optional flows.
    • loop for repetitions.
  • Interaction Uses (ref): Reusing common sub-interactions.
  • Return Messages: Dashed arrows showing responses or results.

These elements allow modelers to represent complex flows, including success paths and exceptions, in a clear, chronological view.

Case Study: E-Commerce Order Submission Process

Consider a realistic e-commerce scenario where a user places an order via a shopping cart. The process involves validation of address, stock availability, and payment. The system must handle three main paths:

A Case Study: Modeling an E-Commerce Order Submission Process with UML Sequence Diagrams Using Visual Paradigm’s AI Chatbot

  1. Success: Valid order → stock reserved → payment processed → order confirmed and delivery scheduled.
  2. Invalid Address: Early rejection with user prompt.
  3. Payment Declined: Stock checked but payment fails → error message to user.

This flow includes conditional branching (alt fragments) and error handling, making it a perfect candidate for a sequence diagram.

Participants

  • User (Actor)
  • Shopping Cart (Interface component)
  • Order Service (Core business logic)
  • Inventory System (External/back-end check)
  • Payment Gateway (External service)

Interpretation of the Diagram

The provided PlantUML-based diagram (generated conceptually from the described flow) shows:

  • The process starts with the User submitting an order via the Shopping Cart.
  • The Shopping Cart forwards the request to the Order Service.
  • An alt fragment branches based on validations:
    • [Order is valid] → Order Service checks stock with Inventory System → If available, proceeds to payment → Payment Gateway processes → Success returns confirmation → Order confirmed → Delivery scheduled → User notified.
    • [Invalid Address] → Early rejection → Message to user: “Please enter a valid address”.
    • [Payment Declined] → Payment attempted but fails → Error: “Payment declined – try again”.

The diagram uses combined fragments (alt) to group conditional paths cleanly. Activation bars show participant processing periods, and dotted return messages indicate responses. This structure keeps the diagram readable while covering happy-path and error scenarios.

Such a diagram helps developers understand message sequencing, identify potential bottlenecks (e.g., external calls to Payment Gateway), and ensure error paths are handled gracefully.

Using Visual Paradigm’s AI Chatbot to Create the Sequence Diagram

Visual Paradigm, a leading UML modeling tool, features an AI Chatbot (accessible via their online platform or desktop app) that revolutionizes diagram creation. Instead of manually dragging lifelines and arrows, users describe the scenario in natural language, and the AI generates a professional, editable UML diagram instantly.

Step-by-Step Process

  1. Access the AI Chatbot (e.g., at chat.visual-paradigm.com or via Tools > AI Chatbot in Visual Paradigm).
  2. Select or specify “UML Sequence Diagram” as the type.
  3. Provide a clear textual description, such as the one in this case study: “A user submits an order from the shopping cart. The order service validates the address and stock. If invalid address, prompt user. If valid, check inventory. If stock available, process payment via gateway. If payment succeeds, confirm order and schedule delivery. Include branches for invalid address and payment declined.”
  4. Refine via conversation: Ask the AI to add details (e.g., “Add activation bars” or “Include return messages for failures”).
  5. Generate: The AI produces the diagram (often in editable format, with PlantUML source if needed).
  6. Edit & Export: Refine manually (adjust layout, labels), then export as image, PDF, or code.

In this case study, the diagram closely matches what the AI would output from the provided description — complete with alt fragments for branches, proper message directions, and clean lifelines. The tool ensures UML compliance, balanced layout, and readability.

Benefits observed:

  • Speed: From text to diagram in seconds.
  • Accuracy: AI applies correct notation for fragments and messages.
  • Iteration: Chat-based refinement allows quick adjustments without redrawing.

How to Use Sequence Diagrams Effectively

Sequence diagrams shine in:

  • Requirements analysis → Clarify use case flows with stakeholders.
  • Design phase → Detail interactions before coding.
  • Documentation → Explain system behavior to teams or for onboarding.
  • Debugging → Compare expected vs. actual message sequences.
  • Testing → Derive test cases from success/error paths.

Best practices:

  • Keep diagrams focused on one use case or scenario.
  • Use meaningful names for messages (e.g., “checkStock()” instead of vague terms).
  • Limit participants to 5–7 for readability.
  • Combine with other UML diagrams (e.g., use case diagrams for context, class diagrams for structure).

Conclusion

This e-commerce order process case study demonstrates how sequence diagrams effectively model real-world interactions with conditional logic and error handling. By leveraging Visual Paradigm’s AI Chatbot, creating such diagrams becomes accessible and efficient — shifting focus from manual drawing to high-level thinking and refinement.

Modern tools like this lower the barrier for developers, analysts, and architects, enabling faster iteration and better communication in software projects. Whether you’re designing a simple checkout or a complex distributed system, sequence diagrams — powered by AI — remain an essential tool for understanding and building reliable systems.

Articles and resources

Modeling a Social Media Platform Database: AI-Powered ERD Generation in Visual Paradigm

Learn how to use Visual Paradigm’s AI to instantly generate professional ER diagrams for a social media platform database from simple text prompts.

Let’s be honest: starting a database design from a blank canvas can be a daunting task. Whether you are an experienced software architect or a student learning data modeling, manually drawing entities, defining attributes, and routing relationship lines takes significant effort. This is where AI Entity Relationship Diagram (ERD) generation changes the game. By simply describing your project ideas—like a “Social Media Platform”—you can use Visual Paradigm Desktop to instantly transform natural language into a professional, standards-compliant data model.

This feature isn’t just about speeding up the process; it’s about bridging the gap between a business requirement and a technical schema. In this deep dive, we’ll look at how you can go from a simple text prompt to a fully structured database diagram containing users, posts, and comments in just seconds using this intelligent database design tool.

Quick summary: Key takeaways

  • Text-to-Model Efficiency: Convert plain English descriptions into complex ER diagrams instantly.
  • Intelligent Detection: The AI automatically identifies entities, attributes, primary keys, and relationships.
  • Standard Notation: Generates diagrams that follow industry-standard ER conventions (Crow’s Foot, etc.).
  • Fully Editable: The result is a native Visual Paradigm diagram, ready for further refinement and SQL generation.

Step 1: Defining the Scope with Natural Language

The process begins with a simple concept. You don’t need to know SQL syntax or drag-and-drop dozens of boxes manually. Instead, you access the AI Diagram Generation feature within the tool. As shown in the workflow below, you simply select “Entity Relationship Diagram” as your target output. The power lies in the prompt.

In our example, we wanted to visualize the backend of a social network. We entered the prompt: “Visualize an ERD describing the database structure of a social media platform”. This plain text is all the AI needs to understand the domain requirements, inferring that a social platform typically needs users, content, interactions, and notifications.

This is a screenshot of Visual Paradigm (aka. Visual Paradigm Desktop). It is now showing the use of AI diagram generation to

Step 2: Analyzing the AI-Generated Data Model

Once you hit “OK,” the AI analyzes your text to identify the core entities (tables) and their associations. It doesn’t just drop random boxes on the canvas; it applies intelligent relationship and cardinality detection to structure the data logic. Within moments, you are presented with a complete diagram that looks like it took hours to design manually.

Looking at the result below, you can see the AI correctly generated a schema perfectly suited for a social media app. It created a User entity with standard attributes like username, email, and password. It logically connected the User to a Post entity (one-to-many relationship), recognizing that one user creates many posts. It even fleshed out the details by adding Comment, Like, and Notification entities, complete with foreign keys (e.g., post_id, author_id) and appropriate data types like varchar, clob, and integer.

This is the screenshot of Visual Paradigm Desktop. It shows a Entity Relationship Diagram generated by AI, based on the descr

Why This AI Feature is a Must-Have for Modelers

The beauty of using an AI-powered database modeling tool is that it handles the heavy lifting of layout and organization. As seen in the generated diagram, the entities are arranged to minimize crossing lines, making the data structure easy to read and validate.

Automatic Attribute and Key Assignment

Notice how the AI automatically assigned Primary Keys (PK) to every entity, represented by the key icon. It also made smart guesses on data types—assigning clob (Character Large Object) for the “content” of a post because it knows posts can be long, while keeping “username” as a standard varchar(50). This saves you the tedium of manually setting properties for every single column during the conceptual phase.

From Static Image to Functional Project

Unlike simple image generators, the output here is a fully editable native diagram. If you decide later that a “Post” should also have a “Category,” you can simply add that attribute using the diagram editor. This seamless transition to implementation means you can use this diagram as a foundation to generate DDL scripts for MySQL, PostgreSQL, or Oracle, effectively moving from a rough idea to a physical database schema in one workflow.

How to Create Your Own AI ERD

Ready to try this easy-to-use ERD creator? Here is the simple workflow to replicate the results shown above:

  1. Launch Visual Paradigm: Open a new or existing project.
  2. Open AI Tool: Navigate to Tools > AI Diagram Generation.
  3. Select Diagram Type: Choose “Entity Relationship Diagram” from the dropdown menu.
  4. Enter Description: Type a clear description of your system (e.g., “A library system with books, members, and loans”).
  5. Generate: Click OK and watch your diagram appear.
  6. Refine: Use the editor to tweak relationships or add specific constraints if needed.

Conclusion

Visual Paradigm’s AI Entity Relationship Diagram Generation transforms the way we approach data modeling. By turning a simple sentence about a “social media platform” into a comprehensive, technically accurate ERD, it removes the barriers to entry for database design. Whether you are prototyping a new application or documenting an existing system, this tool provides a robust, professional starting point instantly.

Stop drawing boxes one by one. Experience the speed of AI-assisted modeling today.

Download Visual Paradigm Desktop and try AI Diagram Generation now


Related Links

Visual Paradigm provides a comprehensive suite of ERD (Entity-Relationship Diagram) tools that facilitate the design of scalable database schemas through both traditional visual editors and AI-driven automation. These tools support various notations, such as Chen notation, and enable the seamless transition from conceptual modeling to physical database implementation and reverse engineering.

  1. Visual Paradigm ERD Tool – Create Entity-Relationship Diagrams Online: A web-based tool that enables the intuitive drag-and-drop design of professional database schemas.
  2. Database Design with ERD Tools – Visual Paradigm Guide: A resource for architects focused on building scalable and robust databases using data modeling best practices.
  3. DBModeler AI: Intelligent Database Modeling Tool: An AI-driven application designed for automated database modeling, schema generation, and live SQL testing.
  4. Free ERD Tool – Design Databases Online with Visual Paradigm: Offers a no-installation, browser-based solution for creating professional entity-relationship diagrams at no cost.
  5. Chen Notation ERD Editor – Advanced Entity-Relationship Modeling: A specialized editor providing full support for entities, attributes, relationships, and cardinality using precise Chen notation.
  6. Visual Paradigm ERD Tool for Database Design – Complete Solution: A comprehensive tool for developers and architects to model, visualize, and generate databases with high efficiency.
  7. New Diagram Types Added to AI Diagram Generator: DFD & ERD: This release highlights the ability to generate ERDs instantly from natural language prompts using AI.
  8. Streamlining Entity-Relationship Modeling with Visual Paradigm: An article detailing how to simplify the modeling process from the initial concept to final database deployment.
  9. Introduction to Data Modeling: ERD, Code Generation & Reverse Engineering: An introductory guide covering the essential lifecycle of diagramming and reverse engineering databases.
  10. What is an Entity-Relationship Diagram (ERD)? – Visual Paradigm Guide: An explanatory guide covering the core components and significance of ERDs within the broader context of database design.

A Comprehensive Guide to UML Sequence Diagrams for Use Case-Driven Development: What, Why, How, and How AI Makes It Easy

In modern software development, use case-driven design is a cornerstone of effective system modeling. It focuses on capturing user goals and system behaviors through real-world scenarios. At the heart of this approach lies the UML sequence diagram—a powerful visual tool that brings use cases to life by showing how objects interact over time.

Online Sequence Diagram Tool

This comprehensive guide is designed for beginners and teams who want to understand:

  • What sequence diagrams are and why they matter

  • How to create them using a use case-driven approach

  • Key concepts and real-world examples

  • How Visual Paradigm’s AI Sequence Diagram Generator accelerates the entire process—making modeling faster, smarter, and more collaborative.


🎯 What Is a Use Case-Driven Approach?

use case-driven approach centers system design around user goals. Each use case describes a specific interaction between a user (actor) and the system to achieve a meaningful outcome.

Example:
“As a customer, I want to log in to my account so I can view my order history.”

Use cases are not just documentation—they are blueprints for functionality, and sequence diagrams are the ideal way to visualize how those use cases unfold in real time.


🧩 Why Use Sequence Diagrams in Use Case-Driven Development?

Sequence diagrams are uniquely suited to support use case modeling because they:

✅ Show the dynamic flow of interactions
✅ Highlight timing and order of messages
✅ Clarify responsibilities between objects
✅ Expose edge cases (e.g., invalid input, timeouts)
✅ Support validation of use cases during design and testing
✅ Improve communication between developers, testers, and stakeholders

🔍 Without sequence diagrams, use cases can remain abstract. With them, they become executable blueprints.


📌 Key Concepts of UML Sequence Diagrams (Beginner-Friendly)

Before diving into use cases, let’s master the core building blocks:

Sequence Diagram Example

Element Description Visual
Lifelines Vertical dashed lines representing objects or actors. Shows existence over time. ───────────────
Messages Horizontal arrows between lifelines. Show communication.
  • Synchronous Solid arrow with filled head. Caller waits for response.
  • Asynchronous Solid arrow with open head. No wait.
  • Return Dashed arrow (response).
  • Self-message Arrow looping back to same lifeline (internal processing).
Activation Bars Thin rectangles on lifelines showing when an object is active. ▯▯▯
Combined Fragments Boxes that represent control logic:
  • alt Alternatives (if/else) alt: success / failure
  • opt Optional (may or may not happen) opt: print receipt
  • loop Repetition (e.g., while loop) loop: retry 3 times
  • par Parallel execution par: check payment & stock
Creation/Deletion create message or “X” at the end of a lifeline create: User or X

💡 Tip: Always start with a use case, then map it to a sequence diagram.


🔄 How to Create a Sequence Diagram from a Use Case (Step-by-Step)

Let’s walk through a real-world example using a use case-driven approach.

Free AI Sequence Diagram Refinement Tool - Visual Paradigm AI


📌 Example: Use Case – “User Logs In to System”

Use Case Text:

As a user, I want to log in to my account using my username and password so I can access my profile.

Step 1: Identify Actors and Objects

  • ActorUser

  • ObjectsLoginViewLoginControllerDatabase

Step 2: Define the Main Flow

  1. User → LoginView: Enters username/password

  2. LoginView → LoginController: Sends credentials

  3. LoginController → Database: Checks if user exists

  4. Database → LoginController: Returns result

  5. LoginController → LoginView: Sends success/failure

  6. LoginView → User: Displays message

Step 3: Add Control Logic with Combined Fragments

Use an alt fragment to show:

  • Success path: “Login successful”

  • Failure path: “Invalid credentials”

✅ This captures the decision point in the use case.

Step 4: Add Activation Bars

  • Add activation bars to LoginController and Database to show processing time.

Step 5: Final Diagram

Now you have a complete, use case-aligned sequence diagram that reflects real system behavior.

🔗 See this in action: AI-Powered UML Sequence Diagrams


📌 Example 2: Use Case – “Customer Withdraws Cash from ATM”

Use Case Text:

As a customer, I want to withdraw cash from an ATM so I can access my money. If the balance is insufficient, I want to be notified.

Step 1: Identify Participants

  • ActorCustomer

  • ObjectsATMCardReaderBankServerCashDispenser

Step 2: Main Flow

  1. Customer → ATM: Inserts card

  2. ATM → CardReader: Reads card

  3. ATM → Customer: Prompts for PIN

  4. Customer → ATM: Enters PIN

  5. ATM → BankServer: Validates PIN

  6. BankServer → ATM: Confirms valid

  7. ATM → Customer: Prompts for amount

  8. Customer → ATM: Enters amount

  9. ATM → BankServer: Checks balance

  10. BankServer → ATM: Returns balance

  11. ATM → CashDispenser: Dispenses cash

  12. ATM → Customer: Shows receipt option

Step 3: Add Fragments

  • loop: For retry attempts after wrong PIN

  • opt: For receipt printing

  • alt: For “insufficient funds” vs. “success”

🔗 See how AI handles this: Simplify Complex Workflows with AI Sequence Diagram Tool


📌 Example 3: Use Case – “Customer Completes E-Commerce Checkout”

Use Case Text:

As a customer, I want to add items to my cart, proceed to checkout, and complete payment so I can receive my order.

Step 1: Participants

  • CustomerShoppingCartPaymentGatewayInventorySystemOrderConfirmation

Step 2: Flow with Parallelism

  1. Customer → ShoppingCart: Adds item(s) → loop for multiple items

  2. ShoppingCart → Customer: Shows total

  3. Customer → PaymentGateway: Initiates payment

  4. Customer → InventorySystem: Requests stock check

  5. PaymentGateway → Bank: Processes payment → par with inventory check

  6. InventorySystem → PaymentGateway: Confirms availability

  7. PaymentGateway → ShoppingCart: Confirms order

  8. ShoppingCart → OrderConfirmation: Sends confirmation

✅ Use par fragment to show concurrent processing.

🔗 See a full tutorial: Mastering Sequence Diagrams with AI Chatbot: E-commerce Case Study


🤖 How Visual Paradigm’s AI Sequence Diagram Generator Helps Teams

Traditional modeling tools require users to manually drag lifelines, draw messages, and place fragments—time-consuming and error-prone.

A Comprehensive Guide to UML Sequence Diagrams for Use Case-Driven Development: What, Why, How, and How AI Makes It Easy

Visual Paradigm’s AI-powered tools eliminate these bottlenecks, especially for teams using a use case-driven approach.

✨ 1. AI Chatbot: Generate Diagrams from Use Case Text in Seconds

Instead of drawing by hand, describe your use case in plain English:

📝 Prompt:
“Generate a sequence diagram for a user logging in with username/password, including error handling and retry after 3 failed attempts.”

The AI:

  • Identifies actors and objects

  • Maps the use case flow to lifelines and messages

  • Applies altloop, and opt fragments automatically

  • Outputs a clean, professional diagram in under 10 seconds

🔗 Try it: AI-Powered UML Sequence Diagrams


✨ 2. AI Sequence Diagram Refinement Tool: Turn Drafts into Professional Models

Even if you start with a rough sketch, the AI Sequence Diagram Refinement Tool enhances it:

  • Adds activation bars where needed

  • Suggests correct fragment usage (altlooppar)

  • Enforces design patterns (e.g., MVC: View → Controller → Model)

  • Detects missing error paths and edge cases

  • Improves readability and consistency

🔗 Learn how: Comprehensive Tutorial: Using the AI Sequence Diagram Refinement Tool


✨ 3. From Use Case Descriptions to Diagrams: Zero Manual Translation

No more translating use case text into diagrams by hand.

The AI automatically converts textual use cases into accurate sequence diagrams, reducing:

  • Manual effort

  • Misinterpretation

  • Inconsistencies

🔗 See it in action: AI-Powered Sequence Diagram Refinement from Use Case Descriptions


✨ 4. Iterative Refinement with Conversational AI

Want to improve your diagram? Just chat with the AI:

  • “Add a ‘Forgot Password’ option after 3 failed login attempts.”

  • “Change ‘User’ to ‘Customer’.”

  • “Show the error message in red.”

Each prompt updates the diagram in real time—no redrawing, no frustration.

🔗 Explore the interface: AI Sequence Diagram Refinement Tool Interface


✨ 5. Team Collaboration Made Easy

  • Non-technical stakeholders (product managers, clients) can contribute via natural language.

  • Developers can refine diagrams quickly during sprints.

  • Testers can use diagrams to write test cases.

  • Designers can validate flows before coding.

✅ Ideal for agile teams using user stories and use cases.


🚀 Why Teams Love Visual Paradigm’s AI for Use Case Modeling

Benefit Impact
⏱️ Speed Generate diagrams in seconds instead of hours
🧠 Low Skill Barrier No UML expertise needed to start
🔄 Iterative Design Refine diagrams in real time via chat
🛠️ Error Reduction AI catches missing flows, invalid fragments
📦 Export & Share Export to PNG, SVG, PDF, or embed in Confluence/Notion
🤝 Collaboration Everyone can contribute, even non-technical members

📚 Top Resources for Beginners & Teams

Resource URL
AI-Powered UML Sequence Diagrams https://blog.visual-paradigm.com/generate-uml-sequence-diagrams-instantly-with-ai/
AI-Powered Sequence Diagram Refinement Tool https://www.visual-paradigm.com/features/ai-sequence-diagram-refinement-tool/
Comprehensive Tutorial: Using the AI Sequence Diagram Refinement Tool https://www.archimetric.com/comprehensive-tutorial-using-the-ai-sequence-diagram-refinement-tool/
AI-Powered Sequence Diagram Refinement from Use Case Descriptions https://www.cybermedian.com/refining-sequence-diagrams-from-use-case-descriptions-using-visual-paradigms-ai-sequence-diagram-refinement-tool/
Simplify Complex Workflows with AI Sequence Diagram Tool https://www.cybermedian.com/🚀-simplify-complex-workflows-with-visual-paradigm-ai-sequence-diagram-tool/
AI Sequence Diagram Refinement Tool Interface https://ai.visual-paradigm.com/tool/sequence-diagram-refinement-tool/
Beginner’s Tutorial: Create Professional Sequence Diagrams in Minutes https://www.anifuzion.com/beginners-tutorial-create-your-first-professional-sequence-diagram-in-minutes-using-visual-paradigm-ai-chatbot/
From Simple to Sophisticated: AI-Powered Modeling Evolution https://guides.visual-paradigm.com/from-simple-to-sophisticated-what-is-the-ai-powered-sequence-diagram-refinement-tool/
Mastering Sequence Diagrams with AI Chatbot: E-commerce Case Study https://www.archimetric.com/mastering-sequence-diagrams-with-visual-paradigm-ai-chatbot-a-beginners-tutorial-with-a-real-world-e-commerce-case-study/
AI Sequence Diagram Example: Video Streaming Playback Initiation https://chat.visual-paradigm.com/ai-diagram-example/ai-sequence-diagram-video-streaming-playback/

✅ Final Tips for Teams Using Use Case-Driven Design

  1. Start with a clear use case – define the user goal first.

  2. Use sequence diagrams to validate the flow before coding.

  3. Involve stakeholders early – use diagrams for feedback.

  4. Leverage AI to reduce manual work – let the tool do the heavy lifting.

  5. Keep diagrams updated – revise as requirements evolve.


🎁 Get Started for Free

You don’t need a paid license to experience the power of AI-driven modeling.


📌 Conclusion

use case-driven approach is the foundation of user-centered software design. UML sequence diagrams bring those use cases to life—showing who does what, when, and how.

With Visual Paradigm’s AI Sequence Diagram Generator, teams can:

  • Generate diagrams from plain language

  • Refine them in real time

  • Ensure consistency and accuracy

  • Collaborate across roles

🚀 From use case to diagram in seconds—no UML expertise needed.

👉 Start today with the free Community Edition and transform your team’s modeling workflow.


🌟 The future of system design is not just visual—it’s intelligent.
Let AI be your modeling partner.

From Problem to Report: How AI Guides Your Use Case Journey

Discover how AI guides your use case journey from problem to report with Visual Paradigm’s intelligent development assistant.

Imagine you’re a project manager tasked with launching a new online course platform. The first challenge is to articulate the problem clearly and then translate it into a functional system. This is where the Use Case Driven Development Assistant, an AI-powered tool from Visual Paradigm, steps in. It doesn’t just help you write documents; it guides you through a complete, structured workflow to transform a vague idea into a detailed, actionable project plan. The process is so intuitive, it feels like having a seasoned business analyst and a technical architect working side-by-side with you. This deep dive explores the core features of this powerful tool, using a real-world example of an online course platform to show how it streamlines the entire use case lifecycle.

Quick Summary: Key Takeaways from the Use Case Driven Development Assistant

  • Start with a clear problem statement to define the project’s core objective.

  • Use AI to automatically generate a list of candidate use cases and actors.

  • Visualize system functionality with AI-generated Use Case and Activity Diagrams.

  • Prioritize features using a structured MoSCoW method to focus on high-value work.

  • Generate detailed use case descriptions and executable Gherkin test scenarios.

  • Create comprehensive reports to communicate project scope and plans.

  • Track progress and maintain a single source of truth with a central dashboard.

Step 1: Defining the Problem with AI

Every successful project begins with a clear understanding of the problem it aims to solve. The journey with the Use Case Driven Development Assistant starts in the “Problem Statement” tab. Here, you input a project name and a short description. The AI then leverages this information to generate a comprehensive problem statement. As seen in Image 1, the tool has taken the project name “Online Course Platform” and the short description “A marketplace for instructors to create and sell courses, and for students to enroll and learn” to produce a detailed narrative. This narrative identifies the core pain points: students struggle to find relevant courses, while instructors face challenges in reaching a broad audience and monetizing their expertise. This AI-generated problem statement serves as the project’s foundation, ensuring everyone on the team shares a unified understanding from the very beginning.

This is a screenshot of Visual Paradigm's AI Powered Use Case Driven Development Assistant. we are now in step 1. It shows th

Step 2: Identifying Use Cases with AI Assistance

Once the problem is defined, the next logical step is to identify the key functionalities the system must provide. The assistant’s “Candidate Use Cases” tab, shown in Image 2, automates this process. After analyzing the problem statement, the AI suggests a list of use cases, each associated with an actor (like Instructor, Student, or Admin). For our online course platform, the AI proposes use cases such as “Create a New Course,” “Upload Course Content,” “Browse and Search Courses,” and “Enroll in a Course.” This list provides a solid starting point, saving significant time and effort that would otherwise be spent on brainstorming sessions. You can then refine these suggestions, add new ones, or delete irrelevant ones to create a comprehensive list of system functionalities.

This is a screenshot of Visual Paradigm's AI Powered Use Case Driven Development Assistant. We are now in step 2. It shows a

Step 3: Visualizing the System with a Use Case Diagram

After identifying the use cases, it’s crucial to visualize how they interact with the system’s actors. The “Use Case Diagram” tab, illustrated in Image 3, takes the list of use cases and actors and automatically generates a clear, graphical representation. This diagram shows the relationships between the actors (Instructor, Student, Admin) and the system’s functions (Create a New Course, etc.). The AI-powered generation ensures that the diagram is accurate and professionally formatted. This visual aid is invaluable for communication, allowing stakeholders, developers, and designers to quickly grasp the system’s scope and functionality without wading through text-heavy documents.

This is a screenshot of Visual Paradigm's AI Powered Use Case Driven Development Assistant. We are now in step 3. It shows a

Step 4: Prioritizing Features for Maximum Impact

Not all use cases are created equal. A project’s success often hinges on focusing on the most critical features first. The “Prioritize Use Cases” tab, as shown in Image 4, provides a powerful framework for this. It allows you to assign a user value and business value (on a scale of 0-10) to each use case and then apply the MoSCoW prioritization method (Must Have, Should Have, Could Have, Won’t Have). In our example, the AI has helped identify that “Create a New Course” and “Upload Course Content” are “Must Have” features, as they are essential for the platform’s core function. This structured prioritization ensures that the development team focuses on delivering the highest value to users and the business, avoiding wasted effort on low-priority features.

This is a screenshot of Visual Paradigm's AI Powered Use Case Driven Development Assistant. We are now in step 4. It shows th

Step 5: Detailing Use Cases and Generating Activity Diagrams

With the high-level view established, the next step is to dive into the details of each use case. The “Use Case Details” tab, shown in Image 5, allows you to create a comprehensive template for a selected use case. The AI can generate a detailed description, including pre-conditions, main flow, and alternative flows. For the “Create a New Course” use case, the AI provides a structured template that outlines the necessary steps. To further enhance understanding, the assistant can generate an “Activity Diagram” for the same use case, as seen in Image 6. This diagram visually maps out the step-by-step workflow, showing the sequence of actions from the instructor logging in to the course being saved. This level of detail is essential for both developers and QA teams.

This is a screenshot of Visual Paradigm's AI Powered Use Case Driven Development Assistant. We are now in step 5. It shows thThis is a screenshot of Visual Paradigm's AI Powered Use Case Driven Development Assistant. We are still in step 5. It shows

Step 6: Generating Test Scenarios and Sequence Diagrams

For a development team, the next critical step is to create testable scenarios. The “Scenarios” tab, shown in Image 7, allows you to generate executable Gherkin scenarios directly from your use case descriptions. These scenarios, written in a plain-language format (Given-When-Then), are perfect for automated testing. The AI can generate a main scenario and alternative scenarios, such as one for an invalid title. To further clarify the system’s internal workings, the assistant can generate a “Sequence Diagram,” as seen in Image 8. This diagram shows the interaction between the instructor, the web dashboard, the backend API, the database, and the notification service, providing a clear picture of the system’s architecture and data flow.

This is a screenshot of Visual Paradigm's AI Powered Use Case Driven Development Assistant. We are in step 6. It shows the AIThis is a screenshot of Visual Paradigm's AI Powered Use Case Driven Development Assistant. We are still in step 6. It shows

Step 7: Creating Comprehensive Project Reports

Throughout the development process, it’s essential to communicate the project’s status and plans to various stakeholders. The “Generate Report” tab, as shown in Image 9, makes this easy. You can generate a variety of reports, such as a “Project Overview,” “Implementation Plan,” “QA Test Plan,” or a “Developer Task List.” These reports are generated with AI assistance, ensuring they are consistent and comprehensive. For example, the “Project Overview” report summarizes the entire project, including the executive summary, key features, and the rationale behind the prioritization. This single source of truth ensures everyone is aligned and informed.

This is a screenshot of Visual Paradigm's AI Powered Use Case Driven Development Assistant. We are in step 7. It shows a repo

Step 8: Tracking Progress with the Dashboard

Finally, the journey culminates in the “Dashboard,” as seen in Image 10. This central hub provides a high-level overview of the project’s status. It shows the project completion percentage, the total number of use cases, and the number of “Must Have” items. The project checklist allows you to track your progress, with each completed step marked as “Done.” This real-time visibility into the project’s health is invaluable for project managers and team leads, enabling them to identify bottlenecks and ensure the project stays on track.

This is a screenshot of Visual Paradigm's AI Powered Use Case Driven Development Assistant. We are in step 8. It shows the da

The Use Case Driven Development Assistant is more than just a tool; it’s a comprehensive workflow that brings clarity and efficiency to the software development process. By leveraging AI at every stage—from defining the problem to generating reports—it helps teams move from requirements to implementation faster and with greater accuracy. The result is a well-structured, well-documented project that is aligned with business goals and user needs. If you’re looking to streamline your use case development process, this AI-powered tool is a powerful solution.

Ready to see how the Use Case Driven Development Assistant can transform your next project? Try it now.

Related Links

Use case modeling is a fundamental software engineering technique used to capture functional requirements by visualizing the interactions between external actors and a system’s internal functions. Modern platforms now incorporate AI-powered automation to refine diagrams, generate comprehensive use case descriptions, and convert models into test cases or activity diagrams to maintain design consistency and traceability. Advanced tools like the Flow of Events editor and Scenario Analyzer allow development teams to validate and document structured event sequences to improve overall system clarity.

  1. What Is a Use Case Diagram? – A Complete Guide to UML Modeling: An in-depth overview covering essential components, purposes, and best practices for requirements modeling.

  2. Step-by-Step Use Case Diagram Tutorial – From Beginner to Pro: A practical resource that guides users through foundational to advanced techniques for creating effective use case diagrams.

  3. All You Need to Know About Use Case Modeling: A comprehensive exploration of the principles and applications of use case modeling in system design.

  4. Visual Paradigm – Use Case Description Features: Details specialized tools used to precisely document user interactions and structured system behavior.

  5. Mastering AI-Driven Use Case Diagrams with Visual Paradigm: A tutorial on leveraging AI to create intelligent, dynamic diagrams for modern software systems.

  6. Guide to Using the Flow of Events Editor in Visual Paradigm: Step-by-step instructions for documenting structured event sequences within a use case scenario.

  7. Unraveling Scenarios with the Use Case Scenario Analyzer: A guide on using analyzers to examine and refine interaction flows for increased system clarity.

  8. Convert Use Case to Activity Diagram – AI-Powered Transformation: A resource explaining the automated conversion of use cases into detailed system workflows.

  9. Generating Scenarios and Test Cases from Use Case Diagrams Using AI: An exploration of how AI tools automate the creation of requirement-driven test procedures.

  10. Use Case Diagram Gallery – Templates & Examples: A curated collection of real-world examples for inspiration, learning, and rapid prototyping.