


In the fast-paced environment of modern software development, speed is often equated with value. However, speed without direction is merely movement. For Agile teams striving to deliver value continuously, the ability to predict and accelerate delivery is paramount. One of the most critical metrics for achieving this balance is cycle time. By measuring cycle time accurately, organizations can identify bottlenecks, improve flow, and ultimately optimize their release frequency without sacrificing quality.
This guide provides a comprehensive look at how to measure cycle time effectively, interpret the data, and use those insights to drive tangible improvements in your release cadence. We will explore the mechanics of flow, the distinction between related metrics, and the cultural shifts required to sustain high-velocity delivery.
Understanding Cycle Time in Agile Contexts ⏱️
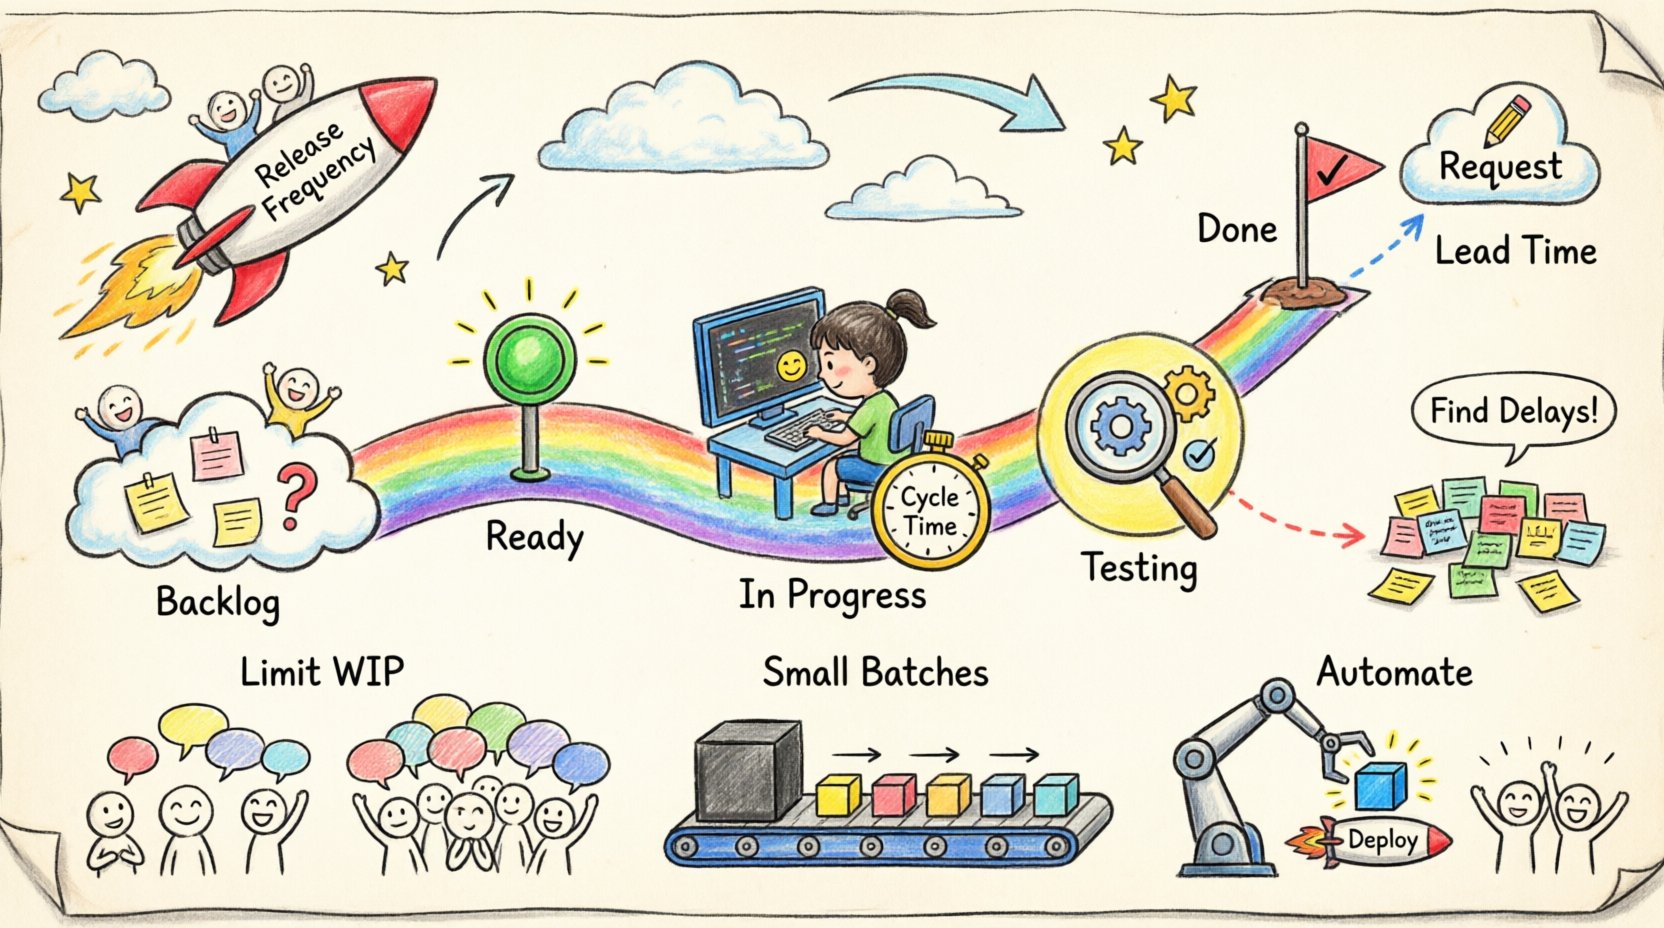
Cycle time is a fundamental metric in Agile and DevOps that measures the elapsed time from when work actually begins on a specific item to when it is ready for delivery. Unlike lead time, which measures the entire duration from the moment a request is made, cycle time focuses strictly on the production phase.
Defining the Start and End Points
To measure this accurately, you must establish clear definitions for your team. Ambiguity here leads to inconsistent data. The standard approach involves the following boundaries:
- Start: The moment work transitions from a “To Do” state to an “In Progress” state. This often aligns with the point where a team member begins coding, designing, or actively testing a task.
- End: The moment the work item meets the Definition of Done (DoD) and is available in the staging or production environment. It does not include the time the item sits in a “Ready for Review” state waiting for approval, unless your definition of done includes approval.
By tracking these specific timestamps, you gain visibility into the actual effort required to transform an idea into a working feature.
Why Cycle Time Matters for Release Frequency 📉
Release frequency is not just about how often you push code. It is about the reliability and predictability of those pushes. If cycle time is high and variable, your release schedule becomes a guess. If cycle time is low and consistent, you can commit to a release cadence with confidence.
Reducing cycle time offers several direct benefits:
- Reduced Risk: Smaller batches of code mean smaller changesets. If an issue arises, it is easier to isolate and revert.
- Faster Feedback: Delivering to users sooner allows you to validate assumptions early. You learn faster whether a feature provides value.
- Improved Morale: Teams feel a sense of accomplishment when they see work move quickly from start to finish. Long waits between completion and release can lead to frustration.
- Better Capacity Planning: Historical cycle time data allows managers to forecast when upcoming work will be completed based on actual performance rather than hope.
Distinguishing Between Key Flow Metrics 📊
Confusion often arises between cycle time, lead time, and throughput. While they are related, they serve different purposes in optimization. Understanding the difference is crucial for accurate analysis.
Cycle Time vs. Lead Time Table
Use the following comparison to clarify how these metrics interact within your workflow.
| Feature | Lead Time | Cycle Time |
|---|---|---|
| Start Point | When the request is created or received. | When work actually begins (In Progress). |
| End Point | When the customer receives the value. | When the work is ready for release. |
| Focus | Customer experience and wait time. | Team efficiency and production speed. |
| Optimization Goal | Reduce backlog wait time. | Reduce production and testing duration. |
The Relationship
Mathematically, Lead Time is often the sum of Wait Time (before work starts) and Cycle Time. Therefore, you can reduce Lead Time by either reducing the time work sits in a queue or by reducing the time it takes to process the work. Optimizing release frequency usually requires tackling both, but Cycle Time is the metric most directly under the control of the development team.
How to Measure Cycle Time Effectively 📝
Implementation of cycle time measurement does not require complex infrastructure. It requires discipline in data collection and a clear process. Follow these steps to establish a robust measurement system.
1. Establish a Single Source of Truth
All work items must be tracked in a central location. Whether this is a physical board or a digital system, every task needs a unique identifier. Consistency is key. If some tasks are tracked and others are not, your data will be skewed.
2. Define Workflow States
Map out your current workflow. Typical states include:
- Backlog: Work is identified but not started.
- Ready: Work is prioritized and ready to be pulled.
- In Progress: Work is actively being developed.
- Testing/Review: Work is being validated.
- Done: Work is deployed and verified.
Ensure the transition from “Ready” to “In Progress” is the trigger for your Cycle Time start clock.
3. Capture Timestamps Automatically
Manual entry of dates leads to human error. Configure your workflow to record the timestamp whenever an item moves between states. This ensures accuracy and reduces administrative overhead.
4. Aggregate Data Regularly
Do not look at cycle time for a single task. Look at trends over time. Calculate the average cycle time for a sprint, a month, or a quarter. This smooths out anomalies and reveals the true capacity of the team.
Analyzing Data to Identify Bottlenecks 🔍
Collecting data is only the first step. The value lies in analyzing that data to find inefficiencies. Here is how to interpret your cycle time measurements.
Identify High Variance
If your average cycle time is five days, but individual items range from one day to twenty days, you have high variance. This indicates instability. High variance makes planning difficult and suggests that some tasks are getting stuck.
Look for Stage-Specific Delays
Break down cycle time by stage. For example, does work spend more time in “Testing” than in “Development”? If so, your testing process is likely the bottleneck. You might need more automated tests, more testers, or earlier involvement of QA in the development process.
Segment by Work Type
Not all work is created equal. Bugs, features, and technical debt often have different cycle times. Segment your data to see if:
- Small tasks are moving faster than large ones.
- Complex features are taking disproportionately longer.
- Urgent work is disrupting the normal flow.
Strategies to Optimize Release Frequency 🛠️
Once you have measured and analyzed your cycle time, you can implement strategies to reduce it and increase release frequency. These strategies focus on flow efficiency and system design.
Limit Work In Progress (WIP)
WIP limits are a core principle of Kanban. By restricting the number of items in “In Progress” at any given time, you force the team to finish current work before starting new work. This reduces context switching and keeps the flow steady.
- Benefit: Focuses attention on completion rather than initiation.
- Action: Set a limit on how many items can be “In Progress” per developer or per column.
Break Down Work into Smaller Batches
Large items take longer to complete and are harder to test. Breaking a large feature into smaller, independent increments allows for earlier delivery.
- Benefit: Reduces the risk of failure and shortens the cycle time for each increment.
- Action: Refine backlog items until they can be completed within a single sprint or even a single day.
Automate the Pipeline
Manual steps are where delays accumulate. Automated testing, automated deployment, and automated provisioning remove human latency.
- Benefit: Ensures consistent quality checks and instant feedback loops.
- Action: Review your deployment pipeline for manual gates. Replace them with automated checks where possible.
Improve Definition of Done (DoD)
Ensure your Definition of Done is realistic and achievable. If the DoD is too complex, it inflates cycle time. If it is too vague, it leads to rework, which also inflates cycle time.
- Benefit: Clear standards prevent work from looping back for fixes.
- Action: Review the DoD with the team regularly to ensure it reflects the current reality of the codebase.
The Impact of Culture on Cycle Time 🤝
Metrics do not exist in a vacuum. They reflect the culture of the organization. A culture of blame will distort data, while a culture of learning will improve it.
Psychological Safety
Teams must feel safe admitting when they are stuck or when a task is taking longer than expected. If they fear punishment, they will hide delays until it is too late. This makes cycle time data inaccurate and prevents early intervention.
Feedback Loops
Short cycle times create short feedback loops. This requires a culture that values feedback over ego. When a feature is released quickly, the team must be ready to receive feedback from users and stakeholders and act on it immediately.
Continuous Improvement
Optimizing release frequency is not a one-time project. It is a continuous process. Regular retrospectives should focus on flow metrics. Ask: “Why did this item take longer than expected?” and “How can we prevent this next time?”
Common Pitfalls to Avoid 🚫
While optimizing, teams often fall into traps that reduce value or distort metrics. Be aware of these common issues.
1. Optimizing for the Metric
Do not incentivize teams solely on cycle time. If you reward speed, teams might cut corners on quality, leading to technical debt. This increases cycle time later when fixing bugs.
2. Ignoring External Dependencies
Sometimes cycle time is high because of factors outside the team’s control, such as waiting on a third-party API or a vendor. Measure these waits separately so they do not skew your internal performance data.
3. Neglecting Technical Debt
If you focus only on new features, technical debt accumulates. This debt slows down future development. Allocate capacity for maintenance and refactoring to keep cycle time sustainable.
4. Vanity Metrics
Average cycle time can be misleading. A single outlier task can skew the average. Look at percentiles instead. For example, the 85th percentile cycle time tells you how long the slowest 15% of tasks take, which is often more useful for planning.
Final Thoughts on Sustainable Velocity 🏁
Measuring cycle time is not about pushing teams to work faster. It is about making the system work better. When you remove friction, reduce batch sizes, and automate repetitive tasks, speed becomes a natural outcome of a healthy process.
Optimizing release frequency is a journey. It requires patience, data, and a willingness to adapt. By focusing on the flow of value rather than the output of hours, you create an environment where high-velocity delivery is sustainable.
Start by measuring your current state. Understand your baseline. Then, implement small changes. Monitor the impact. Iterate. Over time, you will see a reduction in cycle time and a corresponding increase in the frequency and quality of your releases.
Remember, the goal is not just to ship code. The goal is to deliver value to your users reliably. Cycle time is the compass that guides you there.