


When learning software engineering or system design, you will encounter various types of diagrams. Among them, the Object Diagram stands out as a specific view of a system. Unlike general flowcharts, this diagram captures the state of a system at a precise moment. It is a static snapshot. This guide provides a clear, deep dive into what these diagrams are, how to read them, and how to build them without unnecessary complexity.
🔍 What is an Object Diagram?
An Object Diagram is a type of UML (Unified Modeling Language) diagram. It shows a snapshot of detailed states at a point in time. Think of it as a photograph of a running system. While a Class Diagram shows the blueprint (the plan), an Object Diagram shows the actual data living in the system right now.
- Class Diagram: Defines the types of things (e.g., User, Order).
- Object Diagram: Defines specific instances (e.g., user_001, order_554).
This distinction is crucial for students. You use class diagrams to design the structure. You use object diagrams to verify that structure works with real data.
🧱 Core Components and Syntax
To read or create these diagrams, you must understand the visual language. Every element follows strict rules. Deviating from these rules makes the diagram unreadable to other engineers.
1. The Object Instance
Objects appear as rectangles. Inside the rectangle, you will find specific text formatting:
- Object Name: Written in italics and underlined. Example: john_doe.
- Class Name: Appears below the object name, separated by a colon. Example: john_doe : User.
- Attributes: Listed below the class name. These hold current values.
2. Attributes and Values
Attributes in an object diagram are not just types; they are values. If a class defines name: String, the object diagram must show the actual data, such as name: “Alice”.
- Visibility: You can use symbols like
+for public or-for private. - Data Types: Include the type next to the value if necessary (e.g.,
age: 25). - Null Values: If a value is missing, it is often represented as
nullor left blank depending on the standard.
3. Relationships and Associations
Objects connect to other objects. These lines represent relationships. They are similar to those in class diagrams but represent specific links between instances.
- Association: A line connecting two objects. It implies they know about each other.
- Multiplicity: Numbers at the ends of the lines. They indicate how many objects can connect. Examples:
1,0..1,1..*. - Role Name: Text on the line describing the relationship (e.g., owns, manages).
📊 Class Diagram vs. Object Diagram
Students often confuse these two. A comparison table helps clarify the differences quickly.
| Feature | Class Diagram | Object Diagram |
|---|---|---|
| Focus | Structure and Blueprint | Specific Instances and Data |
| Time | Timeless (Static Plan) | Snapshot (Point in Time) |
| Names | Class Names (Bold, Uppercase) | Instance Names (Italic, Lowercase) |
| Attributes | Types (e.g., int) | Values (e.g., 42) |
| Usage | Design Phase | Testing, Debugging, Documentation |
🛠️ How to Construct an Object Diagram
Building a diagram requires logical steps. You do not need software to do this; you need a clear mind and a grid. Follow this process.
Step 1: Identify the Scenario
Define the specific situation you are modeling. Are you modeling the start of a transaction? The end of a login? The state of a shopping cart? The scenario dictates which objects appear.
Step 2: Select the Objects
Identify the instances that exist in this scenario. Do not include every class in the system. Only include the ones relevant to the current state. If you are modeling a completed order, the Payment object exists. The Cart object might be empty or gone.
Step 3: Define Relationships
Draw lines between the objects. Ensure the lines match the rules defined in your Class Diagram. If a Class Diagram says a User can have many Orders, the Object Diagram must reflect valid multiplicities (e.g., one User object connected to three Order objects).
Step 4: Assign Values
Fill in the attributes. Ensure data types match. Ensure values make sense logically. For example, a Date attribute should look like a date, not random text.
Step 5: Review Multiplicities
Check the ends of the association lines. Do they match the constraints of the system? If a relationship requires exactly one item, but you draw two, the diagram is incorrect.
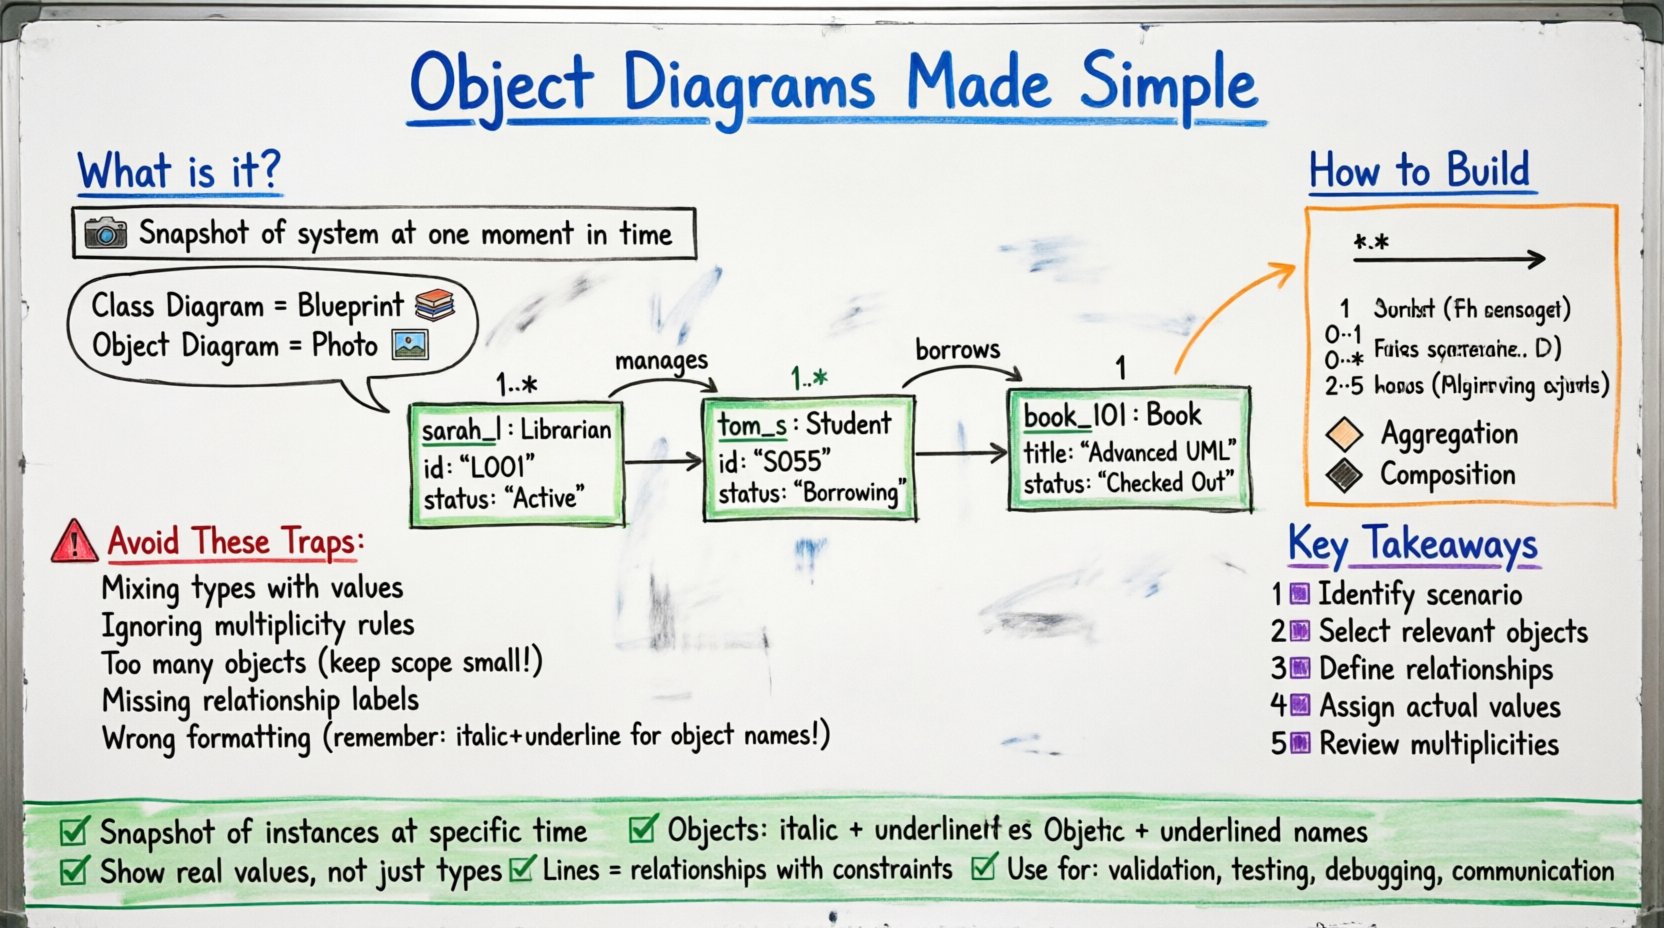
🌍 Real-World Example: A Library System
Let us look at a concrete example to solidify understanding. Imagine a library system. We need to model a specific morning when the library opens.
The Scenario
A librarian named Sarah logs in. She has assigned a book to a student named Tom. The book is currently checked out.
The Objects
- sarah_l : Librarian
- tom_s : Student
- book_101 : Book
The Attributes
- sarah_l:
id: "L001",status: "Active" - tom_s:
id: "S055",status: "Borrowing" - book_101:
title: "Advanced UML",status: "Checked Out"
The Connections
- Line from sarah_l to tom_s labeled manages (Multiplicity: 1..* on student side).
- Line from tom_s to book_101 labeled borrows (Multiplicity: 1 on book side).
This visual representation tells us exactly what is happening. We see Sarah, Tom, and the Book. We see their specific IDs. We see the relationship between them. This is more informative than text alone.
🚫 Common Mistakes to Avoid
Even experienced designers make errors. As a student, avoiding these traps will improve your grades and your design skills.
- Mixing Types: Do not put Class attributes next to Object values. Keep them distinct.
- Ignoring Multiplicity: Ensure the number of objects matches the allowed range in the Class Diagram.
- Too Many Objects: An Object Diagram can get messy quickly. Limit the scope. Do not show the entire database in one view.
- Missing Labels: Always label the lines. An unlabeled line is ambiguous.
- Incorrect Formatting: Remember: Object names are italicized and underlined. Class names are bold.
🔗 Understanding Multiplicities in Depth
Multiplicities are the math of your diagram. They define constraints. Here is a breakdown of common symbols.
- 1: Exactly one instance. There is one and only one.
- 0..1: Zero or one instance. It is optional, but if it exists, there is only one.
- 1..*: One or more instances. Mandatory, and can be many.
- 0..*: Zero or more instances. Optional, and can be many.
- 2..5: A specific range. Between two and five instances.
When drawing, place these numbers at the end of the association line nearest to the class it describes. This tells the reader how many of that specific class can link to the other.
📈 Why Object Diagrams Matter
Why spend time drawing these? They are not just homework exercises. They serve practical purposes in software development.
1. Validation
Before writing code, you can check if your logic holds up. If a diagram shows a User connected to 500 Orders without a limit, you might realize you need to add a constraint to the database schema.
2. Communication
Stakeholders often struggle with abstract class diagrams. A diagram showing specific data instances is often easier for non-technical people to understand. It shows “what it looks like,” not just “how it is built.”
3. Testing
Test engineers use object diagrams to define test cases. If a test case requires a specific state, the object diagram defines that state precisely. It becomes a checklist for validation.
4. Debugging
When a bug occurs, the system state is broken. Drawing the state at the time of the bug helps trace the issue. You can compare the expected object diagram with the actual data.
🛑 Static vs. Dynamic Views
It is important to know where this diagram fits in the larger picture. UML has many diagrams. Some show behavior (Dynamic), and some show structure (Static).
- Static Structure: Class Diagram, Object Diagram, Component Diagram.
- Dynamic Behavior: Sequence Diagram, State Machine Diagram, Activity Diagram.
The Object Diagram is a Static Structure diagram. It does not show movement. It does not show time passing. It freezes time. This is its unique strength and its limitation. It is not a flowchart.
✅ Best Practices for Students
To ensure your work is professional and clear, follow these guidelines.
- Keep it Clean: Avoid crossing lines if possible. Use orthogonal lines (right angles) instead of slanted lines.
- Consistency: Use the same font and style throughout the document.
- Documentation: If a relationship is complex, add a note outside the diagram to explain it.
- Scope Control: If the diagram is too large, split it into multiple views (e.g., one for Users, one for Orders).
- Naming Conventions: Stick to a consistent naming convention for objects. Use prefixes like
obj_orinst_if needed for clarity.
🧩 Advanced Relationships: Aggregation and Composition
Standard associations are simple lines. However, some relationships involve ownership or part-whole structures. These require specific symbols.
Aggregation
Aggregation implies a “whole-part” relationship where the parts can exist independently. Visually, this is a line with a hollow diamond at the whole end.
- Example: A Department and Professors. If the Department closes, Professors still exist.
Composition
Composition is a stronger form of aggregation. The parts cannot exist without the whole. Visually, this is a line with a filled diamond at the whole end.
- Example: A House and Rooms. If the House is destroyed, the Rooms cease to exist as part of that house.
When drawing these in an Object Diagram, ensure the diamonds are placed on the side of the “Whole” object. This clarifies the dependency structure visually.
📝 Summary of Key Takeaways
Reviewing the core points ensures you retain the information. Here is a quick recap of the essential concepts.
- Definition: A snapshot of instances at a specific time.
- Visuals: Objects are italicized and underlined.
- Attributes: Show actual values, not just types.
- Relationships: Lines with multiplicities define constraints.
- Use Case: Validation, testing, and documentation.
- Comparison: Distinct from Class Diagrams which show blueprints.
Mastering these concepts provides a solid foundation for system design. You move from abstract planning to concrete verification. This transition is vital for creating robust software systems.