Implementing Agile methodologies is often viewed as a strategic shift rather than a simple IT project. However, leadership teams require concrete evidence to justify the investment. Calculating the Return on Investment (ROI) for Agile transformation initiatives demands a nuanced approach that goes beyond simple financial metrics. It requires understanding the balance between tangible cost savings and intangible value gains. This guide provides a comprehensive framework for evaluating the financial and operational impact of adopting Agile practices.
Agile ROI is not merely about counting dollars saved today. It involves forecasting reduced time-to-market, improved product quality, and enhanced employee engagement. By breaking down the costs and benefits systematically, organizations can make informed decisions about their transformation journey. This document outlines the essential components of Agile financial analysis, ensuring stakeholders see the full picture of value creation.
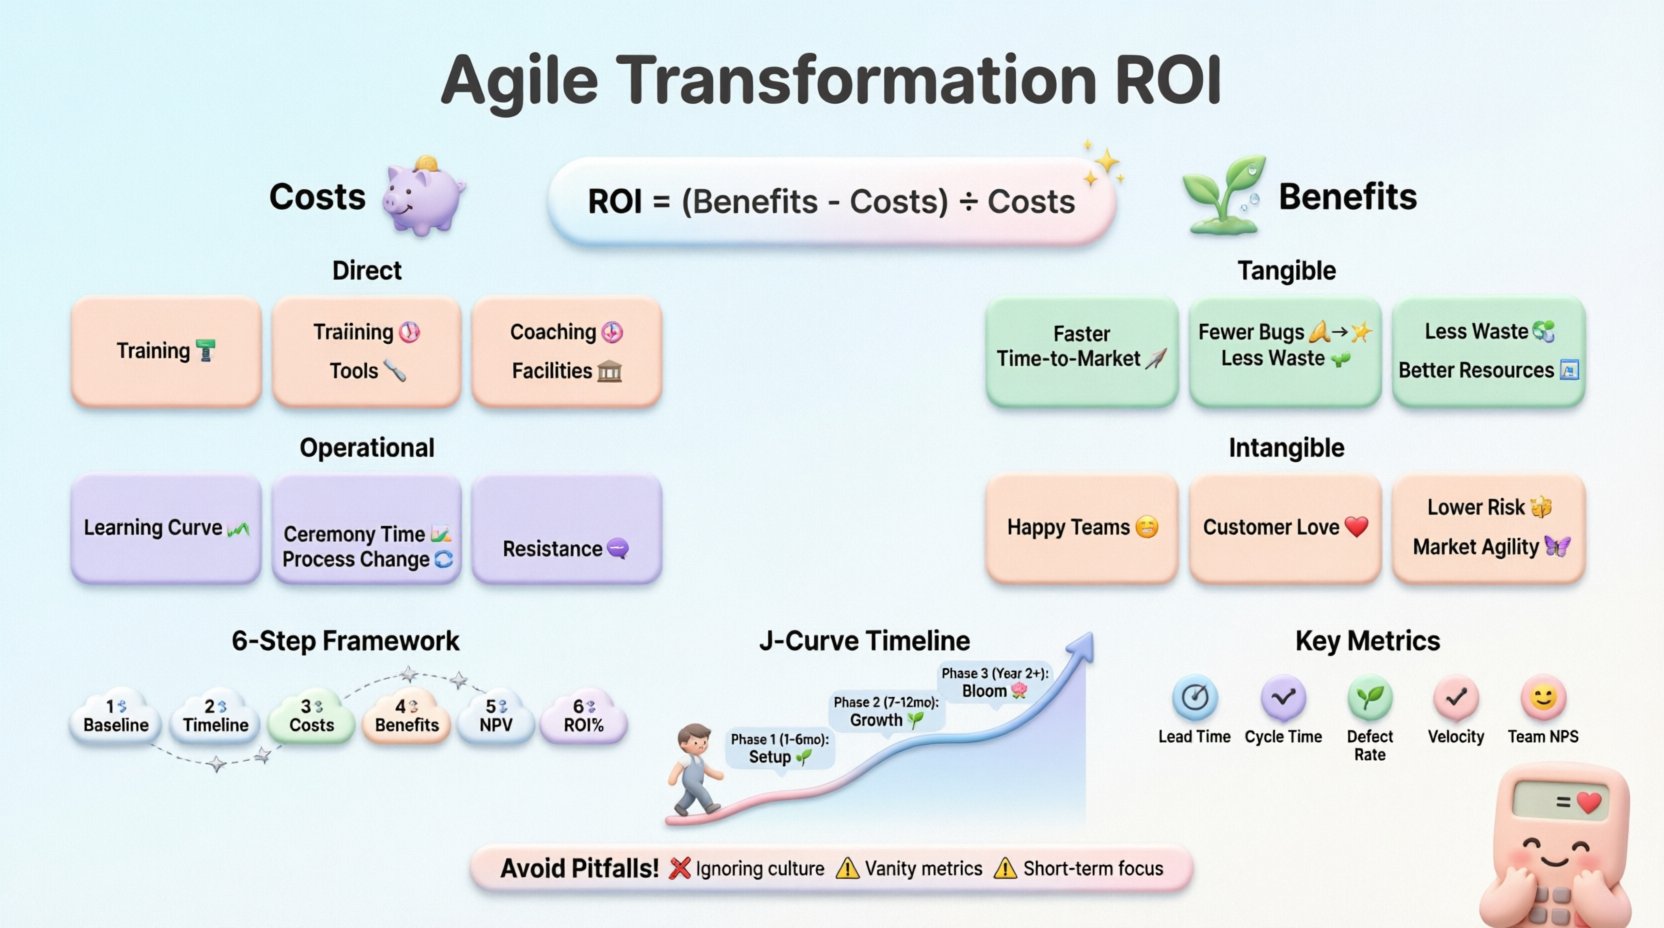
🔍 Understanding the Agile Value Equation
Traditional ROI calculations often fail in Agile contexts because they focus on fixed scope and timeline. Agile prioritizes flexibility and adaptation. Therefore, the value equation must account for variable outputs and continuous feedback loops. The core formula remains Net Benefits divided by Costs, but the inputs require deeper scrutiny.
When assessing Agile initiatives, consider the following components:
- Initial Investment: Training, coaching, and tooling setup.
- Ongoing Costs: Retention of Agile coaches, facilitation time, and ceremony overhead.
- Direct Benefits: Reduced waste, faster delivery, and lower defect rates.
- Indirect Benefits: Improved morale, better stakeholder alignment, and innovation capacity.
Calculating these variables requires a clear baseline. You cannot measure improvement without knowing the starting point. Historical data on project delivery speed, budget overruns, and quality issues serves as the foundation for comparison. Without this baseline, the ROI calculation lacks credibility.
💰 Identifying Costs in Agile Transformations
Costs in Agile transformation are often underestimated because they include significant hidden expenses. Unlike waterfall projects where costs are mostly labor-based, Agile introduces new operational layers. These must be quantified accurately to avoid skewed results.
Direct Financial Expenditures
- Training and Certification: Workshops, courses, and certification exams for staff.
- External Coaching: Fees for experienced Agile consultants to guide teams.
- Tooling and Infrastructure: Licenses for collaboration platforms and project management systems.
- Facilities: Costs associated with reorganizing physical workspaces for collaboration.
Operational and Opportunity Costs
- Learning Curve: Productivity dips during the initial adoption phase.
- Ceremony Time: Time spent in planning, review, and retrospective meetings instead of coding.
- Process Re-engineering: Effort required to map new workflows onto existing systems.
- Resistance Management: Time leaders spend addressing cultural pushback.
Tracking these costs requires a dedicated budget line item. They should be recorded over a defined period, typically 12 to 24 months, to capture the full transformation lifecycle. Aggregating these figures provides the denominator for your ROI formula.
📈 Measuring Benefits and Value Realization
Benefits in Agile are often realized over time rather than immediately. Some are financial, while others are strategic. A robust calculation model captures both. Categorizing benefits helps in communicating value to different stakeholders, from CFOs to Product Owners.
Tangible Financial Benefits
- Reduced Time-to-Market: Faster releases generate revenue earlier. Calculate the value of accelerated launch dates based on projected sales.
- Lower Defect Costs: Fewer bugs mean less money spent on hotfixes and support tickets. Historical cost per bug can be multiplied by the reduction rate.
- Decreased Scope Waste: Agile prevents building features that are not needed. Savings come from not developing unused functionality.
- Resource Optimization: Better visibility into workload reduces overallocation and idle time.
Intangible Strategic Benefits
- Employee Retention: Teams with autonomy report higher satisfaction. Reduced turnover saves recruitment and training costs.
- Customer Satisfaction: Frequent feedback loops lead to products that better match user needs.
- Risk Mitigation: Early detection of issues prevents catastrophic failures later in the lifecycle.
- Market Responsiveness: The ability to pivot quickly based on market shifts provides a competitive edge.
Assigning monetary values to intangible benefits requires estimation. For example, calculate the cost of turnover per employee and apply it to the expected reduction in attrition rates. While these figures are estimates, they add necessary weight to the business case.
🧮 The Calculation Framework
To ensure consistency, use a standardized framework. This allows for repeatable analysis across different departments or projects. The following steps outline the process for a comprehensive ROI analysis.
- Define the Baseline: Gather data on current performance metrics (cycle time, cost per feature, defect density).
- Set the Projection Period: Decide on the timeframe, usually 12 to 36 months.
- Quantify Costs: Sum all direct and indirect expenses associated with the transformation.
- Estimate Benefits: Project improvements in metrics and assign financial values.
- Calculate Net Present Value (NPV): Discount future cash flows to present value to account for the time value of money.
- Determine ROI Percentage: Use the standard formula to derive the final percentage.
Key Metrics for ROI Analysis
| Metric | Definition | Impact on ROI |
|---|---|---|
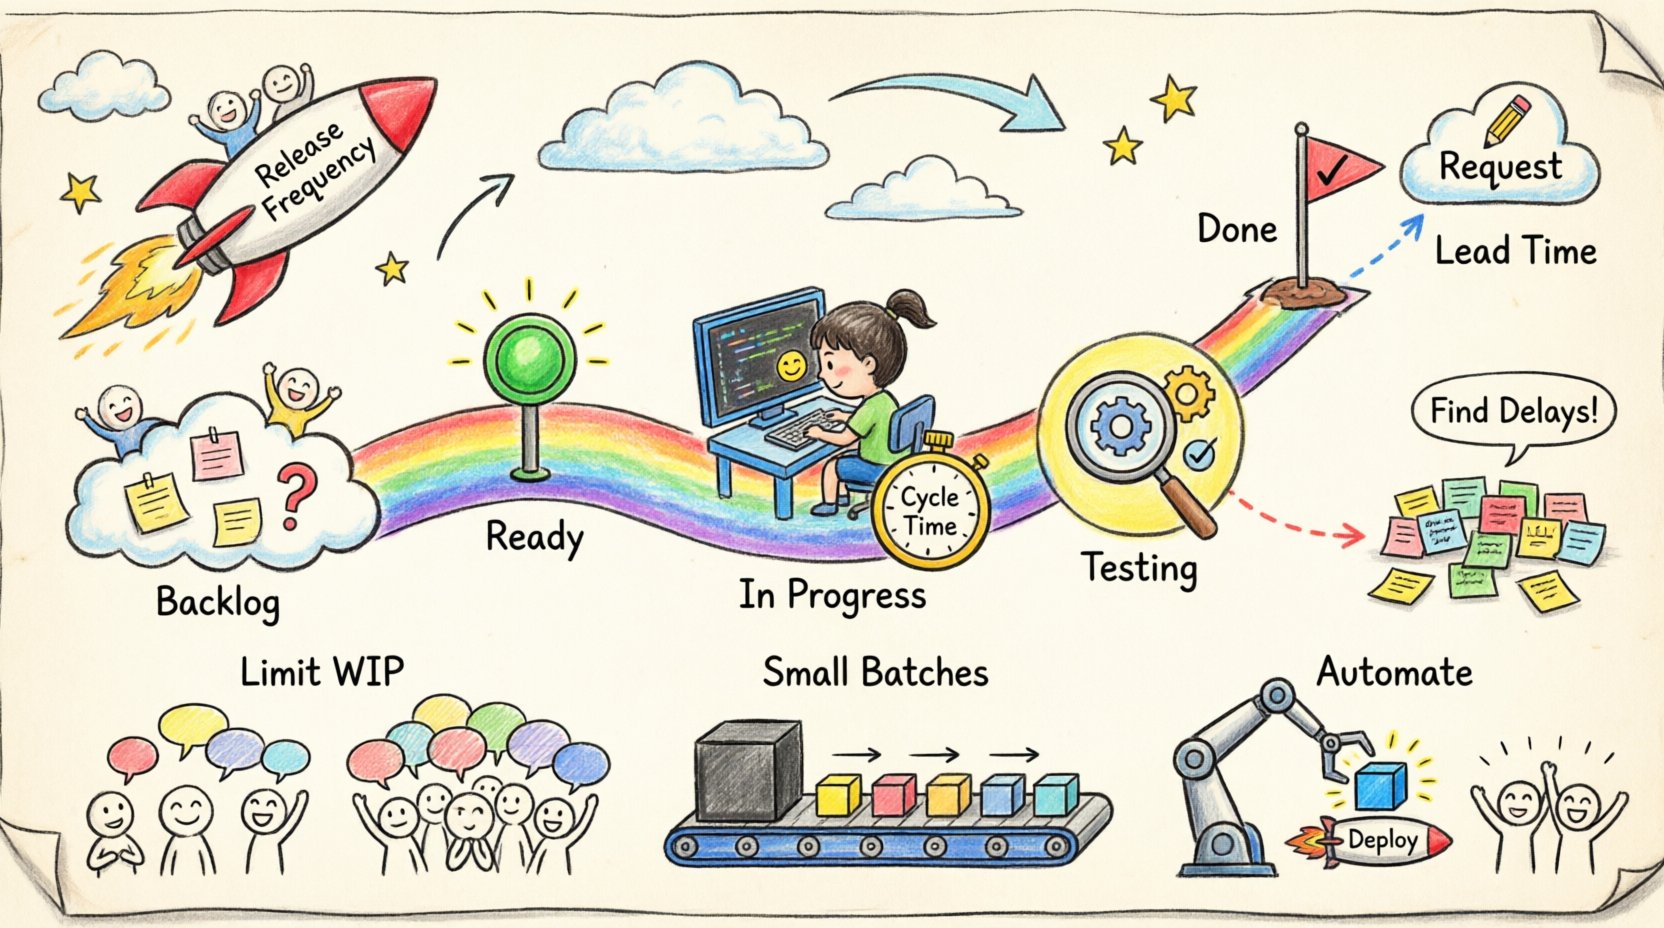
| Lead Time | Time from request to delivery | Shorter lead times increase revenue velocity. |
| Cycle Time | Time from start to finish of work | Reduced cycle time lowers operational costs. |
| Defect Escape Rate | Bugs found in production vs. testing | Lower rates reduce post-release fix costs. |
| Velocity | Work completed per iteration | Stable velocity aids in accurate forecasting. |
| Employee Net Promoter Score | Measure of employee satisfaction | Higher scores correlate with lower turnover costs. |
Using this table ensures you are tracking the right indicators. Each metric contributes to the overall financial picture. Focusing on the wrong metrics can lead to misleading ROI figures.
⚠️ Common Pitfalls in Agile ROI
Even with a solid framework, errors can occur. Awareness of common mistakes helps refine the calculation. These pitfalls often stem from applying traditional project management logic to Agile environments.
- Ignoring Cultural Costs: Transformation is a people initiative. Underestimating the cost of change management skews results.
- Overlooking Opportunity Costs: Focusing only on direct savings misses the value of faster innovation.
- Using Vanity Metrics: Tracking story points without context leads to inflated productivity claims.
- Short-Term Focus: Expecting immediate returns from Agile ignores the maturation curve of the methodology.
- Blaming the Process: If ROI is low, blaming Agile rather than implementation quality prevents learning.
Avoiding these traps requires discipline and honesty in data reporting. It is better to present a conservative estimate than an inflated one that cannot be delivered later.
🔄 Long-Term vs. Short-Term Value
Agile ROI often exhibits a J-curve pattern. Initial investment costs are high, while benefits lag. Over time, as teams mature, efficiency gains compound. Understanding this dynamic is crucial for stakeholder management.
During the first year, costs may outweigh benefits. This is normal. The organization is building capabilities. By year two or three, the efficiency gains should begin to outpace the initial investment. Stakeholders need to understand this timeline to maintain support.
Break down the value realization into phases:
- Phase 1 (Months 1-6): Setup and Training. High cost, low benefit.
- Phase 2 (Months 7-12): Stabilization. Moderate cost, emerging benefit.
- Phase 3 (Year 2+): Optimization. Lower cost, high benefit.
Communicating this roadmap helps manage expectations. It frames the initial loss as a strategic investment rather than a failure. Patience is a key component of successful Agile adoption.
🗣️ Reporting to Stakeholders
Once the calculation is complete, the next challenge is communication. Different audiences require different levels of detail. The CFO needs hard numbers, while the CTO cares about technical debt reduction.
Effective reporting involves:
- Visual Dashboards: Use charts to show trends over time. Visuals make data more digestible.
- Contextual Narratives: Explain the numbers. Why did velocity improve? Why did defects drop?
- Comparisons: Show before-and-after scenarios to highlight progress.
- Risk Adjustments: Acknowledge uncertainties in the projections to build trust.
Transparency builds confidence. If the data shows a dip in performance, explain the cause. Hiding negative data erodes trust. Honest reporting ensures long-term buy-in for the transformation.
🛠️ Implementation Steps for Measurement
To put this into practice, follow these actionable steps. This checklist ensures nothing is overlooked during the measurement process.
- Establish a Governance Committee: Form a group responsible for tracking metrics and validating data.
- Define Data Collection Methods: Decide how you will capture time, cost, and quality data.
- Set Up Baseline Reports: Generate reports from the pre-transformation period.
- Conduct Regular Reviews: Schedule quarterly reviews to update ROI calculations.
- Adjust for External Factors: Account for market changes that might influence results.
- Document Lessons Learned: Record what worked and what didn’t for future reference.
Consistency is key. If you change the measurement method mid-stream, the data becomes invalid. Stick to the agreed-upon metrics for the duration of the project.
🌱 Sustaining the Momentum
Agile transformation is an ongoing journey, not a destination. ROI calculation should evolve as the organization matures. As teams become more autonomous, the cost structure changes. Coaching costs may decrease, while innovation value may increase.
Continuous improvement applies to the measurement process itself. Regularly review the metrics to ensure they still align with business goals. If a metric no longer drives value, replace it. This agility in measurement mirrors the Agile principles being practiced.
Remember that the goal is not just to calculate ROI, but to improve it. Use the insights gained to refine processes, reduce waste, and enhance delivery. The calculation is a tool for learning, not just a scorecard.
🏁 Final Thoughts on Agile Financials
Calculating the return on investment for Agile transformation requires a balance of financial rigor and contextual understanding. It involves identifying hidden costs, quantifying intangible benefits, and managing stakeholder expectations over the long term. By adhering to a structured framework and avoiding common pitfalls, organizations can demonstrate the true value of their initiatives.
The data supports the shift. Organizations that embrace Agile practices consistently report higher efficiency and better product outcomes. The challenge lies in measuring this accurately and communicating it effectively. With the right approach, ROI becomes a catalyst for further improvement rather than a barrier to entry.