你准备好革新你的数据库设计工作流程了吗?创建一个专业的实体关系图过去需要数小时的手动形状拖拽和细致的连接绘制。现在不再如此!借助集成在AI 驱动的 ERD 制作工具中的Visual Paradigm,你就可以生成实体关系图模型,只需几秒钟。无论你是在构建复杂的图书馆系统还是高流量的零售库存系统,这个易于使用的绘图工具利用先进的智能处理繁重任务,让你专注于高层次架构设计,而非手动格式化!
AI 驱动建模的关键要点
-
即时模型转换:将自然语言需求转化为精确的数据库模式。
-
符合标准的表示法:自动使用正确的 Crow’s Foot 或 IDEF1X 表示法来表示实体和关系。
-
快速探索:只需调整你的文本提示,即可测试不同的架构场景。
-
完全可编辑性:每个生成的元素都是原生的 Visual Paradigm 对象,可随时进行手动优化。
核心工作流程:如何使用 AI 生成实体关系图
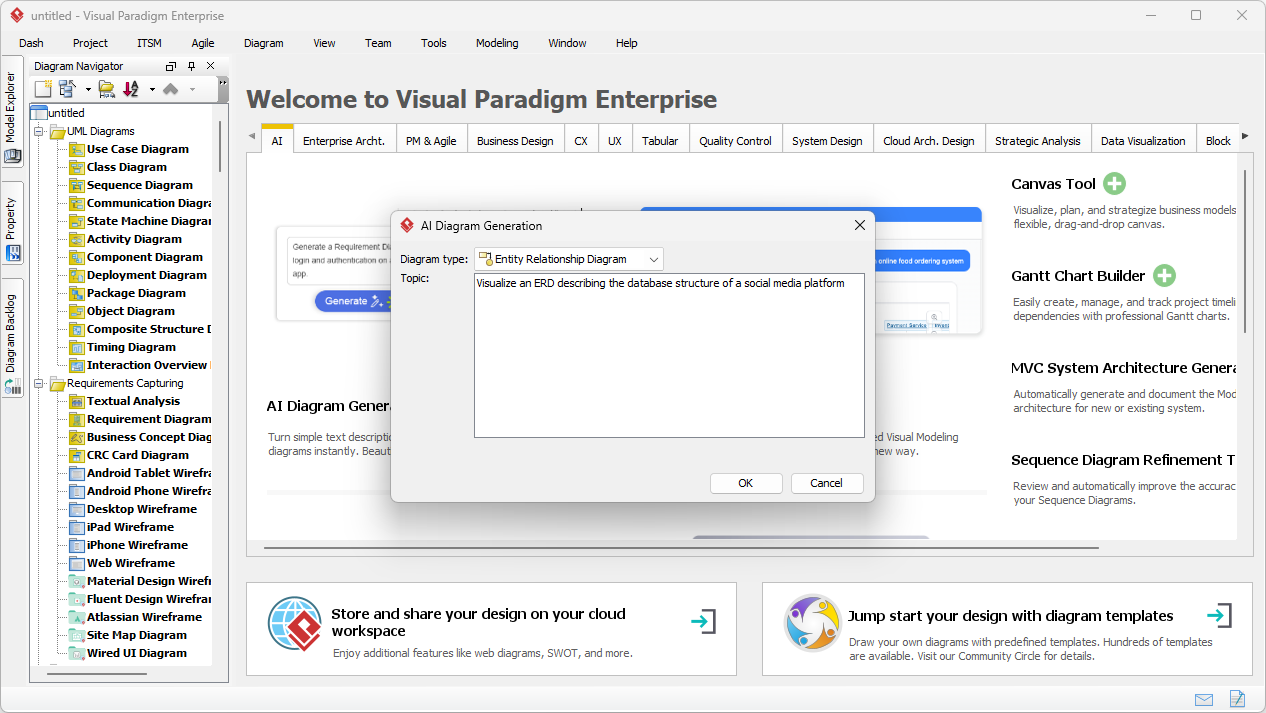
通往完美数据库模型的旅程始于 Visual Paradigm Desktop 的强大环境中。要启动这一神奇过程,只需进入主菜单并选择工具 > AI 图形生成。这将打开一个专用门户,将你的口头描述转化为结构蓝图。对于任何重视效率的软件工程师或数据架构师而言,这都是最理想的起点!
一旦生成窗口出现,你将看到一个专为最大化生产力而设计的简洁界面。首先,请确保已从实体关系图下拉菜单中选择了。接下来,将你的描述性提示输入到主题字段中。以我们的示例为例,我们提供了非常具体的要求:“一个图书馆管理 ERD,用于定义书籍、成员和借阅之间的关系。” 这种清晰度使专业的AI绘图软件 在无需进一步指示的情况下推断出必要的实体,如ISBN、到期日期和会员类型!
分析智能输出
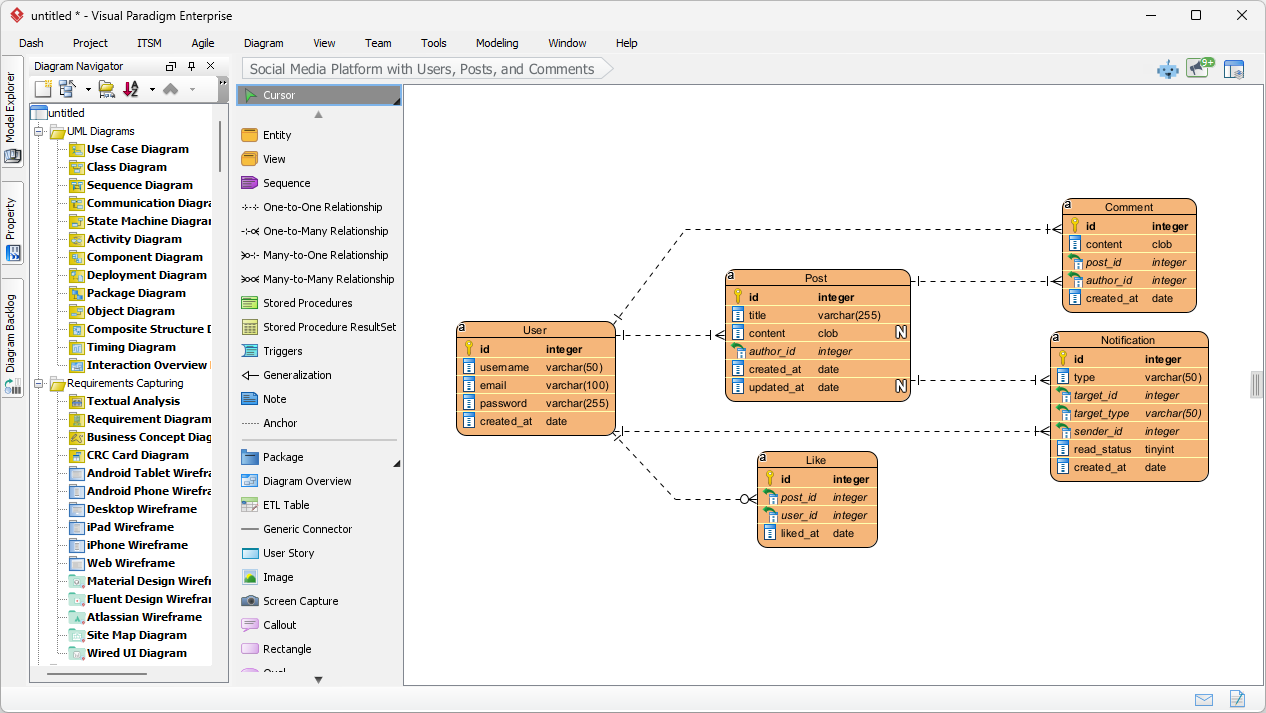
点击“确定”后,AI驱动的设计工具会对您的文本进行深度分析,并构建一个全面的模型。在我们的图书馆管理场景中,AI成功识别并创建了诸如CatalogEntry、Book、BookCopy、Member 和 Loan等实体。它甚至智能地建议了诸如Fine、Payment、Staff 和 OverdueRecord的支持性表格,以确保系统逻辑完整。每个主键、外键和基数连接都精确放置,为您的数据库文档提供了坚实的基础。
此功能最强大的方面之一是结果并非静态图像,而是一个完全集成且可编辑的模型。您可以立即进行“微调”,以使图表符合您的特定项目需求。无论您需要重命名属性、添加新实体,或修改关系类型——例如将连接更改为一对一关系——直观的界面允许您使用资源目录和编辑工具进行无缝的手动调整。
结论:提升您的设计策略
通过选择生成实体关系图使用Visual Paradigm的前沿AI生成模型,您不仅节省了时间;更确保从第一次点击起,您的文档就遵循行业最佳实践。这款专业AI驱动的ERD工具弥合了概念需求与技术实现之间的差距,使其成为最易于使用的软件现代开发团队的最佳选择。今天就体验可视化建模的未来,让您的创造力引领方向!
准备好改变您的工作流程了吗?
通过下载Visual Paradigm的最新版本,释放您设计流程的全部潜力。点击下方链接,开始使用世界上最先进的AI绘图应用.
下载Visual Paradigm桌面版: https://www.visual-paradigm.com/download/
相关链接
实体-关系图(ERD)是数据库设计和数据建模的基础工具,用于通过定义数据库设计和数据建模,通过定义实体、属性及其相互关系来可视化信息系统的静态结构。实体、属性及其交互关系。Visual Paradigm 提供了功能丰富的ERD 工具——既可在桌面端使用,也可在云端使用,支持多种标准,包括陈氏记法,以促进精确的模式开发。平台的现代功能现在包括人工智能驱动的功能,可从自然语言描述中即时生成可编辑的 ERD,或通过逆向工程现有数据库,显著简化了实施工作流程.
-
什么是实体-关系图(ERD)?——Visual Paradigm 指南:一份全面的资源,涵盖现代数据库建模中 ERD 的组成部分、记法及其重要性。
-
Visual Paradigm ERD 工具——在线创建实体-关系图:详细介绍了一款功能强大的基于网络的编辑器,专为直观的拖放式设计复杂数据库模式而打造。
-
如何使用 ERD 建模关系型数据库——Visual Paradigm 教程:一份实用的逐步教程,指导用户从概念数据建模到最终实现。
-
使用 ERD 工具进行数据库设计——Visual Paradigm 指南:探讨构建可扩展、稳健数据库的最佳实践,并实现不同开发阶段模型的同步。
-
AI 图表生成器新增图表类型:DFD 与 ERD:关于最新人工智能功能的信息,可让用户通过简单的文本提示自动生成结构化的 ERD。
-
通过 Visual Paradigm 简化实体-关系建模:深入探讨如何利用可视化建模工具,从最初的数据概念高效过渡到实现阶段。