


Introduction: The Evolving Role of UML Activity Diagrams in Modern Software Development
UML Activity Diagrams represent one of the most powerful and expressive forms of behavioral modeling in the Unified Modeling Language (UML). Unlike static structure diagrams such as class or component diagrams, activity diagrams focus on the dynamic behavior of systems—how processes unfold, decisions are made, and workflows progress over time.
Originally conceived as a way to model business processes and software workflows in a formal yet intuitive manner, UML activity diagrams have evolved into a foundational tool for bridging the gap between high-level business requirements and detailed system logic. Today, they are integral to requirements analysis, user experience design, process automation, and even algorithmic workflow specification.
Core Concepts and Structural Semantics of UML Activity Diagrams
At its foundation, an activity diagram is a flow-based representation of a sequence of actions, decisions, and events. It uses a well-defined symbolic vocabulary to represent process elements in a way that is both visually clear and semantically rigorous.
Initial Node (●): Marks the starting point of the workflow. This is a filled black circle and typically appears at the top-left of the diagram, signaling where the process begins—such as a user initiating a booking or a system receiving a request.
- Action Nodes (Rounded Rectangles): Represent executable tasks or activities. These can be user actions (e.g., “Select Room Type”) or system operations (e.g., “Validate Check-in Date”). Each action is a discrete step that contributes to the overall process.
- Control Flow (Arrows →): Directed edges represent the sequence of execution. These flows determine the order in which steps occur, allowing for linear progression, conditional branching, or parallel execution.
- Decision Nodes (◇): Diamonds represent branching logic based on conditions. For instance, “Is Check-in Date Before Check-out Date?” triggers paths for valid or invalid inputs. Guards—Boolean expressions written on edges—provide precise conditions that influence flow direction.
- Merge Nodes (◇): Reunite multiple incoming flows after branching. Though often implicit in simple processes, they are critical when multiple parallel or conditional paths merge back into a single flow (e.g., after a customer submits a form with multiple options).
- Fork and Join Nodes (Horizontal Bars): Enable the modeling of concurrent processes. A fork splits a single flow into parallel sub-processes (e.g., validating payment and booking room simultaneously), while a join synchronizes them into a unified outcome. These are especially relevant in distributed systems or complex transactional workflows.
- Final Node (⊙): A circled black dot marks the end of the activity. This could represent completion, system response, or failure. In some cases, a final node may be omitted if process termination is implied by context.
- Swimlanes or Partitions: Vertical or horizontal lanes divide the workflow by responsibility or role (e.g., “User”, “System”, “Payment Gateway”). This improves readability in complex systems and enables stakeholder alignment on process ownership.
- Object Nodes, Pins, and Exception Flows: Objects represent data or entities (e.g., “Reservation Object”) that may be created, modified, or destroyed. Pins allow for parameter passing between actions. Exception flows (often shown with dashed lines) model error conditions such as invalid input, network failures, or system errors.
These elements are not arbitrary—they are formally defined in the UML 2.5 specification and are designed to ensure clarity, precision, and traceability in process modeling. The result is a diagram that is not just a visual sketch but a formalized behavioral specification that can be used in design reviews, testing, and even code generation.
UML Example Activity Diagram
Here’s a clear explanation of UML Activity Diagram notation, using the structure and elements from your provided example as a guide. I’ll walk through each part step by step, mapping it to standard UML symbols and conventions.
 The simple activity diagram above captures the most commonly used elements in activity diagrams — a great representative example for many real-world processes (e.g., user registration, order processing, booking systems).
1. Initial Node (Start)
- Symbol: ● (filled black circle)
- Meaning: The starting point of the entire activity / process.
- In your diagram: The top ● where the flow begins after any pre-conditions.
2. Action / Activity Node
- Symbol: Rounded rectangle (sometimes shown as a pill shape or rectangle with rounded corners)
- Meaning: Represents a single step, task, operation, or computation performed by the system or actor.
- In your diagram:
- Step 1, Step 2, Step 3
- Step 4.1 and Step 4.2 (parallel steps)
- Common labels: Verb phrases like “Validate input”, “Process payment”, “Send email”
3. Control Flow (Arrow)
- Symbol: Solid arrow → (sometimes with open arrowhead)
- Meaning: Shows the sequence of execution from one action to the next.
- In your diagram: All the solid arrows connecting steps.
- Dashed arrows (—-→) are sometimes used informally for actor input or data flow, though standard UML prefers solid for control flow and dashed/dotted for object flow.
4. Decision Node (Branch / Conditional)
- Symbol: ◇ (diamond)
- Meaning: Represents a branching point based on a condition (yes/no, true/false, or multiple guards).
- Guards: Written in square brackets [condition] on the outgoing edges.
- In your diagram:
- The first ◇ with “True?” → [Yes] to basic flow, [No] to alternative/extension.
- The second ◇ (returning alternative flow) that rejoins the main path.
5. Merge Node
- Symbol: Also ◇ (diamond) — same shape as decision, but used to recombine incoming flows.
- Meaning: Synchronizes multiple incoming paths into one outgoing path (no condition needed).
- In your diagram: The lower ◇ after the alternative flow returns to the main path.
Note: In simple diagrams, people sometimes reuse the same diamond for both decision and merge, but strictly they are separate (decision has one incoming / multiple outgoing; merge has multiple incoming / one outgoing).
6. Fork Node (for Parallel / Concurrent Activities)
- Symbol: Thick horizontal bar — (or vertical in some tools)
- Meaning: Splits a single flow into multiple concurrent (parallel) flows that can execute independently.
- In your diagram: The bar below Step 3 that splits into Step 4.1 and Step 4.2.
7. Join Node (Synchronization)
- Symbol: Thick horizontal bar — (same as fork, but used for joining)
- Meaning: Waits for all incoming parallel flows to complete before proceeding.
- In your diagram: The lower bar that recombines Step 4.1 and Step 4.2 before going to the final node.
8. Final Node (Activity Final)
- Symbol: ⊙ (bullseye: circle with filled inner circle) or sometimes just ● inside a circle
- Meaning: The end of the entire activity — all flows lead here when the process completes.
- In your diagram: The bottom ⊙ after post-conditions.
(Some diagrams also use a separate Flow Final node ⊗ to terminate only one path without ending the whole activity, but your example uses the full activity final.)
Additional Common Elements (Not in Your Sketch but Frequently Seen)
- Swimlanes / Partitions: Vertical or horizontal lanes labeled with actors/roles (e.g., Customer | System | Payment Gateway) to show who performs each action.
- Object Nodes / Pins: Rectangles for data being passed (e.g., Order object flowing between actions).
- Guard Conditions: [Yes], [No], [Age > 18], [Payment successful], etc.
- Notes: Small rectangles with folded corner for explanations.
Key Application Domains in Software and Business Environments
Activity diagrams are particularly effective in scenarios where procedural behavior, user interaction, and conditional logic are central to the process. Their value is amplified when used to model end-to-end workflows with multiple paths and error conditions.
1. Business Process Modeling
Organizations use activity diagrams to map internal workflows such as employee onboarding, order fulfillment, invoice processing, or customer support escalation. By visualizing each stage—from initial request to final resolution—teams can identify bottlenecks, redundancies, or compliance risks.
2. Use Case Expansion and Elaboration
Use case diagrams describe “what” a system does; activity diagrams explain “how.” For example, a use case like “Book a Room” can be expanded into a detailed activity flow that includes:
- User selects room type
- System validates dates
- Check-in must be before check-out
- If invalid, prompt user to correct dates
- If valid, check room availability
- Room is confirmed or rejected
- User receives email confirmation
This level of detail enables accurate estimation, risk identification, and functional validation before development begins.
3. System Workflow and Flow Control Design
From login flows to checkout pipelines, activity diagrams are essential for modeling the internal logic of software systems. Examples include:
- Login process with multi-factor authentication
- E-commerce checkout with payment gateway integration
- Appointment scheduling with doctor availability checks
- Video upload workflows involving size validation and retry logic
4. Algorithmic and Control Logic Representation
Complex software logic, such as loop-based validations, iterative retries, or conditional thresholds, can be effectively modeled using activity diagrams. For instance, a video upload process may:
- Attempt upload
- If failed (due to size or network), retry with a delay
- If retry fails after three attempts, notify user
Such workflows are difficult to describe in plain text but are naturally expressed in activity diagrams through loops, decision points, and exception branches.
5. Requirements Validation and Gap Analysis
Before coding begins, activity diagrams serve as a validation tool. They allow stakeholders to review whether all necessary steps, edge cases, and error paths are accounted for. Missing transitions, unhandled exceptions, or ambiguous loops can be identified early, reducing the likelihood of costly rework during implementation.
The AI Revolution in Process Modeling: From Text to UML in Seconds
Historically, creating a UML activity diagram required expertise in UML syntax, familiarity with modeling tools (e.g., Visual Paradigm, Lucidchart, Enterprise Architect), and iterative refinement. The process was time-consuming and often led to inconsistencies, especially when dealing with complex conditional logic or parallel processes.
Today, the integration of natural language processing (NLP) with UML generation tools has transformed how teams conceptualize and visualize workflows. Tools such as Visual Paradigm’s AI Activity Diagram Generator—accessible via its conversational chat interface at chat.visual-paradigm.com—allow users to describe a process in plain English and receive a fully compliant UML activity diagram in seconds.
How the AI Workflow Operates
The AI-powered generation process follows a structured, multi-stage interpretation pipeline:
- Intent Parsing: The system analyzes the user input to extract key components such as actions, conditions, decision points, and outcomes. It uses NLP models trained on domain-specific business language to interpret semantic meaning.
- Element Mapping: Each textual step is mapped to a UML element—e.g., “User selects room type” becomes a rounded rectangle labeled “User selects room type”.
- Flow Construction: Control flows are inferred from sequence and conditional statements. For example, “if check-in date is after check-out date, show error” generates a decision node with a guard condition and two outgoing paths.
- Layout Optimization: The AI arranges elements for optimal readability—balancing spacing, flow direction, and visual hierarchy—ensuring the diagram is intuitive and easy to follow.
- Validation and Enhancement: The generated diagram is cross-checked against UML standards. The AI ensures that all flows are properly connected, all decisions have guard conditions, and that merge points are correctly applied where needed.
This process is not just about automation—it introduces a new level of contextual intelligence. The AI doesn’t just generate diagrams; it interprets business intent, anticipates common edge cases, and suggests improvements to ensure completeness and robustness.
Practical Example: Hotel Reservation System
Consider the following prompt:
“Generate an activity diagram for the Book Room process in a Hotel Reservation System. The user selects a room type, enters check-in and check-out dates, the system validates these dates (check-in before check-out), checks room availability, and sends a confirmation email if successful. If dates are invalid or unavailable, show an error message and prompt the user to correct inputs.”
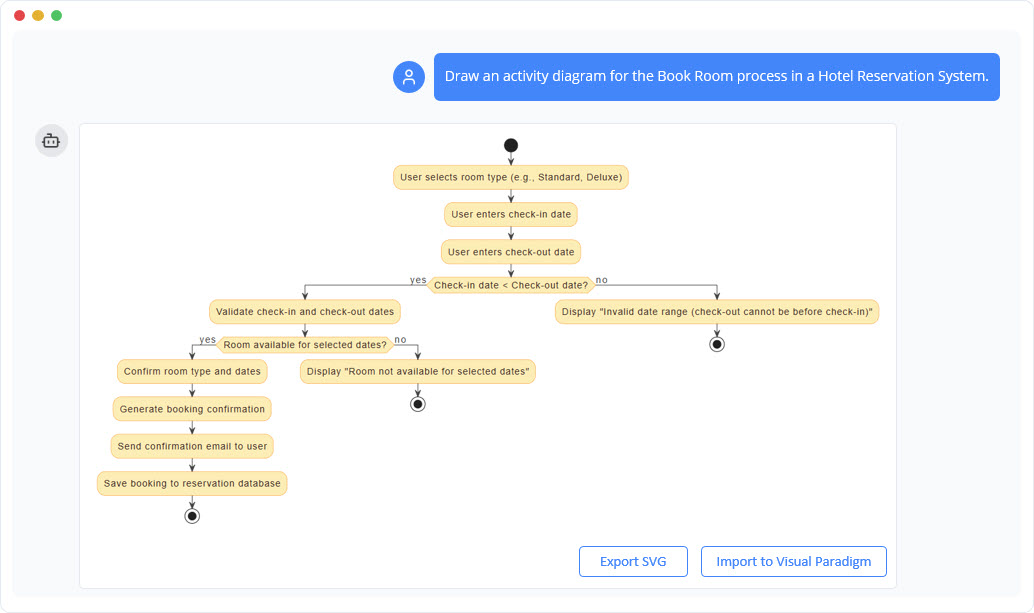
The AI-generated diagram includes:
- Initial node marking the start
- Action nodes for user input and system validation
- Decision node with guard: “Check-in date < Check-out date?”
- Two outgoing branches: one for valid dates (continues to availability check), one for invalid dates (loops back to input)
- Flow to room availability check with conditional outcome
- Successful path leads to email confirmation and database save
- Failure path includes error message and return to input
- Final nodes for success and failure outcomes
- Optional swimlanes: User vs. System
This example demonstrates how AI can interpret natural language with sufficient fidelity to produce a structurally sound, standards-compliant diagram that accurately reflects real-world business logic.
Advantages of AI-Driven Diagram Generation
Adopting AI-powered tools for activity diagram creation delivers significant benefits across technical, operational, and organizational domains:
- Speed and Efficiency: A full activity diagram is generated in under 10 seconds, compared to hours of manual work in legacy tools.
- Lower Skill Barrier: No prior UML experience is required. Business analysts, product owners, and non-technical stakeholders can now contribute to process modeling through natural language.
- Improved Accuracy: AI reduces human error by ensuring consistent syntax, proper flow connectivity, and absence of missing decisions or merges.
- Enhanced Collaboration: Teams can iterate on the diagram through conversational refinement—e.g., “Add a loop to retry after invalid date input” or “Include a swimlane for the Payment Module.”
- Early Risk Detection: The AI flags potential issues such as unconnected flows, missing guards, or unbalanced decision trees, enabling proactive refinement.
- Scalability: Teams can rapidly prototype multiple processes (e.g., booking, cancellation, refund) without relearning modeling fundamentals.
Limitations and Considerations
While powerful, AI-generated diagrams are not infallible. They may:
- Miss implicit assumptions or domain-specific rules (e.g., room cancellation policies)
- Over-simplify complex decision trees with poor granularity
- Generate diagrams that are logically accurate but contextually misleading without expert review
Therefore, AI should be viewed as a collaborative assistant, not a replacement for human judgment. Final diagrams should be reviewed and validated by domain experts to ensure completeness and fidelity to business rules.
Future Directions and Implications for Software Development
The integration of AI into UML modeling marks a pivotal shift in how software teams conceptualize and design processes. As generative AI matures, we can expect further advancements such as:
- Autonomous Diagram Generation from User Stories: Converting a user story like “As a guest, I want to book a room for two nights” directly into a full activity flow.
- Living Diagrams that Evolve with Requirements: Diagrams that automatically update as requirements change—perhaps triggered by a change in a use case or a new business rule.
- Linking to Code and Test Cases: AI systems generating initial diagrams that then auto-generate stub code or test scenarios based on control flow.
- Automated Code-to-Diagram and Diagram-to-Code Mapping: Bidirectional flows between design and implementation, reducing the gap between specification and execution.
This evolution points toward a conversational design paradigm, where stakeholders engage with a system through natural language, and the system responds with visual, formalized models in real time.
Conclusion: The Future of Process Modeling Is Conversational
UML activity diagrams remain a cornerstone of software and business process modeling. Their structured, formal approach ensures clarity in complex, conditional workflows—especially when used in conjunction with stakeholder communication and technical design.
However, the advent of AI-powered natural language generation has democratized access to these diagrams. What once required hours of modeling effort, UML knowledge, and specialized tools can now be achieved in minutes through simple, conversational prompts.
As teams continue to adopt this technology, the process of design will become more inclusive, faster, and more accurate. The future of diagramming is no longer about drawing—it’s about conversing.
Articles and resources
-
Free Online Activity Diagram Tool | Visual Paradigm: This is a web-based solution for visualizing workflows and business processes without requiring software installation.
-
What Is an Activity Diagram? | UML Guide by Visual Paradigm: An in-depth guide explaining the purpose, components, and use cases of activity diagrams in modeling system workflows.
-
Activity Diagram Tutorial | Step-by-Step Guide | Visual Paradigm: A comprehensive tutorial designed for beginners to learn how to model complex workflows using step-by-step instructions.
-
Activity Diagrams in Software Design | Visual Paradigm Handbook: A detailed handbook section on using activity diagrams to map out system behavior and decision points effectively.
-
Mastering UML Activity Diagrams with AI | Visual Paradigm Blog: This post explores how AI-powered features enhance the creation and optimization of activity diagrams for developers and analysts.
-
Generate Activity Diagrams from Use Cases Instantly with Visual Paradigm’s AI: This resource highlights how the AI engine enables rapid and accurate conversion of use cases into professional diagrams.
-
Mastering Swimlane Activity Diagrams: A Practical Guide with Examples: A guide focused on creating swimlane diagrams to visualize workflows across different roles or departments.
-
Convert Use Case to Activity Diagram – AI-Powered Transformation: Details an AI transformation tool that automatically converts use case diagrams into detailed activity diagrams.
-
Advanced Activity Diagram Software Features | Visual Paradigm: An overview of powerful tool capabilities, including real-time collaboration and extensive export options.
-
Activity Diagram Guide | Visual Paradigm User Manual: A technical reference in the user manual covering all aspects from basic diagram creation to advanced modeling.