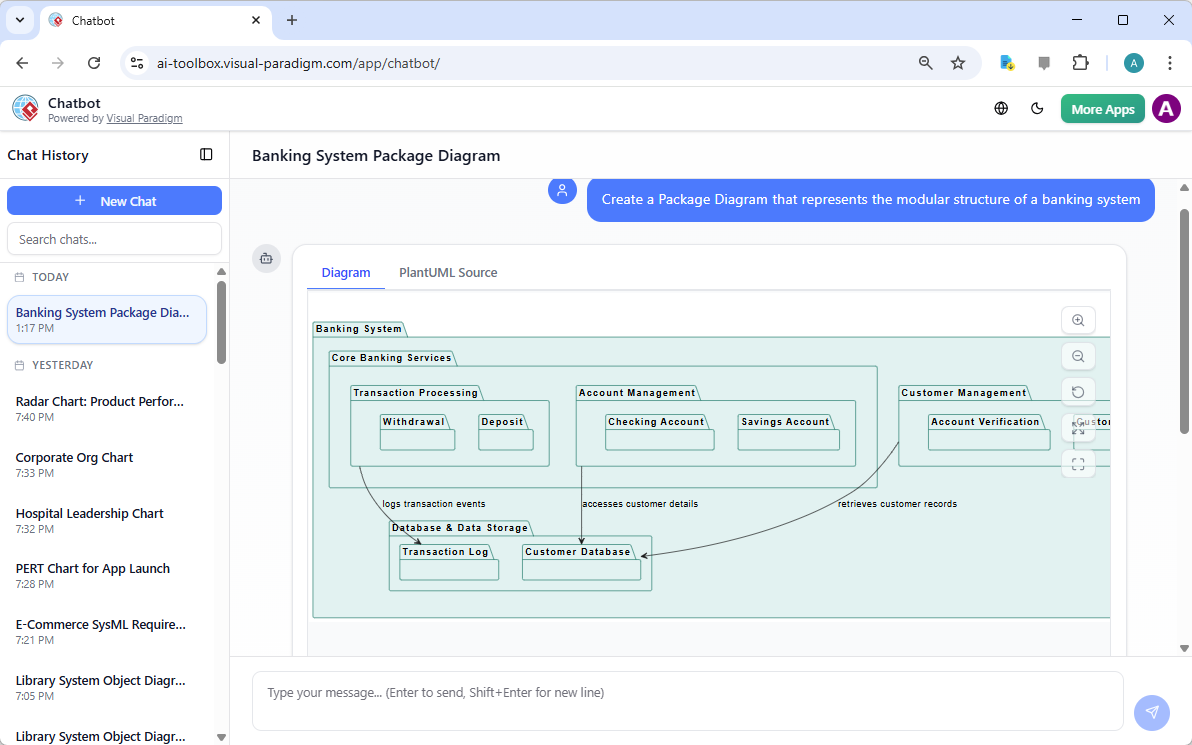
Discover how AI guides your use case journey from problem to report with Visual Paradigm’s intelligent development assistant.
想象一下,你是一名项目经理,负责推出一个新的在线课程平台。首要挑战是清晰地阐述问题,然后将其转化为一个功能系统。这时,用例驱动开发助手,这是来自Visual Paradigm的AI驱动工具,它会介入其中。它不仅帮助你撰写文档,还引导你完成一个完整且结构化的流程,将模糊的想法转化为详细且可执行的项目计划。这一过程如此直观,仿佛有一位经验丰富的业务分析师和技术架构师与你并肩工作。本文深入探讨了这一强大工具的核心功能,通过一个在线课程平台的真实案例,展示它如何简化整个用例生命周期。
快速概览:用例驱动开发助手的核心要点
步骤1:借助人工智能定义问题
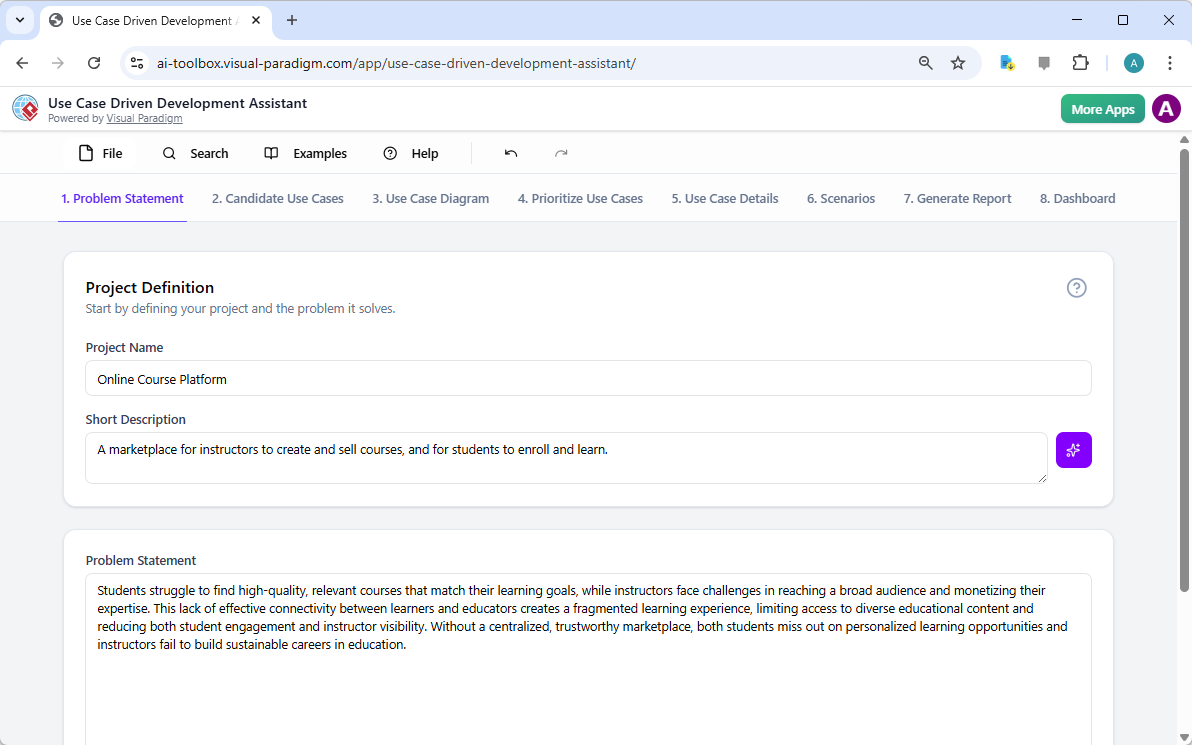
每个成功的项目都始于对所要解决的问题的清晰理解。使用用例驱动开发助手的旅程始于“问题陈述”标签页。在这里,你输入项目名称和简短描述。人工智能随后利用这些信息生成一份全面的问题陈述。如图1所示,该工具已将项目名称“在线课程平台”和简短描述“一个供讲师创建和销售课程、学生注册学习的市场”转化为详尽的叙述。该叙述指出了核心痛点:学生难以找到相关课程,而讲师则面临难以触达广泛受众以及变现专业知识的挑战。这一由人工智能生成的问题陈述成为项目的基石,确保团队成员从一开始就拥有统一的理解。
步骤2:借助人工智能识别用例
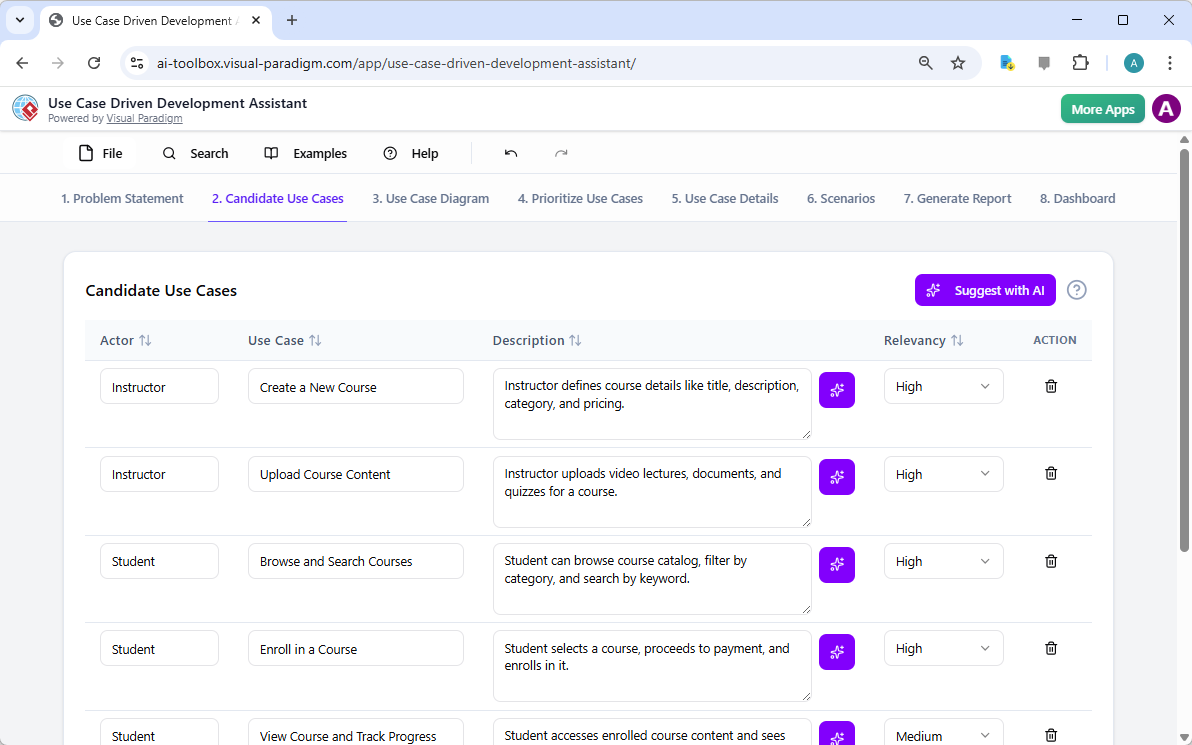
问题明确后,下一步是识别系统必须提供的关键功能。助手的“候选用例”标签页,如图2所示,该过程实现了自动化。在分析问题陈述后,人工智能会提出一组用例,每个用例都与一个参与者(如讲师、学生或管理员)相关联。对于我们的在线课程平台,人工智能提出了诸如“创建新课程”、“上传课程内容”、“浏览和搜索课程”以及“注册课程”等用例。这一列表提供了坚实的基础,节省了原本需要在头脑风暴会议中耗费的大量时间和精力。你可以进一步优化这些建议,添加新用例,或删除无关项,从而形成一份全面的系统功能列表。
步骤3:通过用例图可视化系统
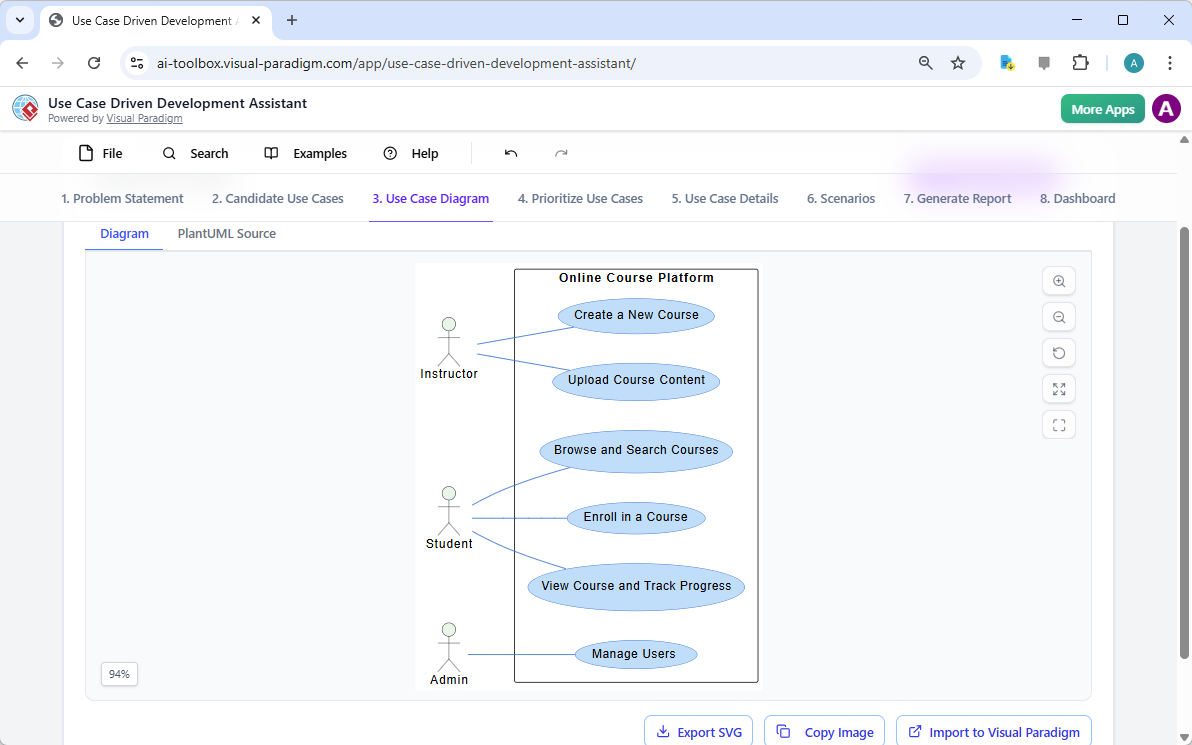
在确定用例后,至关重要的是可视化它们与系统参与者的交互方式。在“用例图”标签页中,如图3所示,该工具将用例和参与者列表自动转化为清晰的图形化表示。该图展示了参与者(讲师、学生、管理员)与系统功能(如创建新课程等)之间的关系。人工智能驱动的生成确保了图表的准确性与专业排版。这一可视化工具在沟通中极为宝贵,使利益相关者、开发人员和设计师无需阅读冗长的文本文档,即可快速理解系统的范围和功能。
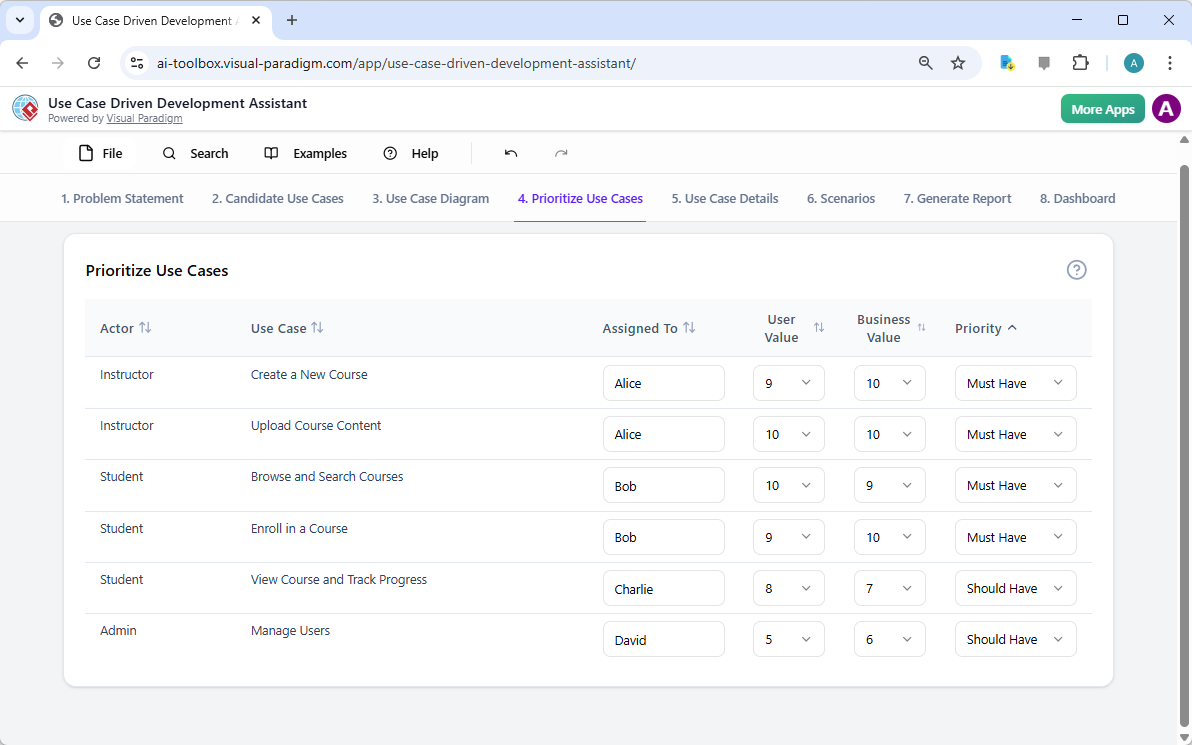
步骤4:优先排序功能以实现最大影响
并非所有用例都同等重要。项目的成功往往取决于首先聚焦于最关键的功能。如图4,提供了一个强大的框架。它允许你为每个用例分配用户价值和业务价值(在0-10的量表上),然后应用MoSCoW优先级方法(必须有、应该有、可以有、不会有的)。在我们的示例中,AI已帮助识别出“创建新课程”和“上传课程内容”是“必须有”的功能,因为它们对平台的核心功能至关重要。这种结构化的优先级划分确保开发团队专注于为用户和业务提供最高价值,避免在低优先级功能上浪费精力。
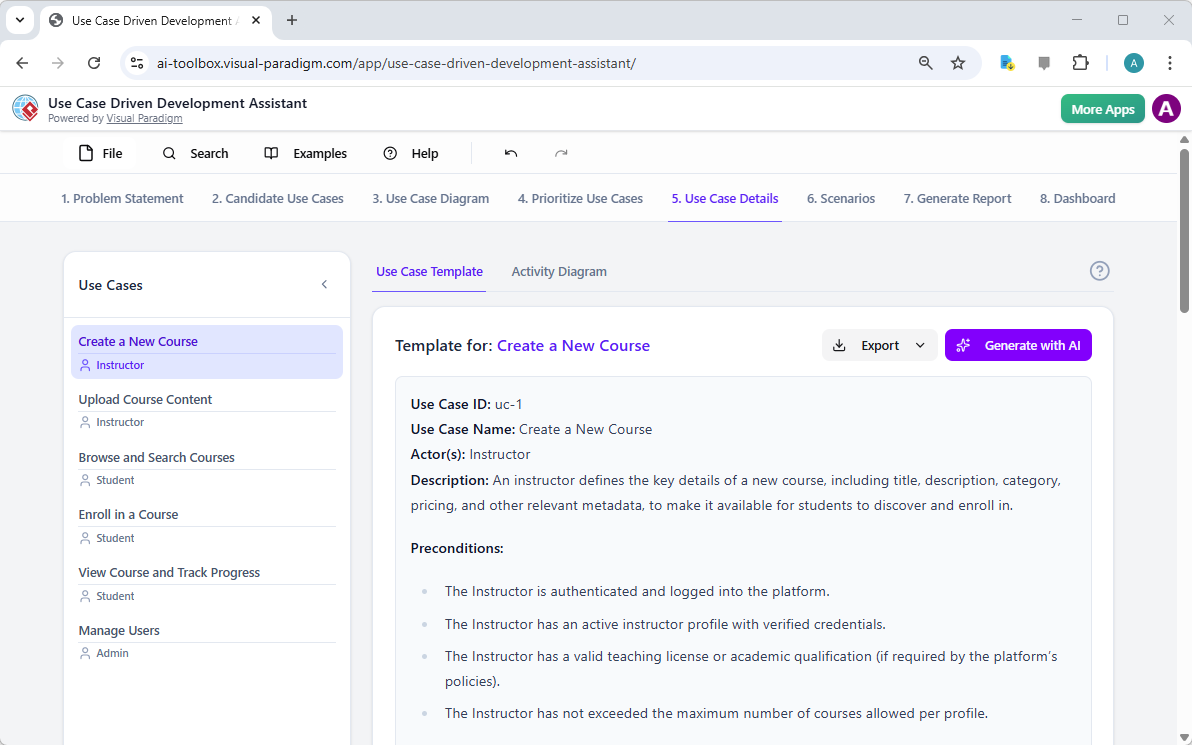
步骤5:详细说明用例并生成活动图
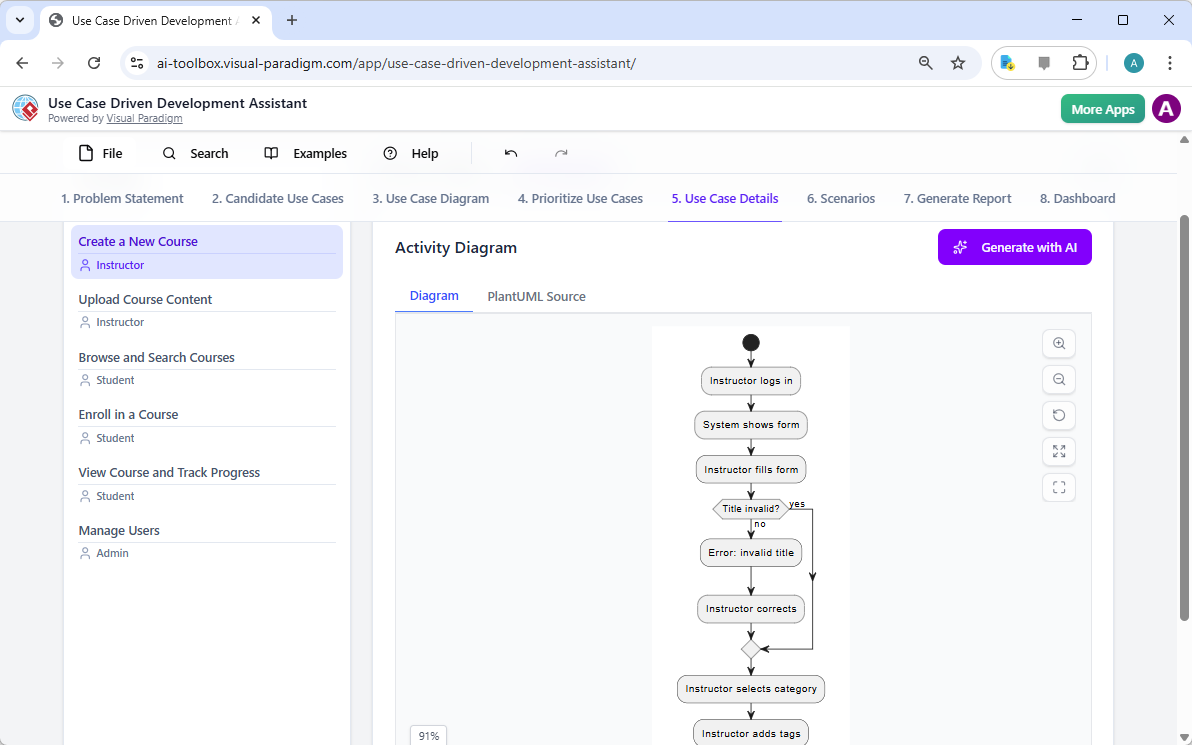
在建立高层视图后,下一步是深入每个用例的细节。如图所示,“用例详情”选项卡图5,允许你为选定的用例创建一个全面的模板。AI可以生成详细的描述,包括前置条件、主流程和替代流程。对于“创建新课程”用例,AI提供了一个结构化模板,列出了必要的步骤。为进一步增强理解,助手可以为同一用例生成“活动图”,如图所示图6。该图直观地展示了逐步的工作流程,从讲师登录到课程保存的整个操作序列。这种详细程度对开发人员和质量保证团队都至关重要。
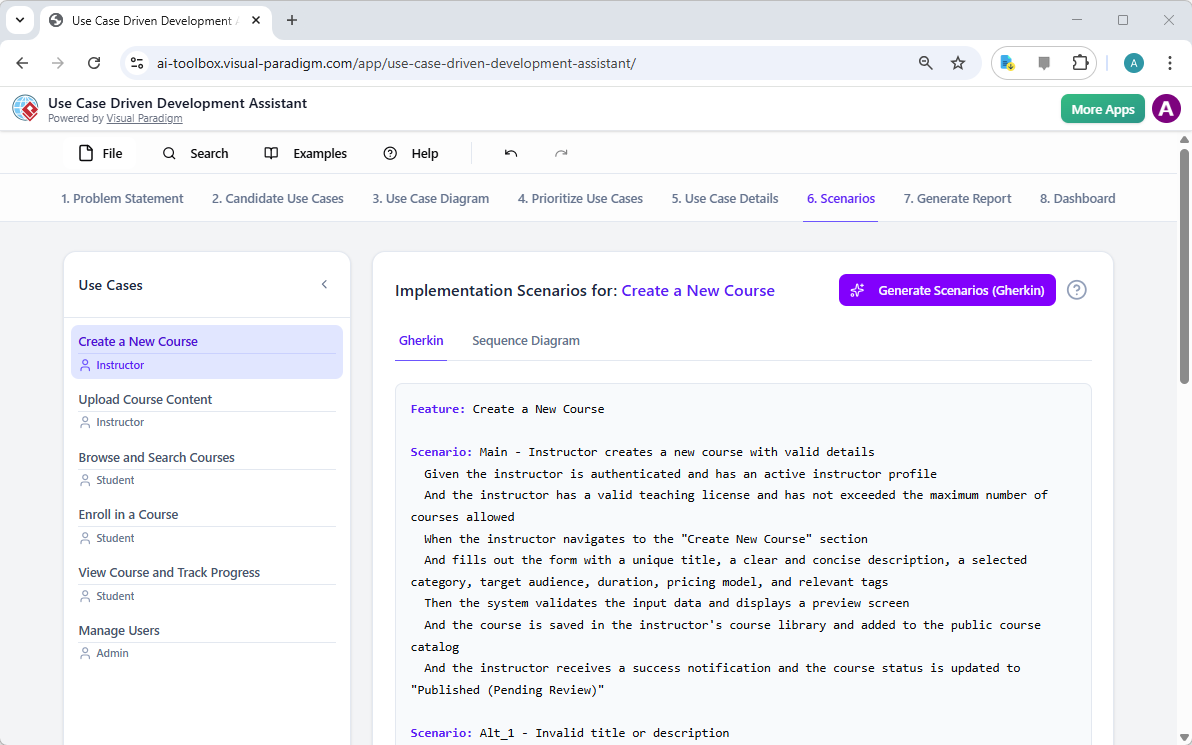
步骤6:生成测试场景和序列图
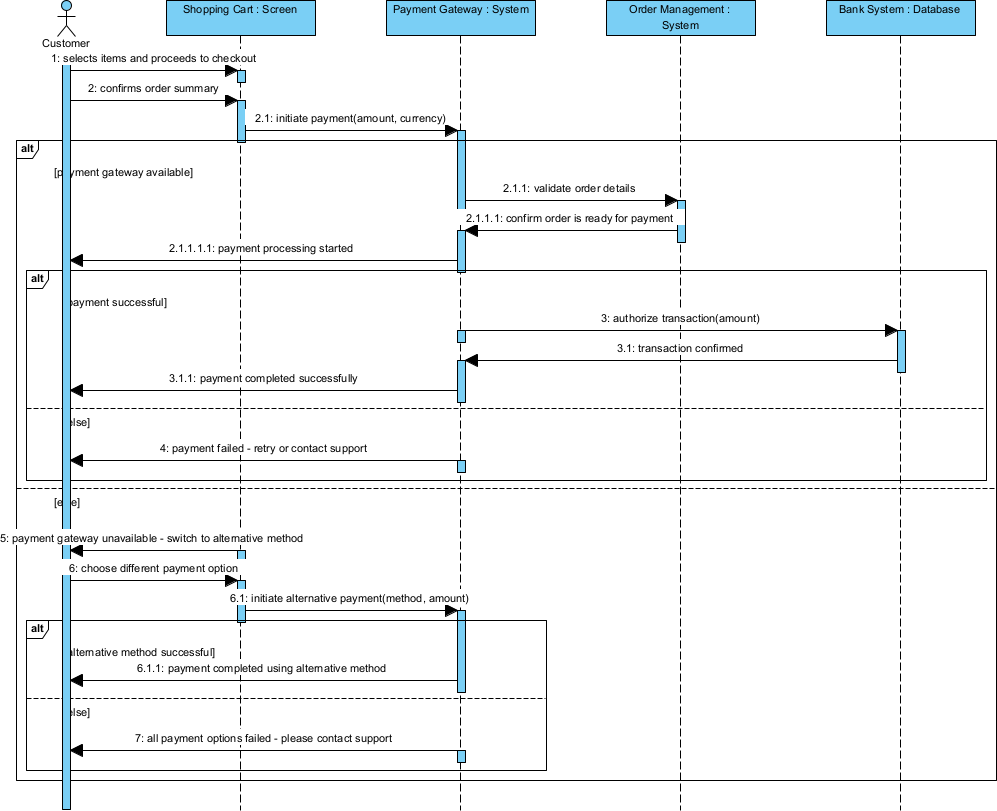
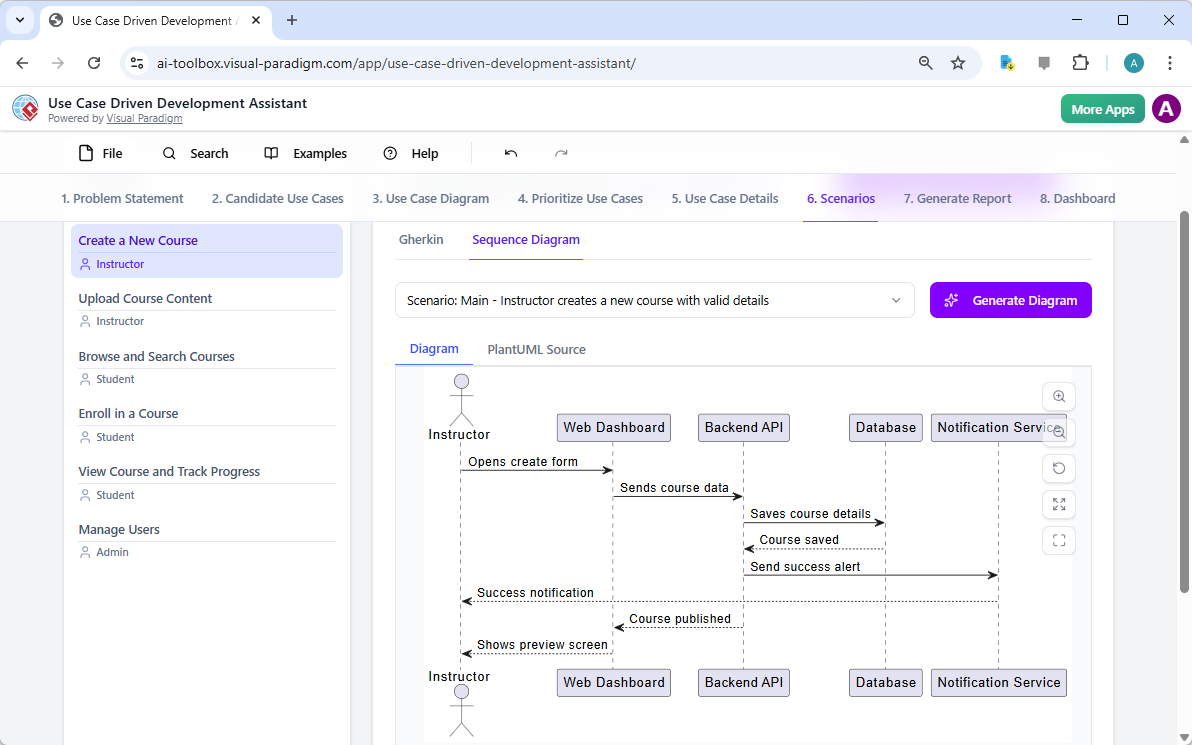
对于开发团队而言,下一步的关键步骤是创建可测试的场景。如图所示,“场景”选项卡图7,允许你直接从用例描述中生成可执行的Gherkin场景。这些场景以自然语言格式(给定-当-则)编写,非常适合自动化测试。AI可以生成主场景和替代场景,例如标题无效的情况。为进一步阐明系统的内部运作,助手可以生成“序列图”,如图所示图8。该图展示了讲师、网页仪表板、后端API、数据库和通知服务之间的交互,清晰地呈现了系统的架构和数据流。
步骤7:创建全面的项目报告
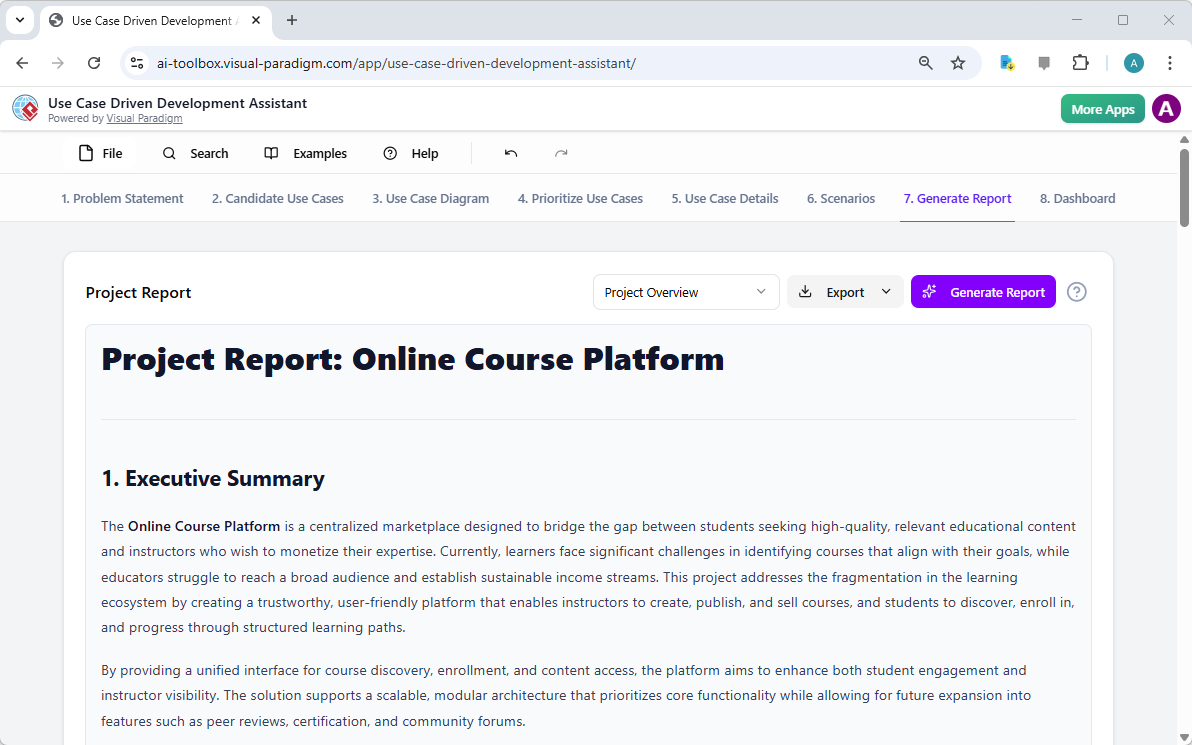
在整个开发过程中,向各类利益相关者沟通项目状态和计划至关重要。如图所示,“生成报告”选项卡图9,使这一过程变得简单。你可以生成多种报告,例如“项目概览”、“实施计划”、“质量保证测试计划”或“开发人员任务列表”。这些报告由AI辅助生成,确保内容一致且全面。例如,“项目概览”报告总结了整个项目,包括执行摘要、关键功能以及优先级划分的理由。这一单一信息源确保所有人员保持一致并充分知情。
步骤8:通过仪表板跟踪进度
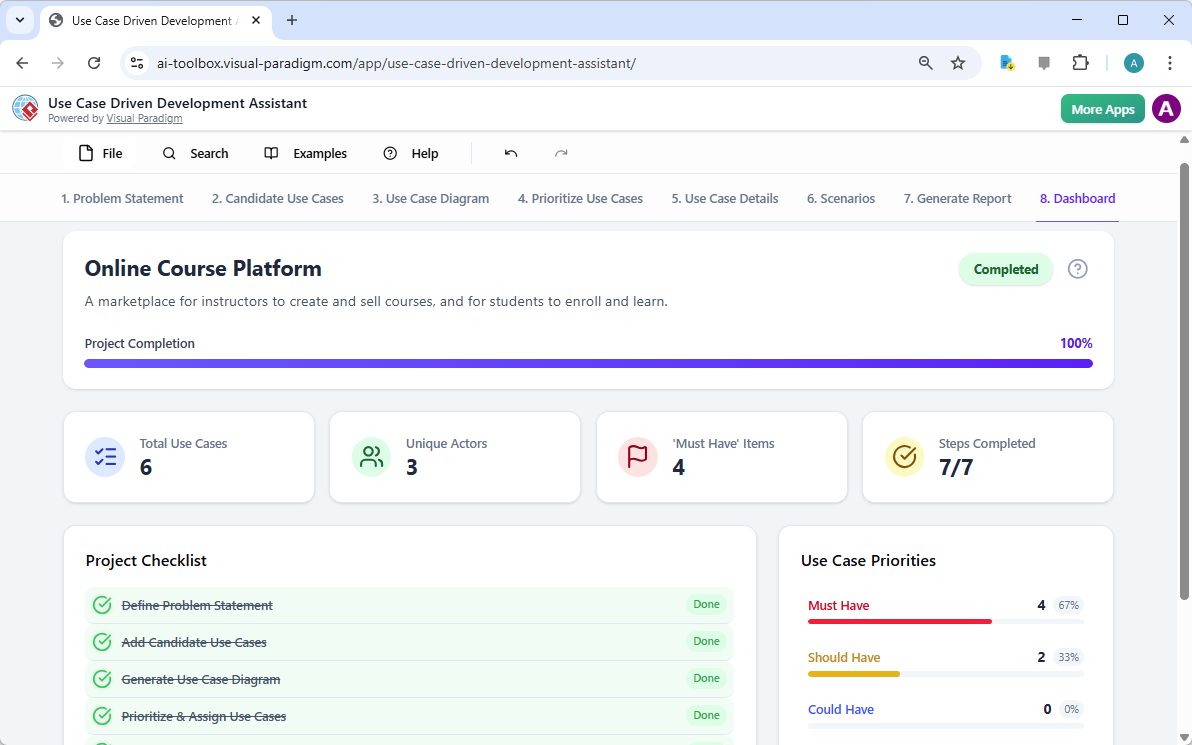
最后,整个过程在“仪表板”中达到顶点,如图所示图10。这个中心枢纽提供了项目状态的高层概览。它显示了项目完成百分比、用例总数以及“必须有”项目的数量。项目清单让你可以跟踪进度,每个完成的步骤都会标记为“已完成”。对项目健康状况的实时可视化对项目经理和团队负责人至关重要,有助于他们识别瓶颈并确保项目按计划推进。
用例驱动的开发助手不仅仅是一个工具;它是一套全面的工作流程,为软件开发过程带来清晰性和效率。通过在每个阶段利用人工智能——从问题定义到报告生成——它帮助团队更快、更准确地从需求过渡到实现。结果是一个结构清晰、文档完善的项目,与业务目标和用户需求高度一致。如果你希望优化用例开发流程,这款人工智能驱动的工具是一个强大的解决方案。
准备好了解用例驱动的开发助手如何改变你的下一个项目吗?立即试用.
相关链接
用例建模是一种基础的软件工程技术,用于捕获功能需求通过可视化外部参与者和系统内部功能之间的交互。现代平台现在结合了基于人工智能的自动化来优化图表,生成全面的用例描述,并将模型转换为测试用例或活动图以保持设计的一致性和可追溯性。先进的工具如事件流编辑器和场景分析器使开发团队能够验证并记录结构化的事件序列,以提高整个系统的清晰度。
-
什么是用例图?——UML建模完整指南:深入概述涵盖关键组件、目的和最佳实践用于需求建模。
-
逐步用例图教程——从入门到精通:实用资源,指导用户掌握从基础到高级的技术以创建有效的用例图。
-
关于用例建模你需要知道的一切:全面探讨用例建模的原则与应用在系统设计中的应用。
-
Visual Paradigm – 用例描述功能: 详细说明用于精确记录用户交互以及结构化的系统行为。
-
掌握使用 Visual Paradigm 的 AI 驱动用例图: 介绍如何利用 AI 创建智能且动态的图表用于现代软件系统。
-
使用 Visual Paradigm 事件流编辑器的指南: 逐步说明如何记录结构化的事件序列在用例场景中。
-
通过用例场景分析器解析场景: 介绍如何使用分析器来检查和优化交互流程以提高系统清晰度。
-
将用例转换为活动图——AI 驱动的转换: 介绍自动化转换将用例转换为详细系统工作流。
-
使用 AI 从用例图生成场景和测试用例: 探讨 AI 工具如何自动化创建以需求为导向的测试流程.
-
用例图图库——模板与示例: 精心挑选的真实世界示例用于激发灵感、学习和快速原型设计。